West Michigan Stock Returns
By Yatin Bhagwat, Ph.D., Professor, Department of Finance
Esteban Hernandez, Ph.D., Assistant Professor, Department of Finance
"West Michigan Stock Prices Declined 4.3% in 2025"
The West Michigan Stock Index declined 4.3 percent in 2025, underperforming the Dow Jones Industrial Average, the S&P 500, and the NASDAQ Composite during a year marked by elevated interest rates, slowing consumer demand, and heightened dispersion across industries. The index outperformed a U.S. SIC-4 Peer Portfolio, which declined 8.3 percent, highlighting the role of firm-specific developments and regional composition in shaping outcomes.
While overall performance was modestly negative, stock returns varied widely across firms, with company-specific developments, most notably merger and acquisition activity, playing a decisive role. Relative outcomes were further shaped by industry exposure, as West Michigan-based firms are disproportionately concentrated in consumer-facing and manufacturing sectors that faced cyclical headwinds. Despite the index decline, several firms generated strong positive returns, underscoring the importance of attribution-based, that is, separating the effects of corporate transactions, industry conditions, and firm-specific fundamentals, to understand what drove regional stock market performance.
Index Performance and Market Context
Table 1 presents annual returns for the West Michigan Stock Index from 2023 through 2025, alongside a U.S. SIC-4 Peer Portfolio and three major national equity benchmarks—the Dow Jones Industrial Average, the S&P 500, and the NASDAQ Composite. The table also reports compound and annualized returns over the three-year period to provide additional context for recent performance.
Table 1: Stock Market Returns
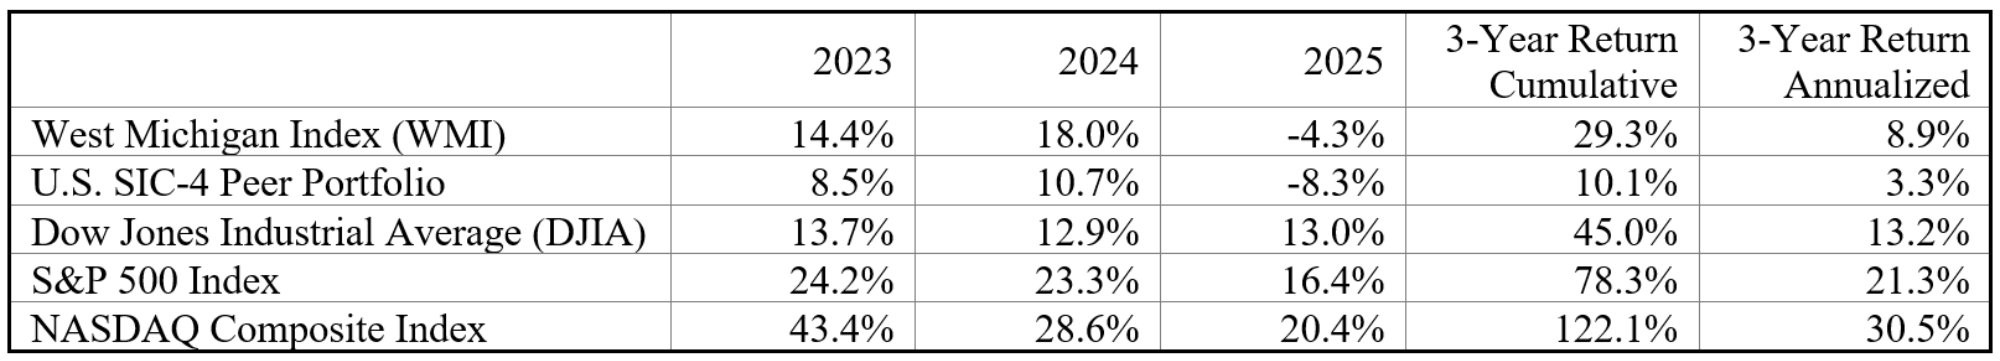
Note: The 3-year return reflects the cumulative (geometric) stock return over the 2023–2025 period. Returns for 2025 are calculated using stock prices as of the last trading day of the year.
Description: Table 1 reports annual returns for five indices (West Michigan Stock Index, U.S. SIC-4 Peer Portfolio, DJIA, S&P 500, NASDAQ Composite) for 2023–2025, along with cumulative three-year returns and annualized three-year returns.
Source: Authors’ calculations using data from Compustat, Yahoo Finance, and published index levels from S&P Dow Jones Indices and Nasdaq. Shares outstanding, SIC-4 industry classifications, and 2023–2024 opening and closing prices are from Compustat; 2025 opening and closing prices are from Yahoo Finance. SIC-4 industry benchmark returns and the U.S. SIC-4 Peer Portfolio are constructed by the authors from U.S. publicly traded firms operating in the same four-digit SIC industries.
The results highlight a clear divergence between national equity markets and West Michigan–based publicly traded firms in 2025. While national indices posted solid gains, 13.0 percent for the Dow Jones Industrial Average, 16.4 percent for the S&P 500, and 20.4 percent for the NASDAQ Composite, the West Michigan Stock Index declined 4.3 percent. Over the same period, the U.S. SIC-4 Peer Portfolio declined 8.3 percent, indicating that firms operating in similar industries nationwide also faced headwinds, though the magnitude of underperformance differed.
The primary driver of these differences was index composition. National benchmarks benefited disproportionately from strong performance in large-cap technology and growth-oriented sectors, while both the West Michigan Stock Index and the SIC-4 peer portfolio were more heavily exposed to manufacturing, consumer-facing, and capital-intensive industries that faced cyclical pressure amid elevated interest rates and slower end-market growth.
Over the 2023–2025 period, West Michigan stocks generated a 29.3 percent compound return, equivalent to an 8.9 percent annualized return, broadly consistent with long-run equity market performance despite greater year-to-year volatility. By comparison, the U.S. SIC-4 Peer Portfolio produced a 10.1 percent compound return (3.3 percent annualized), while national indices delivered substantially higher cumulative gains, reflecting sustained strength in growth-heavy sectors. These contrasts reinforce the importance of industry composition and firm-level drivers in shaping regional equity outcomes.
Index Construction and Benchmarking Framework
The West Michigan Stock Index consists of publicly traded companies headquartered in West Michigan and is constructed using market-capitalization weights, defined as each firm’s stock price multiplied by shares outstanding. This approach mirrors the methodology used by broad market indices such as the NASDAQ Composite and ensures that larger firms exert proportionally greater influence on index performance.
To provide a structurally relevant benchmark, a U.S. SIC-4 Peer Portfolio is constructed using four-digit Standard Industrial Classification definitions and weighted to match the industry composition of the West Michigan Stock Index. This portfolio serves as an industry-matched national comparison, allowing regional stock performance to be evaluated relative to firms operating in similar lines of business rather than against growth-heavy national indices alone.
Firm-Level Dispersion in 2025
Table 2 reports individual stock returns for the fifteen companies comprising the West Michigan Stock Index in 2025 and highlights pronounced dispersion in firm-level performance. Returns ranged from a gain of 46.8 percent for SpartanNash to a decline of 85.0 percent for Meritage Hospitality, underscoring the dominant role of firm-specific and event-driven developments beneath the aggregate index outcome.
This dispersion reflects a combination of acquisition-related valuation effects, large-cap normalization, cyclical demand pressures, and interest-rate sensitivity across industries. While some firms significantly outperformed their SIC-4 industry benchmarks, often due to transaction-driven repricing, others underperformed peers facing similar industry conditions, resulting in large negative excess returns. Together, these patterns illustrate why index-level performance masks substantial heterogeneity at the firm level and motivate the firm-by-firm analysis that follows.
Table 2: West Michigan Company Returns
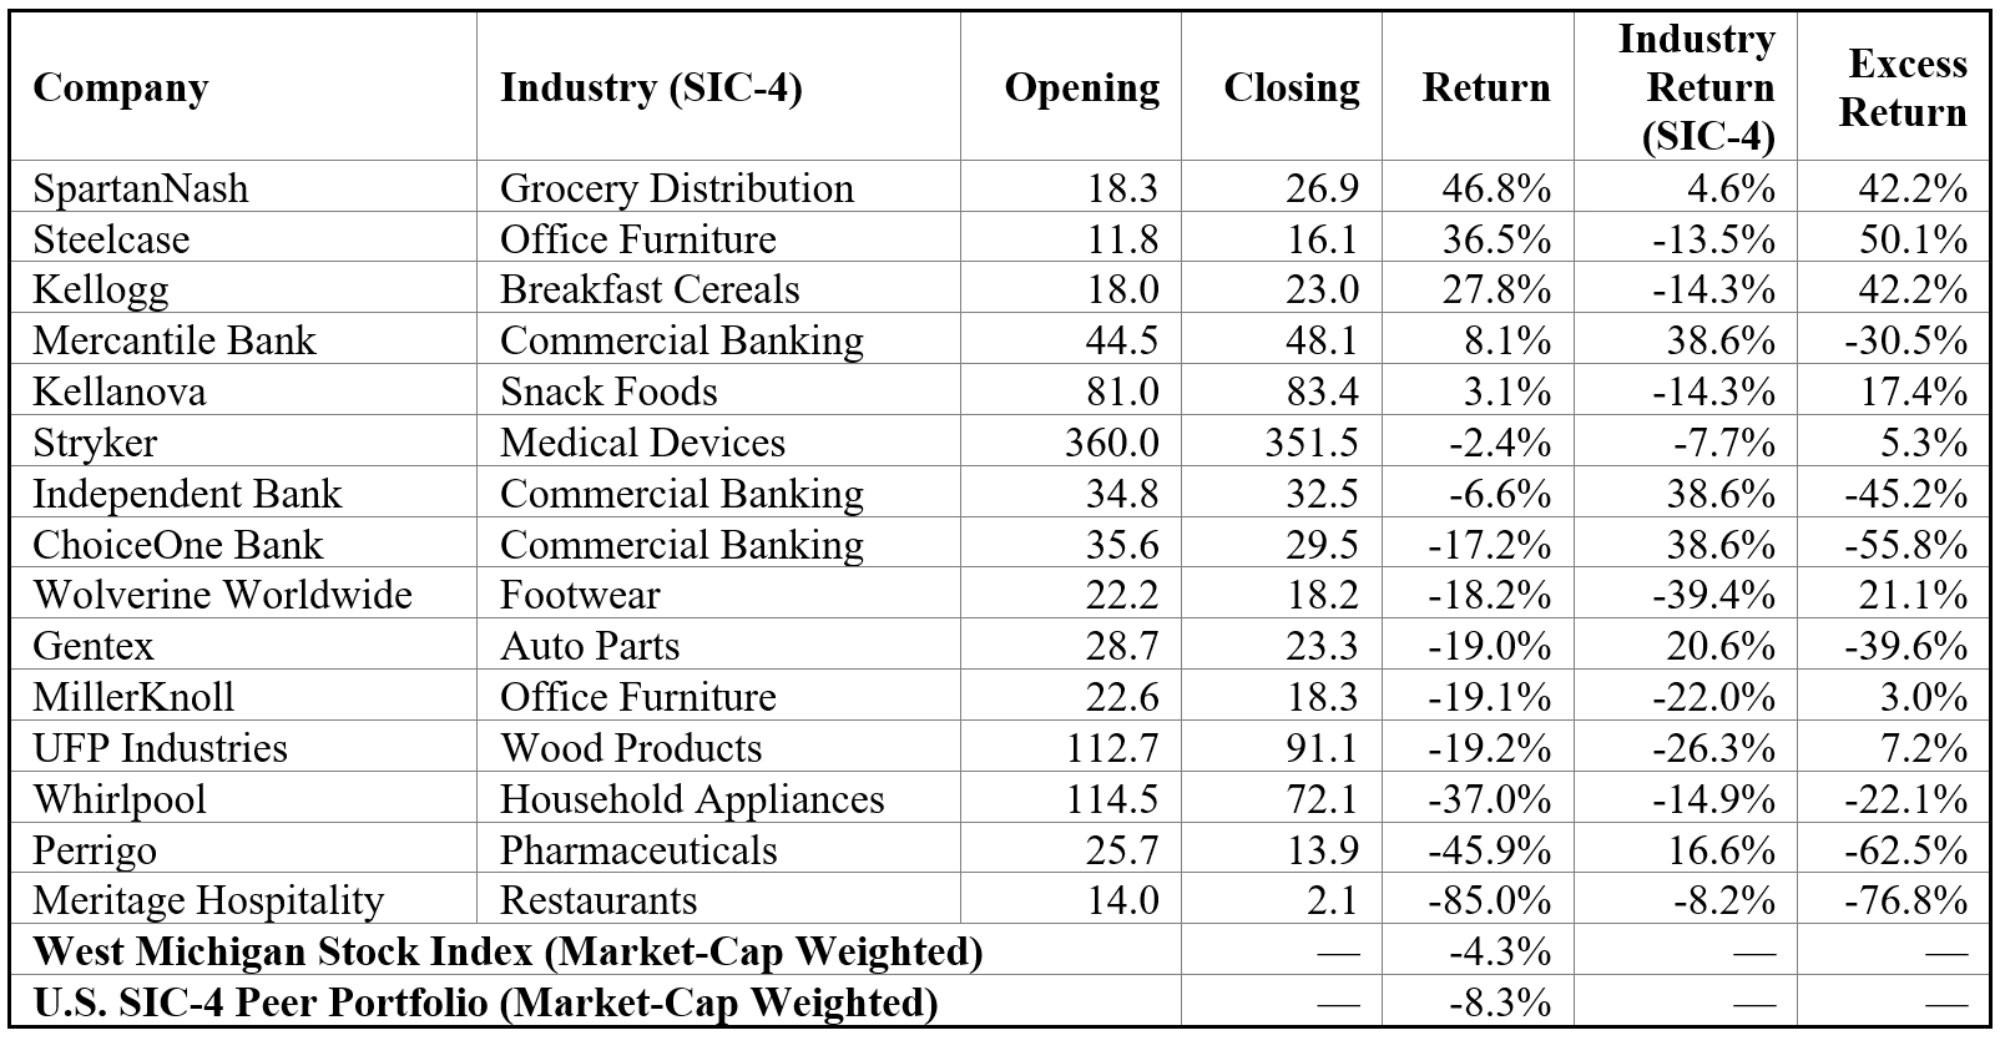
Note: Industry returns and the U.S. peer portfolio are based on four-digit SIC classifications and reflect market-capitalization–weighted returns for firms operating in the same primary lines of business.
Description: Table 2 lists the 2025 returns for each West Michigan Stock Index constituent, showing opening and closing prices, the firm’s 2025 return, the SIC-4 industry benchmark return, and the resulting excess return. It also reports the market-cap-weighted West Michigan Stock Index return and the U.S. SIC-4 Peer Portfolio return.
Source: Authors’ calculations using data from Compustat, Yahoo Finance, and published index levels from S&P Dow Jones Indices and Nasdaq. Shares outstanding, SIC-4 industry classifications, and 2023–2024 opening and closing prices are from Compustat; 2025 opening and closing prices are from Yahoo Finance. SIC-4 industry benchmark returns and the U.S. SIC-4 Peer Portfolio are constructed by the authors from U.S. publicly traded firms operating in the same four-digit SIC industries.
The firm-level discussions that follow examine stock performance for companies in the West Michigan Stock Index in 2025, ordered from highest to lowest return as reported in Table 2. For firms involved in merger and acquisition transactions, returns are interpreted primarily as event-driven valuation outcomes. For other firms, performance is evaluated relative to SIC-4 industry benchmarks and assessed in the context of industry conditions and firm-specific execution, drawing on quarterly earnings reports and management commentary.
2025 Acquisition-Driven Stock Performance
SpartanNash
SpartanNash shares returned 46.8 percent in 2025, the strongest performance among West Michigan–based firms and well above its SIC-4 industry benchmark of 4.6 percent. The stock’s outperformance was driven primarily by acquisition-related valuation effects following the announcement of an all-cash acquisition by C&S Wholesale Grocers at $26.90 per share, representing a substantial premium to the pre-announcement trading price. Most of the appreciation occurred around the transaction announcement, consistent with an event-driven repricing rather than improving operating fundamentals.
Quarterly earnings reports corroborate this interpretation. While SpartanNash reported modest revenue growth during the first half of 2025, operating earnings and net income declined due to margin pressure, higher interest expense, and transaction-related costs. Management commentary emphasized competitive conditions in wholesale grocery distribution and continued demand challenges, indicating that the 2025 stock return largely reflected transaction valuation rather than operational improvement.
Steelcase
Steelcase shares returned 36.5 percent in 2025, the second-strongest performance in the index and well above its SIC-4 industry benchmark of 5.6 percent. The stock’s performance reflected acquisition-related valuation effects following the announcement of a definitive merger agreement under which HNI Corporation agreed to acquire Steelcase in a cash-and-stock transaction valued at approximately $2.1 billion.
Disclosures in HNI’s third-quarter 2025 Form 10-Q show that the pending acquisition generated $8.3 million in transaction-related expenses and $1.4 million in incremental interest expense, contributing to lower quarterly net income despite modest revenue growth. These disclosures support the view that Steelcase’s 2025 stock return reflected deal-driven valuation expectations rather than improved operating performance.
Kellogg
Kellogg shares returned 27.8 percent in 2025, ranking as the third-strongest performer in the West Michigan Stock Index and outperforming its SIC-4 industry benchmark, which declined 11.4 percent. As with SpartanNash and Steelcase, performance was driven primarily by transaction-related valuation effects following the announced acquisition of WK Kellogg Co. by Ferrero.
According to WK Kellogg’s Form 10-Q for the quarter ended June 28, 2025, the company operated in a challenging consumer packaged-goods environment, with modest revenue trends and continued cost pressure. Management emphasized margin management and productivity initiatives but reported no material inflection in underlying demand or earnings prior to the transaction. Following the acquisition’s completion on September 26, 2025, Kellogg’s stock experienced a step-change revaluation consistent with the transaction terms, indicating an event-driven outcome rather than sustained operational outperformance.
Fundamentals-Driven Performance: Large-Cap Normalization
Stryker
Stryker shares declined 2.4 percent in 2025 following a year of strong prior performance. In 2024, the stock rose 20.2 percent, materially outperforming the West Michigan Stock Index and contributing significantly to aggregate index gains. Against that backdrop, the modest decline in 2025 reflects valuation normalization after prior-year outperformance rather than a deterioration in underlying business fundamentals.
Quarterly earnings reports support this interpretation. In the third quarter of 2025, Stryker reported 10.3 percent year-over-year net sales growth and 9.5 percent organic growth, driven by higher volumes across its MedSurg & Neurotechnology and Orthopaedics segments. Adjusted earnings per share increased 11.1 percent, and management raised full-year guidance. Although reported margins were pressured by acquisition-related and integration costs, core operating performance remained solid.
Given Stryker’s dominant index weight, approximately 70 percent of total market capitalization, even a modest stock price decline had a meaningful impact on aggregate index performance in 2025. Overall, Stryker’s return is best viewed as consolidation following prior-year gains rather than evidence of weakening fundamentals within the medical technology sector. Its performance was broadly consistent with that of large U.S. medical technology peers, which also experienced more muted returns after strong prior-year appreciation.
West Michigan Banks
Stock performance among West Michigan’s regional banks in 2025 reflected declining interest rates, net interest margin compression, and disciplined credit management, rather than firm-specific corporate events. As monetary policy eased, asset yields declined more rapidly than funding costs, while loan growth remained moderate and deposit competition persisted. Credit quality across the group remained sound, supporting earnings stability despite margin pressure.
It is important to note that the SIC-4 Commercial Banking benchmark includes a broad set of U.S. banks, ranging from community institutions to large national and super-regional banks. As a result, relative underperformance versus the industry benchmark partly reflects differences in scale, business mix, and capital market exposure, rather than weaker operating fundamentals among West Michigan–based regional banks.
Mercantile Bank Corporation
Mercantile Bank shares returned 8.1 percent in 2025, outperforming the West Michigan Stock Index despite lagging the SIC-4 industry benchmark. Earnings performance was supported by stable loan demand and strong credit quality. Nonperforming loans remained below 0.25 percent of total loans, and capital ratios exceeded regulatory well-capitalized thresholds, reinforcing balance-sheet strength amid margin compression.
Independent Bank Corporation
Independent Bank shares declined 6.6 percent in 2025, reflecting weaker performance than Mercantile but broadly consistent with pressure across regional banking stocks. Earnings reports indicated continued profitability and conservative balance-sheet management; however, the stock exhibited greater sensitivity to margin compression and investor concerns around earnings momentum as interest rates declined. This outcome highlights dispersion within the regional banking group despite generally sound credit conditions.
ChoiceOne Financial Services
ChoiceOne Financial Services shares declined 17.2 percent in 2025, underperforming both regional peers and the broader index. While credit quality remained manageable, the bank showed heightened sensitivity to margin compression and restructuring-related costs, contributing to weaker investor sentiment relative to larger and more diversified competitors within the industry benchmark.
Consumer and Industrial Cyclicals
Whirlpool
Whirlpool shares declined 37.0 percent in 2025, making it one of the weakest performers in the West Michigan Stock Index and a clear example of fundamentals-driven underperformance among consumer durables. The decline followed stronger prior-year performance and reflected demand normalization, margin pressure, and heightened promotional intensity across the global appliance industry rather than firm-specific corporate events.
Third-quarter 2025 earnings reports show modest revenue growth in North America but significant margin deterioration. Whirlpool reported a 1.8 percent GAAP operating margin (based on standard accounting rules) and 4.5 percent ongoing EBIT margin (earnings before interest and taxes, adjusted for one-time items), down sharply year over year, reflecting promotional activity, tariff-related costs, and inventory pre-loading by foreign competitors. Although management expressed confidence in eventual margin recovery as industry conditions normalize, near-term fundamentals remained challenged throughout 2025.
Gentex
Gentex shares declined 17.7 percent in 2025, confirming the broader pattern of cyclical underperformance among industrial suppliers. The stock’s decline reflected weaker global automotive production outside North America and tariff-related headwinds rather than a deterioration in Gentex’s competitive position or execution.
Gentex’s third-quarter filings show consolidated net sales growth driven by the VOXX acquisition, while core revenue declined 6 percent. Despite this, core gross margin expanded 140 basis points to 34.9 percent through cost controls and favorable product mix. Management cited tariff costs and geographic demand weakness as primary constraints on earnings growth, reinforcing the view that underperformance was cyclical rather than execution driven.
Wolverine Worldwide
Wolverine Worldwide shares fell 15.0 percent in 2025 following strong gains in the prior year. The decline reflected normalization in discretionary consumer demand and continued softness in footwear and apparel spending, despite progress in brand repositioning, inventory management, and operational efficiency initiatives.
UFP Industries
UFP Industries shares declined 17.0 percent in 2025 amid weaker demand tied to residential construction and housing-related end markets. Following several years of exceptional performance, the company experienced a cyclical pullback as housing activity slowed and input-cost volatility weighed on margins.
MillerKnoll
MillerKnoll shares declined 26.3 percent in 2025, reflecting persistent challenges in office furniture demand. Uncertainty around office utilization and corporate capital spending constrained orders and margins, despite management’s emphasis on cost discipline and portfolio integration efforts.
Idiosyncratic and Firm-Specific Underperformance
Perrigo
Perrigo shares declined 45.9 percent in 2025. While demand for consumer self-care products remained relatively stable, ongoing portfolio restructuring, cost initiatives, and legal and regulatory uncertainty weighed on investor sentiment throughout the year. Management emphasized efforts to streamline operations and improve long-term profitability, but near-term earnings visibility remained constrained, contributing to the stock’s underperformance.
Meritage Hospitality Group
Meritage Hospitality Group shares fell 85.0 percent in 2025, the weakest performance among West Michigan–based firms. The decline reflected firm-specific operational challenges, heightened sensitivity to discretionary consumer spending, and limited liquidity typical of over-the-counter traded securities. As a result, stock performance was dominated by company-level financial and market-structure factors rather than broader industry conditions.
Conclusion
What Drove West Michigan Stock Returns in 2025
Stock performance among West Michigan–based publicly traded firms in 2025 was shaped by several distinct economic mechanisms rather than a single dominant trend. The strongest returns reflected acquisition-related valuation effects, while the region’s largest firm (Stryker) experienced normalization following prior-year outperformance, disproportionately influencing aggregate index results. At the same time, consumer and industrial cyclicals faced headwinds from moderating demand, margin pressure, and global production variability, and regional banks navigated a shifting interest-rate environment marked by margin compression alongside disciplined credit performance.
Together, these dynamics explain why aggregate index results masked substantial dispersion at the firm level and underscore the importance of distinguishing between event-driven outcomes, cyclical forces, and firm-specific fundamentals when interpreting regional equity performance. The 2025 experience highlights that understanding how returns are generated is often more informative than focusing solely on what the headline index return delivers.