The Impact of Tariffs on West Michigan Exports
By Gerry Simons, Ph.D., Professor, Department of Economics
Wei Sun, Ph.D., Professor, Department of Economics
Weizhao Sun, Ph.D., Assistant Professor, Department of Economics
In 2025, President Trump introduced and/or raised existing import tariffs on a wide range of goods. Although there have been immediate impacts, it is too early to know what the overall effect of these tariffs will be on the Michigan and West Michigan economies. However, President Trump also used import tariffs during his first term in office. In this article we examine what effects we can see from those earlier tariffs on international trade in our regional economies and the implications for the effects of the current tariffs.
President Trump began using tariffs in 2018, with initial tariffs targeting solar cells, washing machines, steel, and aluminum. Although these tariffs applied to any country of origin, the administration also began to target goods imported specifically from China. Within a few months, other countries, including China, the European Union (EU), India, and Russia, responded with their own tariffs. This trade war escalated with additional tariff rate increases in 2019. An uneasy agreement was made in early 2020 with a reduction of U.S. tariffs on Chinese goods and a promise by China to increase its purchases of certain U.S. exports. However, with the collapse in world trade during the COVID-19 pandemic, the promised purchases went unfulfilled. For the most part, the import tariffs in place by the end of the first Trump administration were maintained during the first three years of President Biden’s administration. However, President Biden raised the tariff on aluminum imports from Russia to 200% following Russia’s invasion of Ukraine, and in 2024 he also increased tariffs on a variety of Chinese imports including semiconductors and electric vehicles. President Biden also eased some of the tariffs on imports from the E.U. and the United Kingdom.
The International Trade Administration (ITA) in the U.S. Department of Commerce provides data on annual exports of goods from each state as a whole and from 380 metropolitan statistical areas (MSAs) around the country, including the Grand Rapids-Wyoming-Kentwood MSA (which covers Barry, Ionia, Kent, Montcalm, and Ottawa counties, later referred to as “Grand Rapids”), and the Muskegon-Norton Shores MSA (which covers Muskegon county, later referred to as “Muskegon”). In this article, West Michigan is the combination of these two MSAs.
The effective tariff rate, as calculated by the USITC, measures the value of customs duties as a percentage of total imports. Although the effective tariff rate does not show specific rates for specific industries, products, or countries, it does serve as a good approximation of the overall tariff environment. Figure 1 shows the effective tariff rate and exports from West Michigan for 2013-2023.
As shown in Figure 1, the effective tariff rate stayed between 1.4-1.5% from 2013 to 2017, indicating a stable and low tariff environment. With the heating up of the trade war in 2019, the effective tariff rate jumped to 2.6% and stayed between 2.4-3% through 2023, marking a significantly elevated tariff environment. Exports from both of the West Michigan MSAs can be seen dropping after 2018, coinciding with the start of the trade war and well before the global decline in international trade experienced during the COVID-19 pandemic of 2020. The increase in exports seen after 2020 and the connection to the effective tariff rate should be interpreted with caution. The effective tariff rate and the corresponding retaliatory tariffs from other countries increased in 2021, which would ordinarily lead to a decline in exports. The increase in exports in 2021 shown in Figure 1 is a reflection of the easing of the COVID-19 pandemic and not a reflection of changes in the tariff environment.
Figure 1. West Michigan Exports
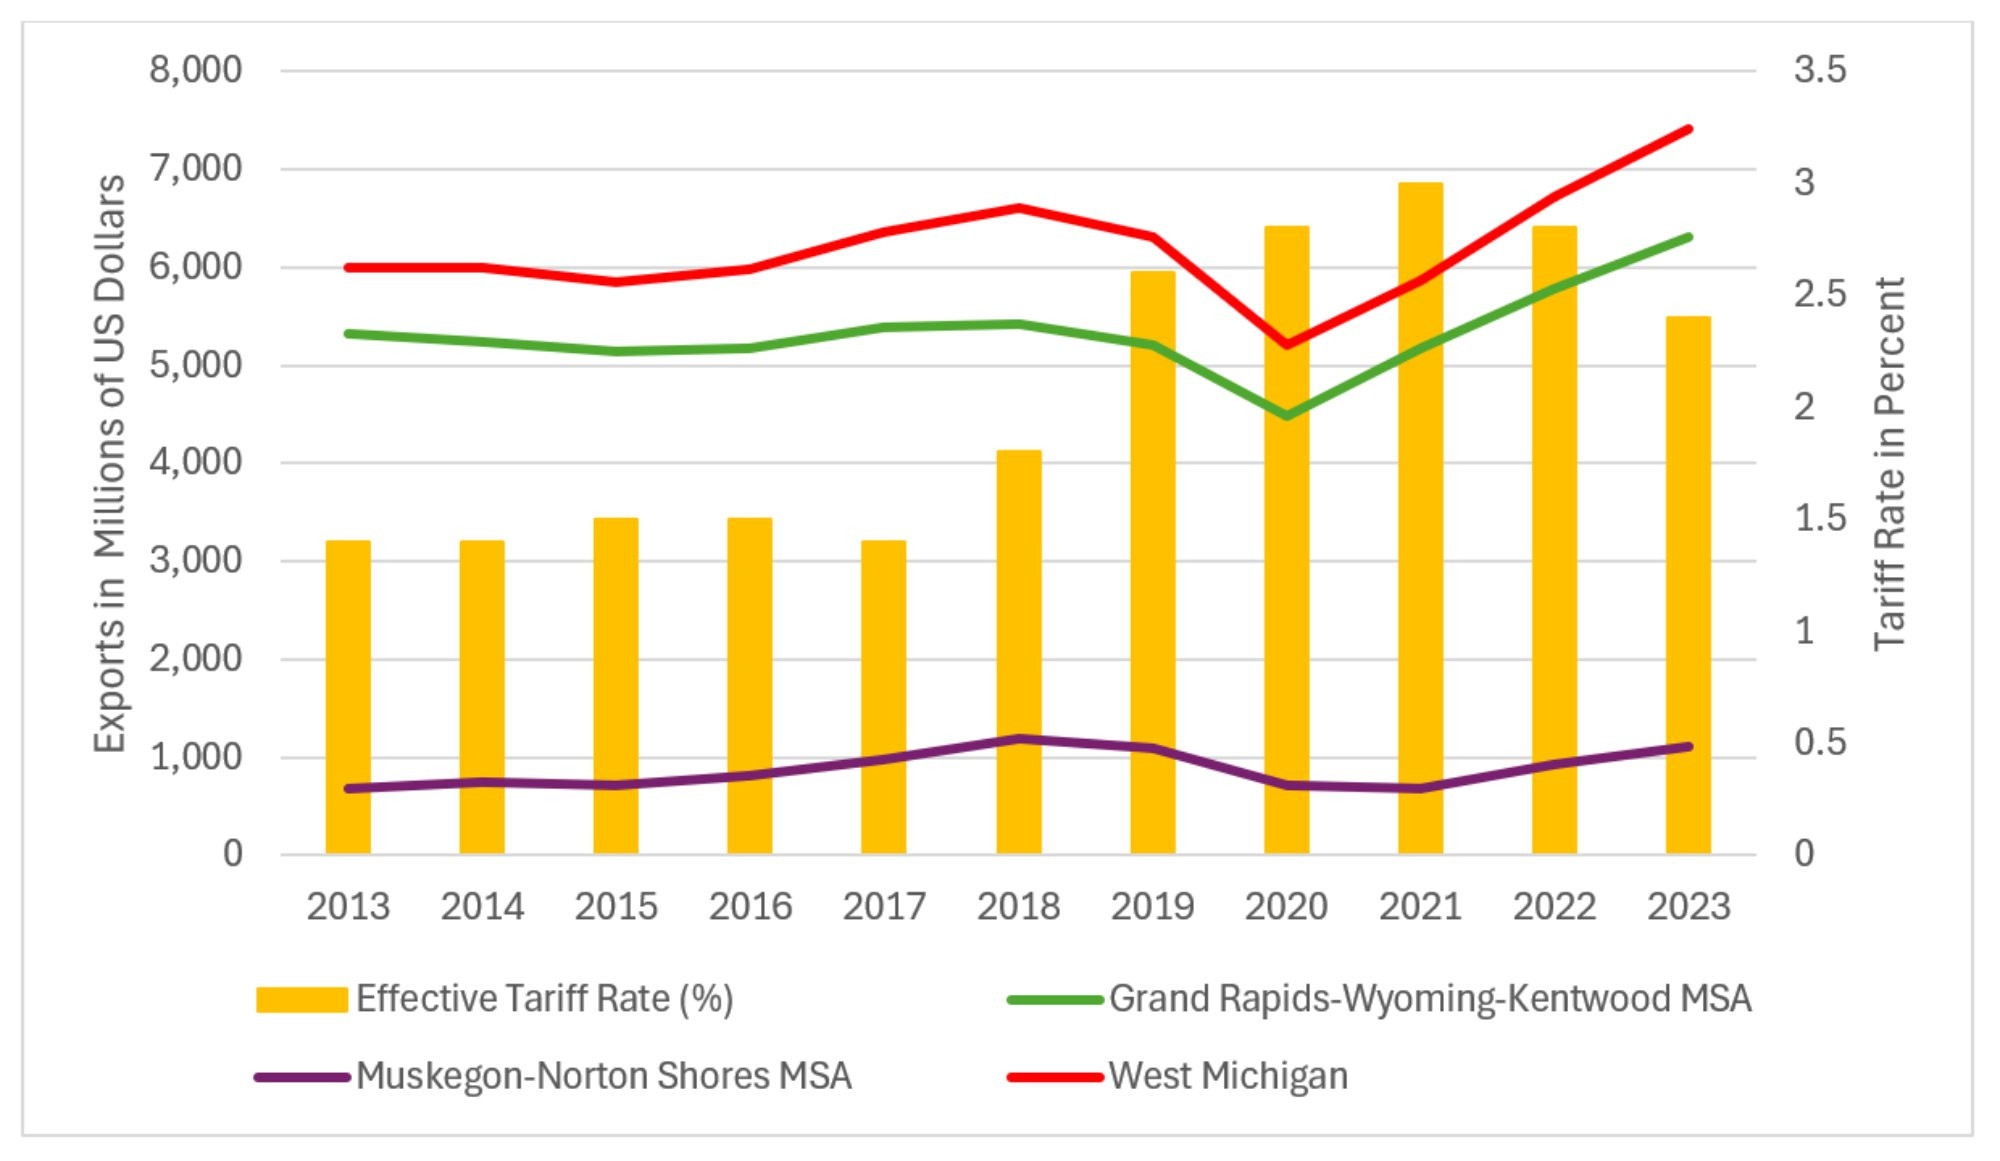
Description: The West Michigan Exports Figure 1 shows the significant increase in the effective tariff rate during the trade war and also shows that exports declined when the trade war began.
Source: ITA, U.S. International Trade Commission (USITC) and authors’ calculations.
The impact of tariffs on our economy can also be seen when looking at international trade growth rates. Figure 2 shows the growth rate of trade and the effective tariff rate for 2013-2023 for both West Michigan and Michigan as a whole. The low and stable tariff period of 2013-2017 was marked with positive export growth while the early years of the trade war saw negative growth for both state and West Michigan exports as well as state imports. Although not shown in Figure 2, Muskegon was the most vulnerable to tariffs in the region. Muskegon exports fell by 8.2% in 2019, the first full year of the trade war, compared with 3.8% for Grand Rapids and 3.5% for the state. This pattern continued for the following two years, with Muskegon experiencing lower export growth rates than Grand Rapids and Michigan as a whole.
Figure 2. International Trade Growth Rates
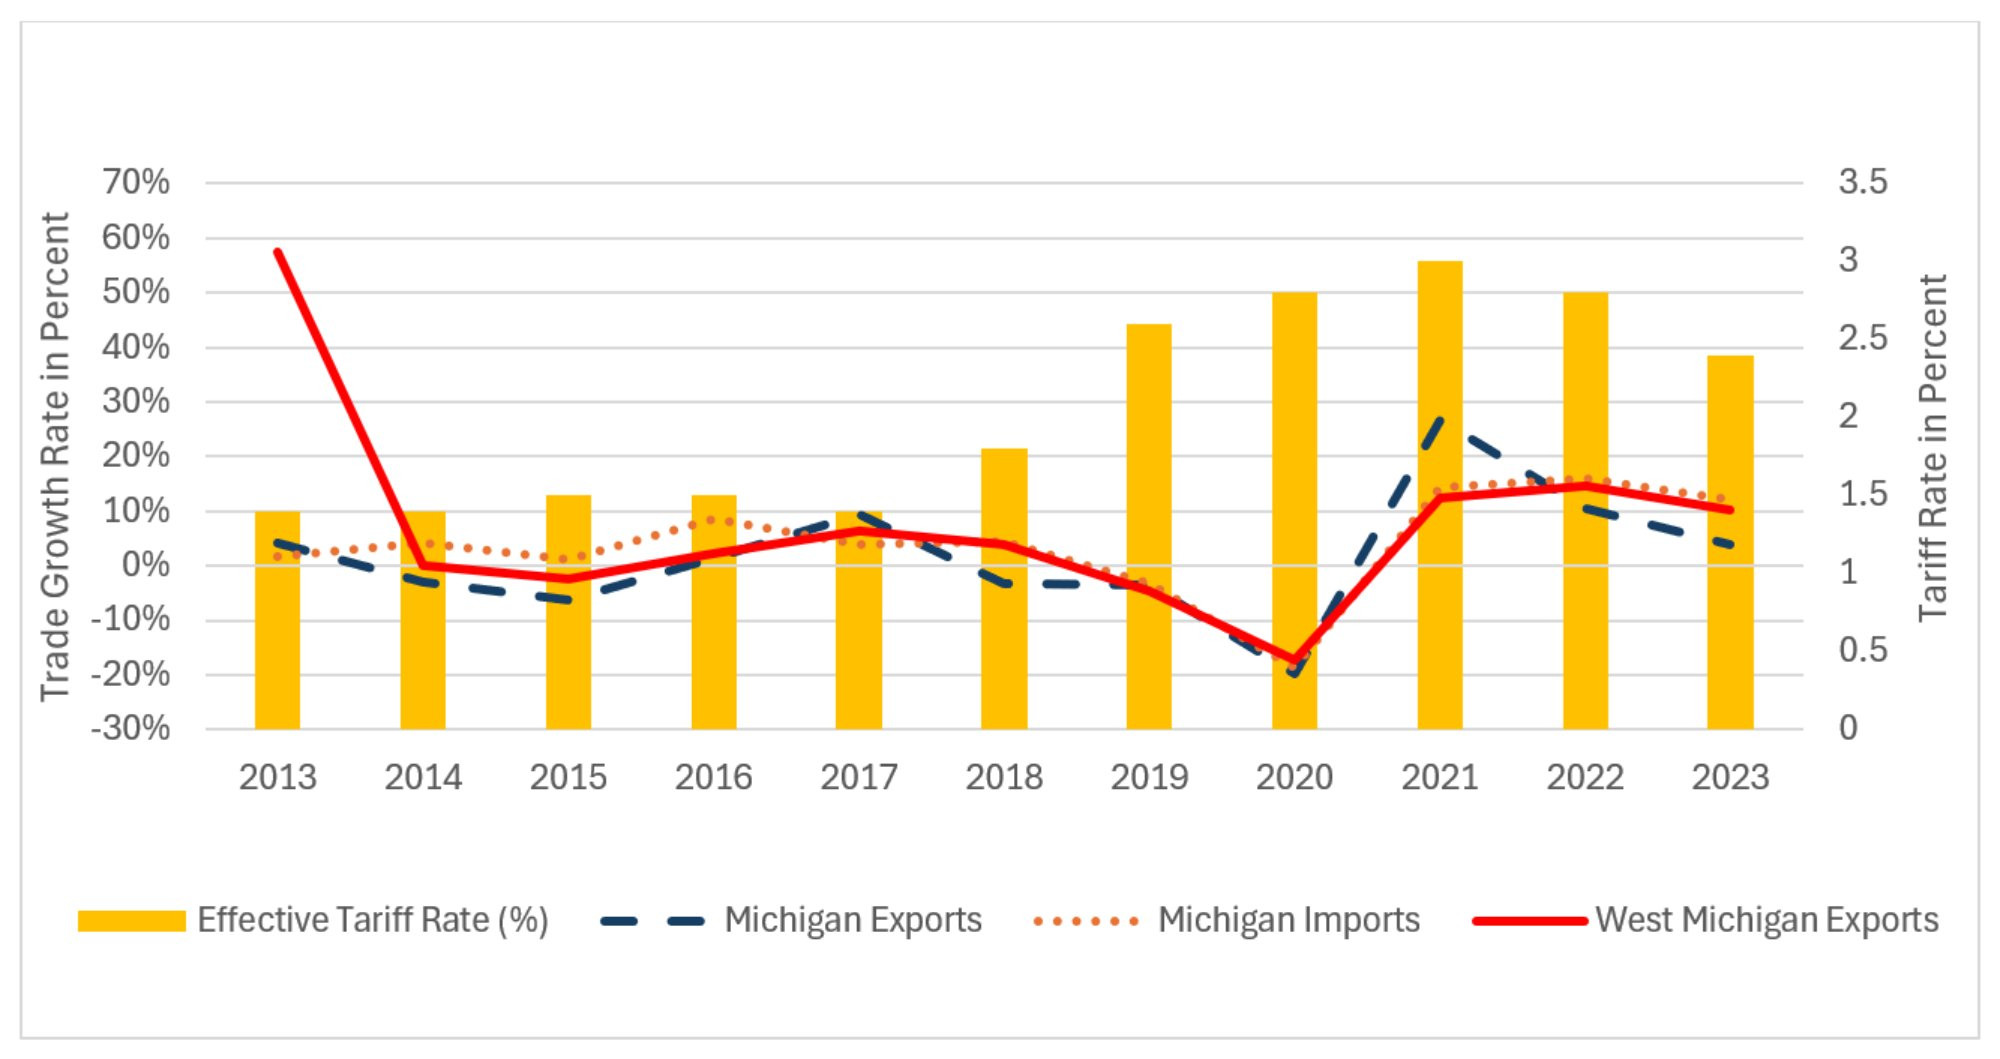
Description: The International Trade Growth Rates Figure 2 shows steady growth in trade before the trade war and negative growth rates in the early years of the trade war.
Source: ITA, U.S. International Trade Commission (USITC) and authors’ calculations.
The period of rising tariffs from 2018-2021 coincided with sharply falling export values and increased volatility in export growth across nearly all major sectors as shown in Figure 3. Tariffs make foreign imported raw materials and industrial parts more expensive, adding to the cost of local production, and making locally produced goods more expensive and less competitive in the world market. In addition, as experienced beginning in 2018, tariffs often lead to retaliation by foreign governments, creating further barriers and extra costs for the export of local products. These effects are evident in the Transportation Equipment and Furniture & Fixtures sectors in West Michigan, whose exports fell by approximately 10% and 7% respectively in 2019 alone.
Figure 3. West Michigan Exports by Sector
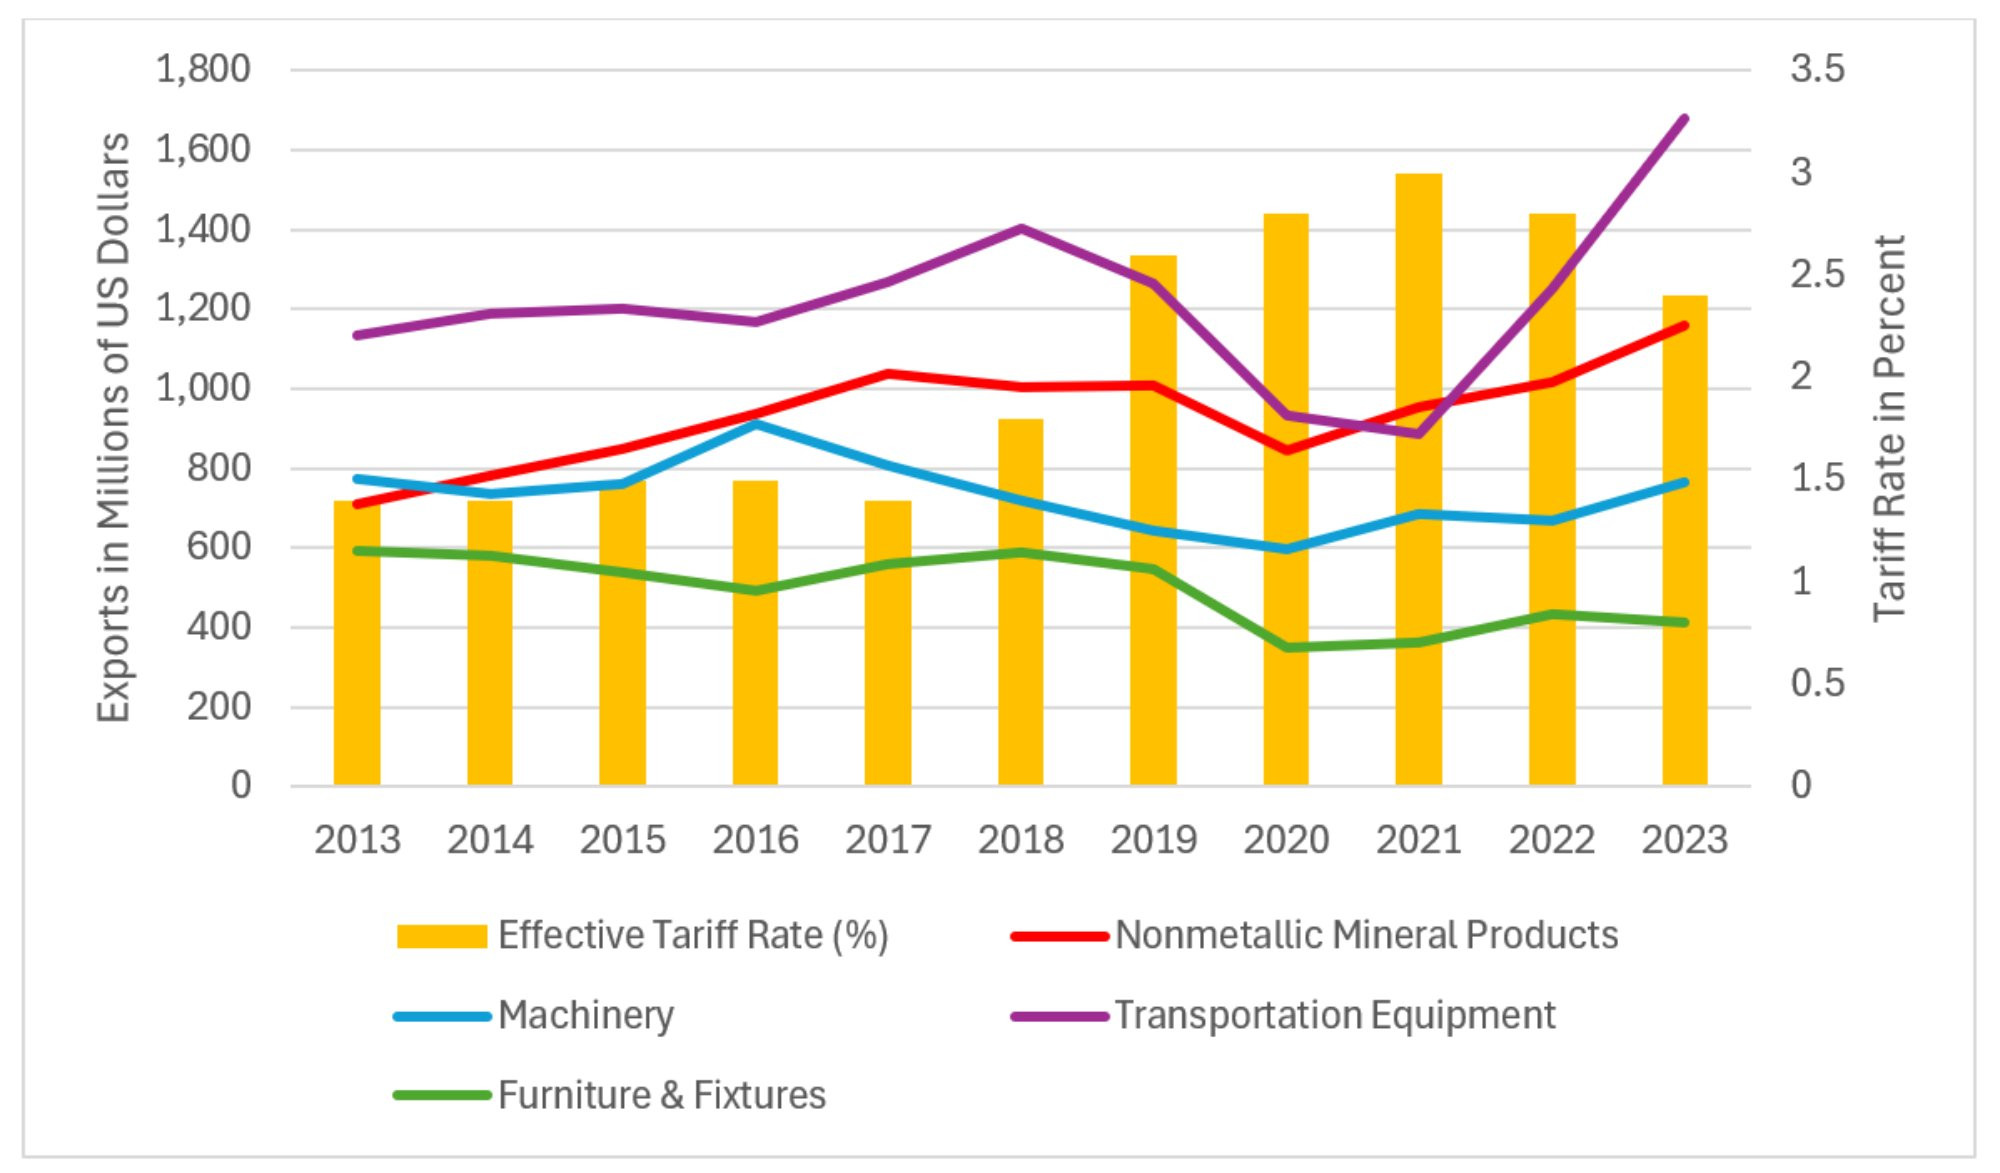
Description: The West Michigan Exports by Sector Figure 3 shows substantial decreases in exports across several categories of goods in the early years of the trade war.
Source: ITA, U.S. International Trade Commission (USITC) and authors’ calculations.
A similar pattern can be found when looking at exports by partner. Data on exports from MSAs to individual countries are not made available by the ITA, but the agency does provide aggregate MSA exports to different parts of the world– including Asia, the EU, and the United States-Mexico-Canada Agreement (USMCA; i.e. exports to Canada and Mexico). As can be seen in Figure 4, exports to all of these groups slowed and then declined in the first two years of the trade war when U.S. tariffs increased and other countries retaliated before rebounding starting in 2021 when tariffs fell and the COVID-19 pandemic eased. In 2019, West Michigan’s exports fell by approximately 9% to Asia, and 6% to USMCA, with a modest 2% increase to the E.U. Exports to USMCA were heavily hit with a loss of approximately $197 million in 2019 alone.
Figure 4. West Michigan Exports by Partner
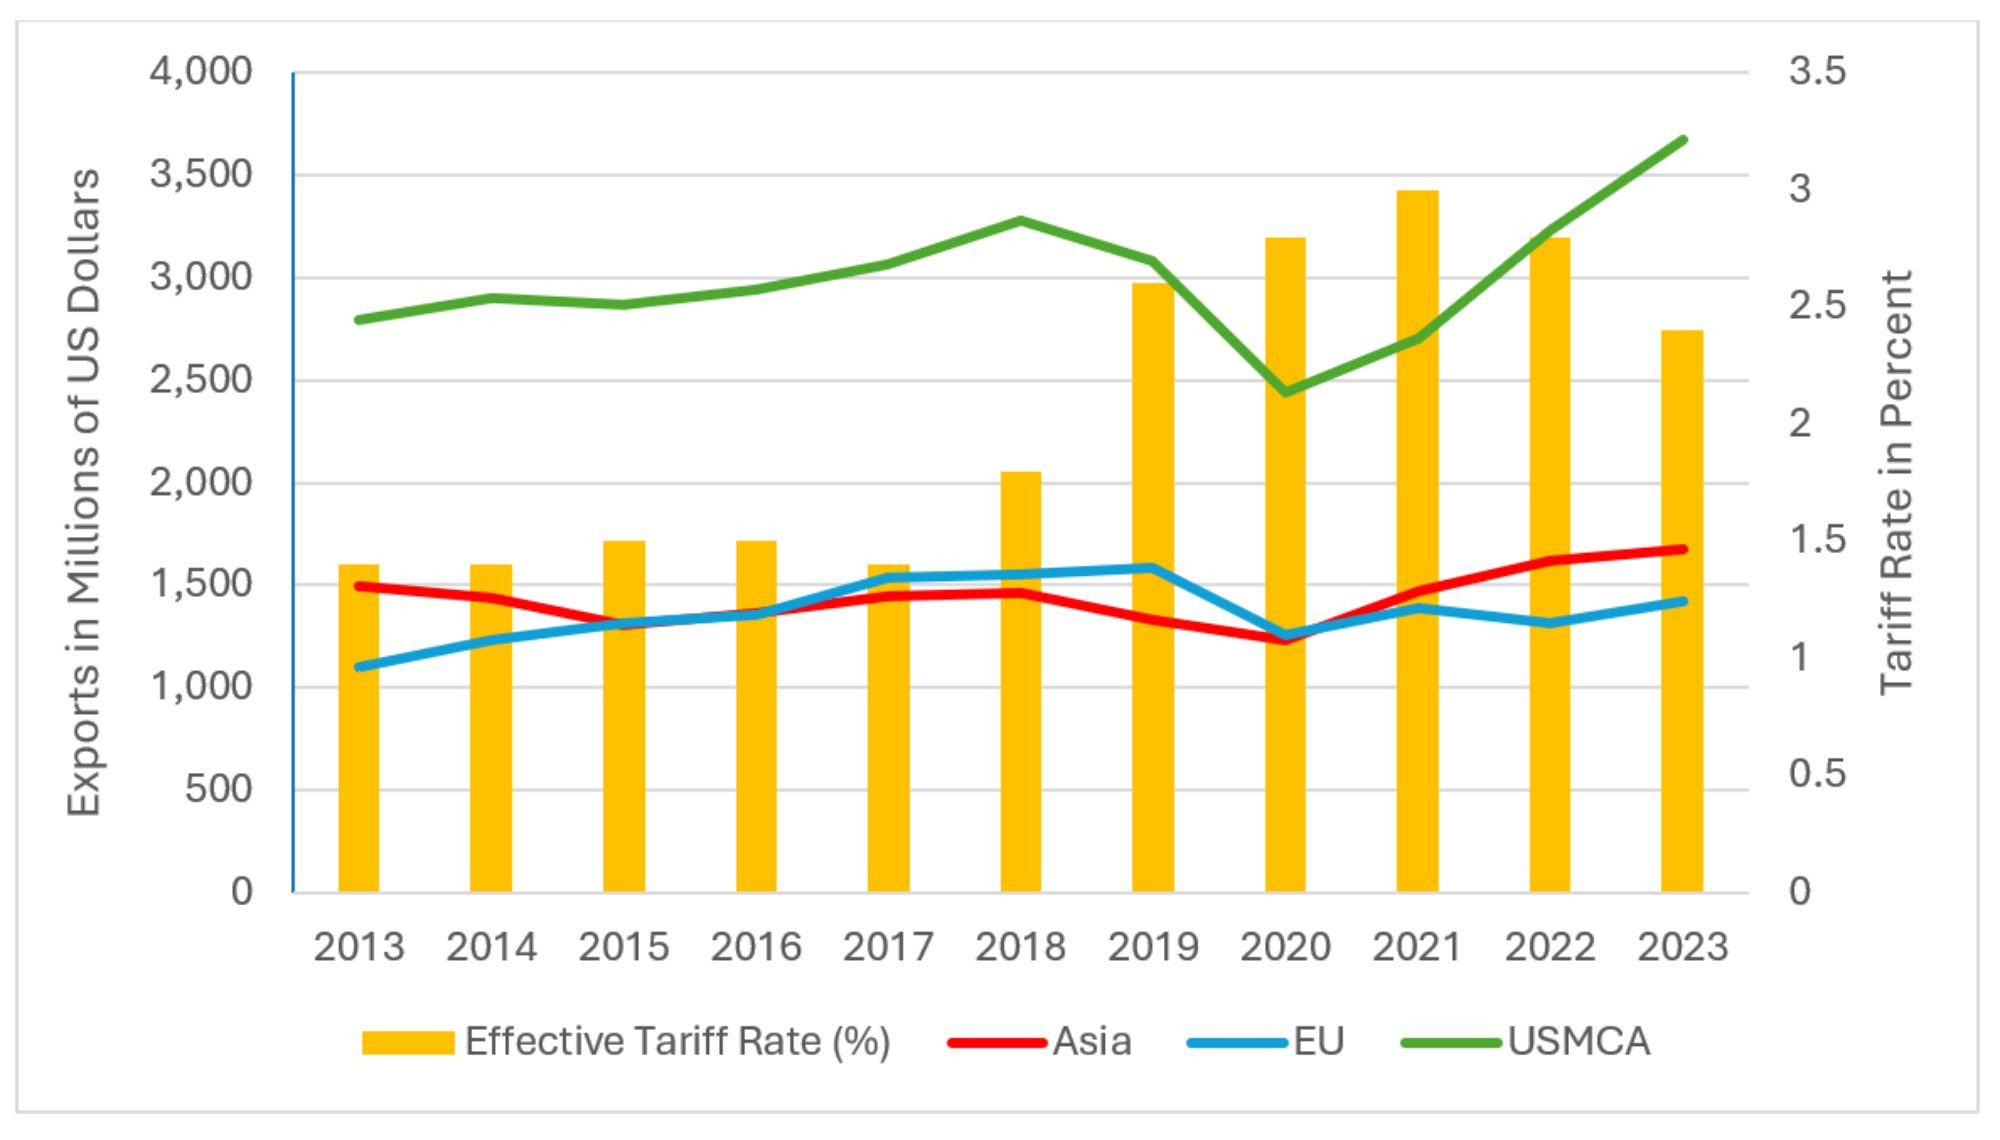
Description: The West Michigan Exports by Partner graph shows declines in exports to Asia, the E.U., and the USMCA in the early years of the trade war.
Source: ITA, U.S. International Trade Commission (USITC) and authors’ calculations.
Table 1 shows the correlations of international trade with the effective tariff rates for 2018-2023. At the aggregate level, all measures are negatively correlated with tariffs, indicating that international trade decreased as tariff levels increased. Muskegon experienced the strongest negative correlation with tariffs, indicating a higher impact on its exports from the trade war than for Grand Rapids and Michigan as a whole. Most correlations are negative by sector in West Michigan also. Transportation Equipment and Furniture & Fixtures exhibit strongly negative correlations, indicating that those sectors were highly sensitive to changes in trade policy. West Michigan exports by partner also have negative correlations, with exports to the E.U. strongly negatively correlated, suggesting that trade with the E.U. could take the largest toll in a heightened tariff environment for West Michigan. Of course, correlation does not mean causation and the timing of the COVID-19 pandemic complicates the analysis. However, these results are indicative of economic sensitivity to trade policy changes.
Table 1. Correlations of West Michigan Exports with Tariffs 2018-2023
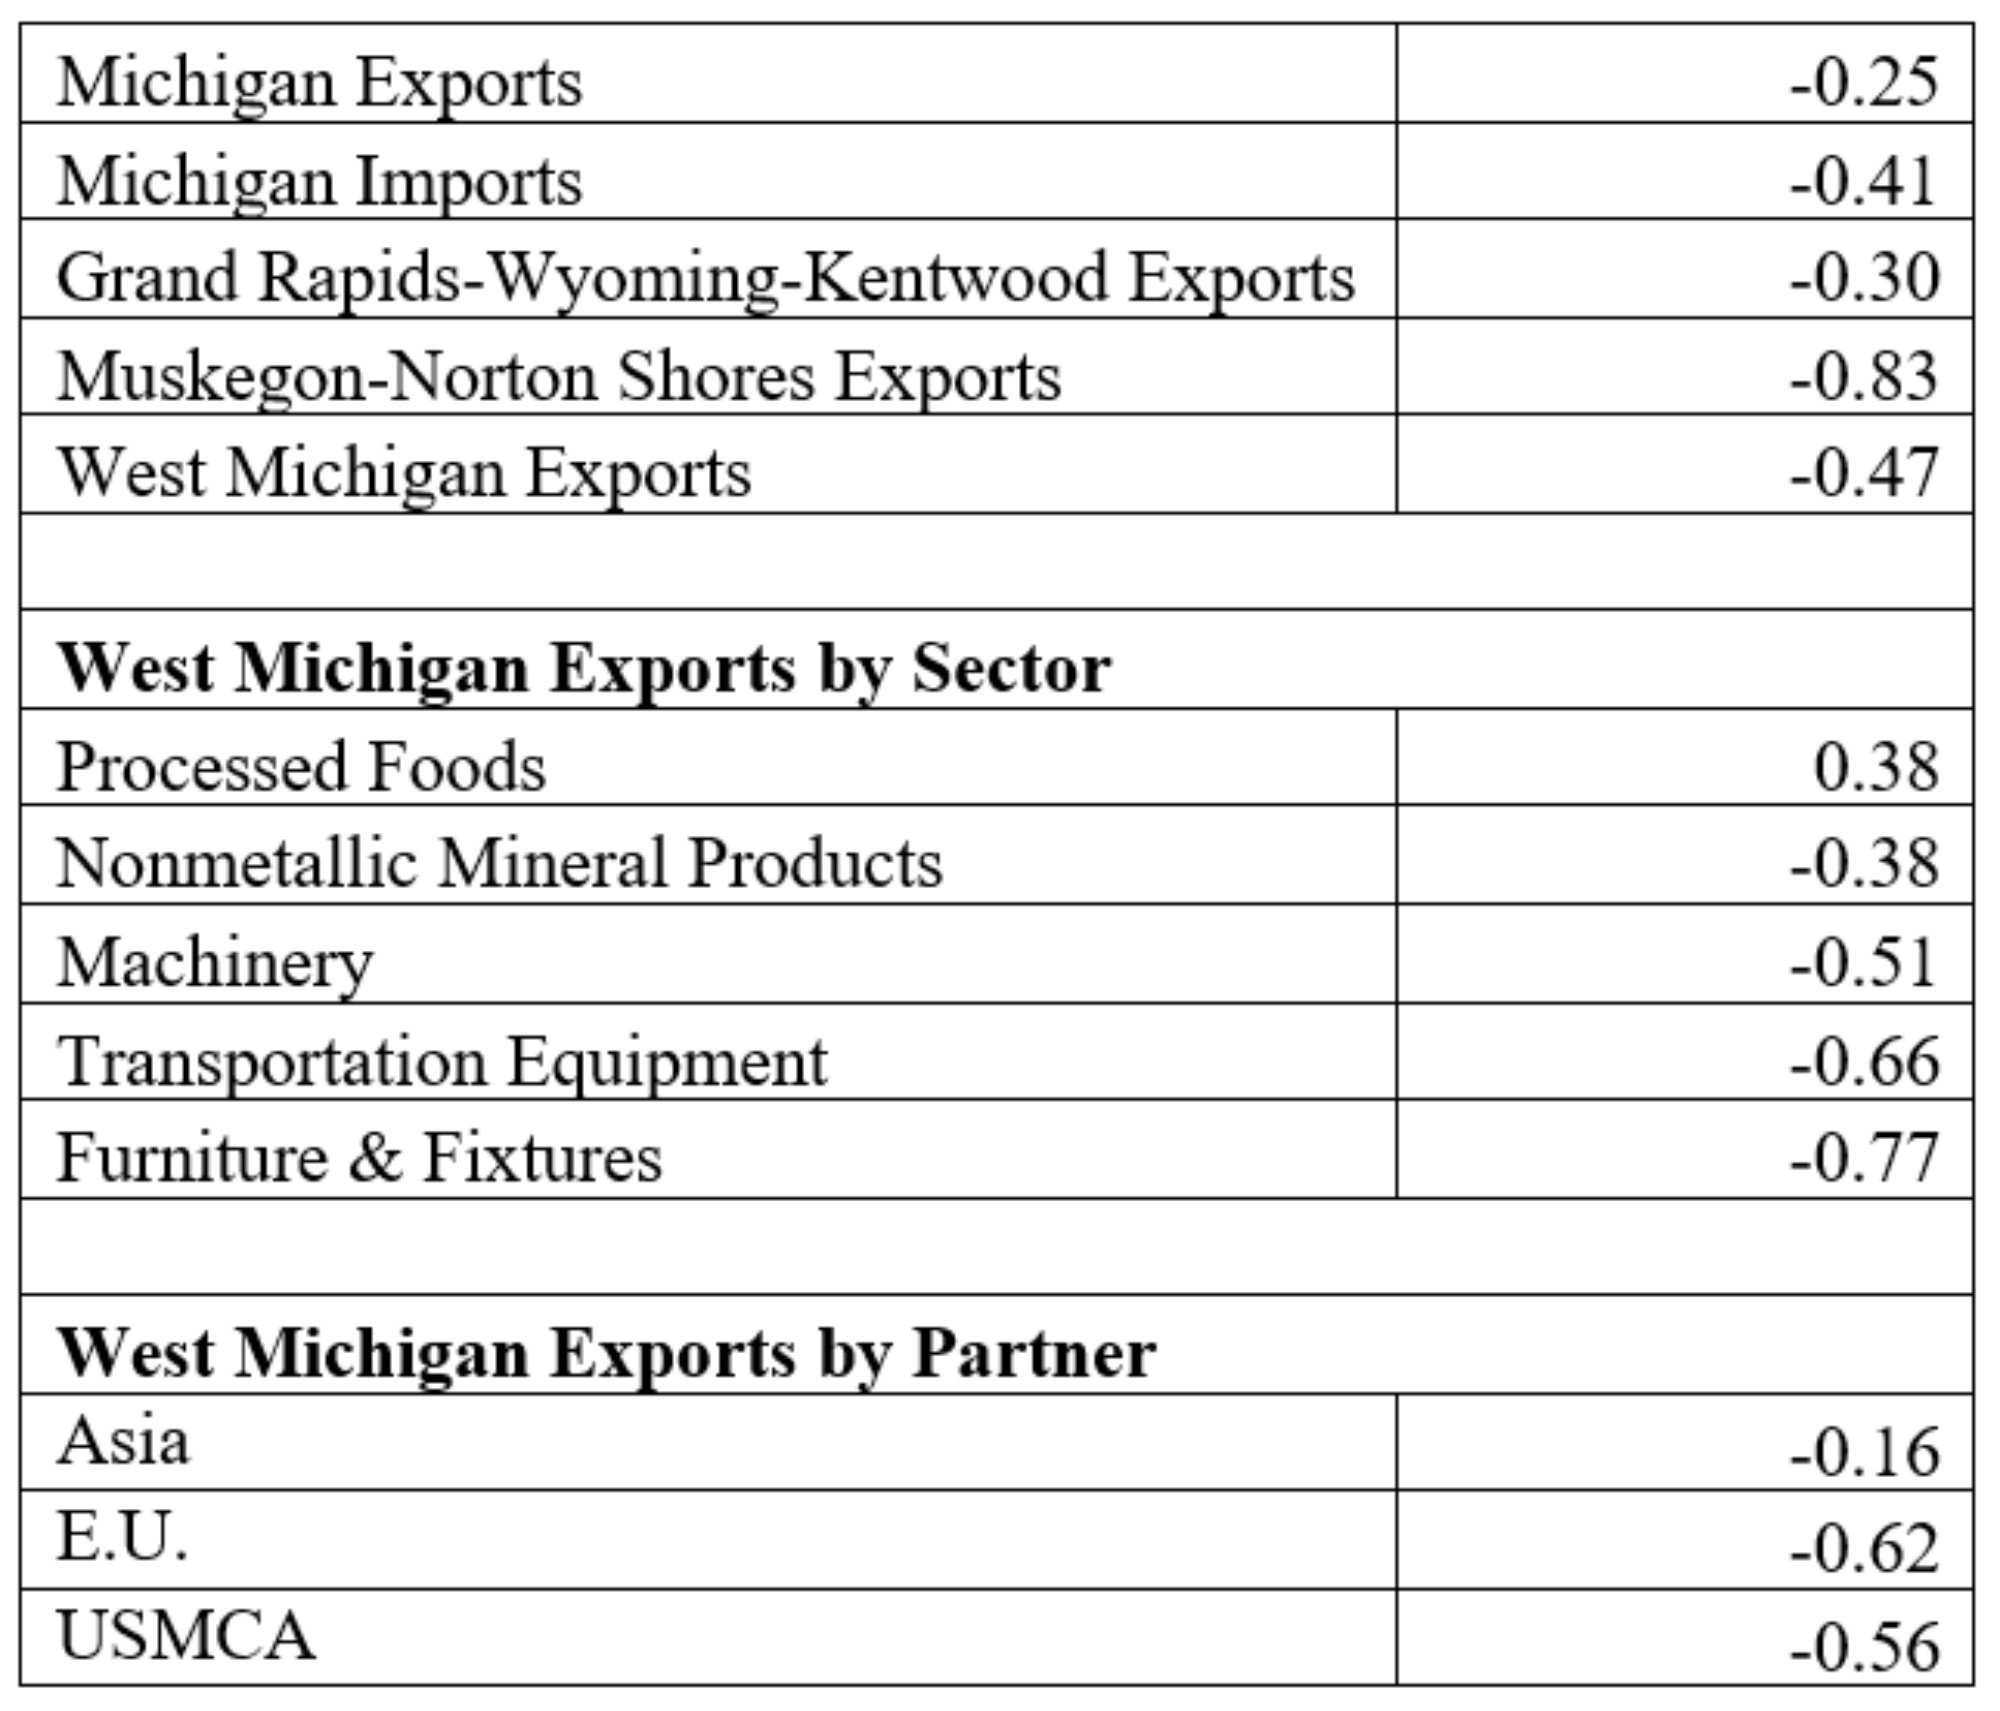
Description: The Correlations of West Michigan Exports with Tariffs Table 1 shows negative correlations for almost all regions, products, and partners.
Source: ITA, U.S. International Trade Commission (USITC) and authors’ calculations.
The negative effects of the tariffs can also be seen through changes in nightlight brightness across West Michigan, as shown in Figures 5 and 6. Nightlight brightness images, captured by satellites, have become widely used by economists as indicators of local economic activity as brighter areas typically reflect more industrial output.
Figure 5. Nightlights of Kent, Ottawa, and Muskegon Counties, 2018-2019
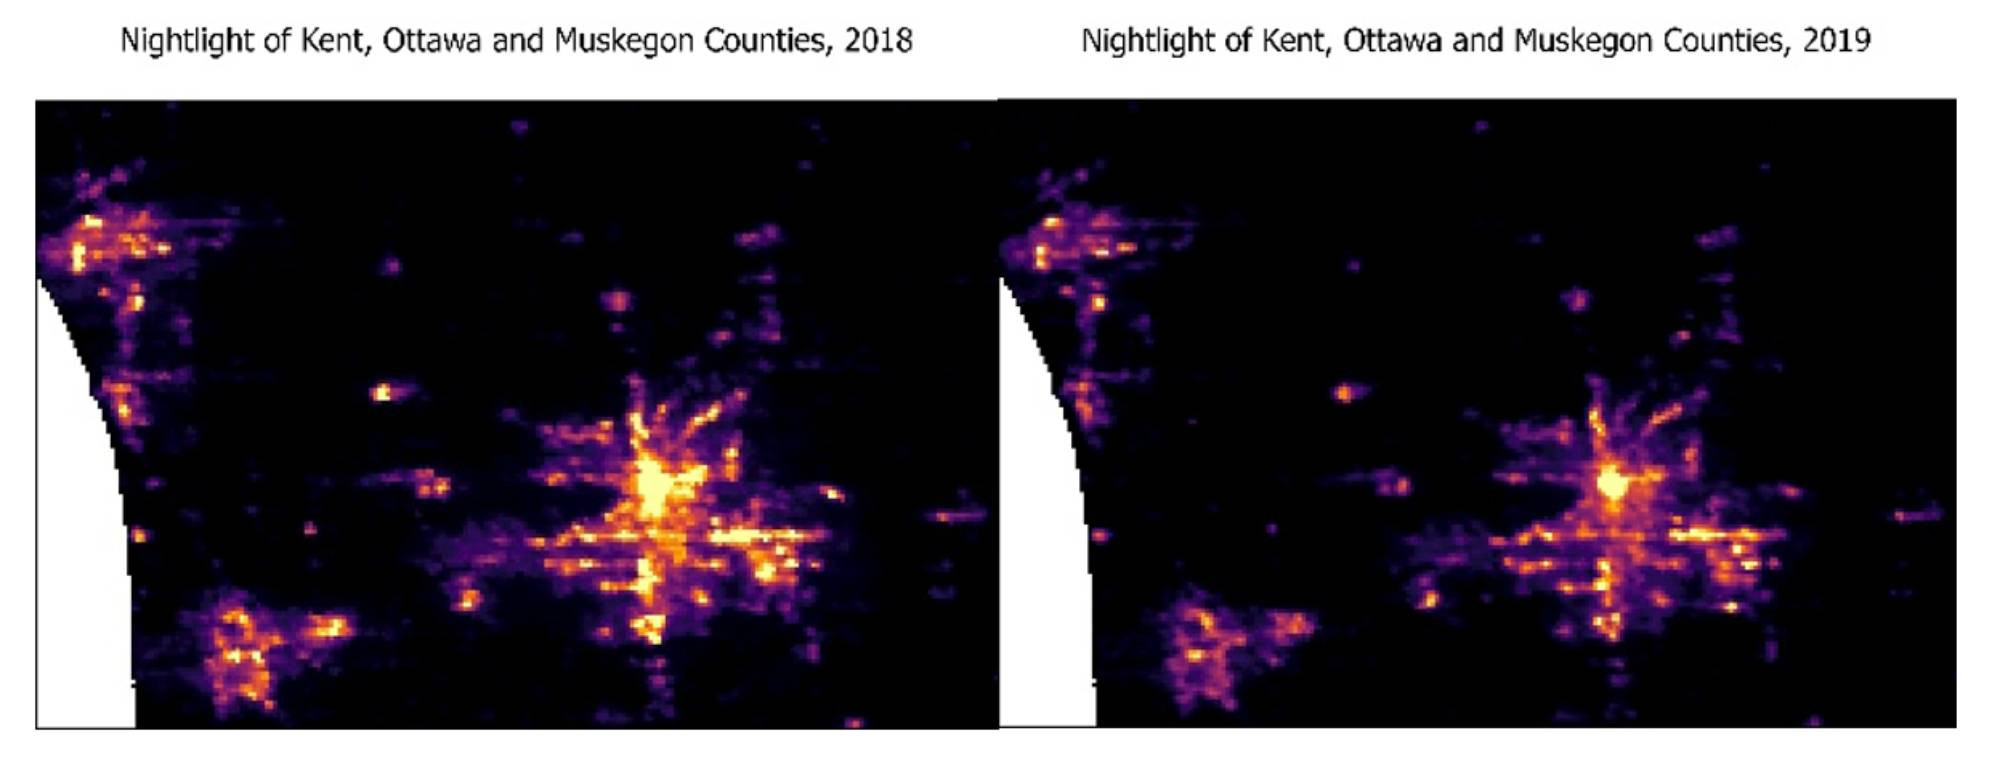
Description: The Nightlights of Kent, Ottawa, and Muskegon Counties Figure 5 shows a significant decrease in nightlight from 2018 to 2019.
Source: Earth Observations Group (EOG), the Visible Infrared Imaging Radiometer Suite (VIIRS).
Figure 6. Nightlight Brightness Index in West Michigan, 2016-2019
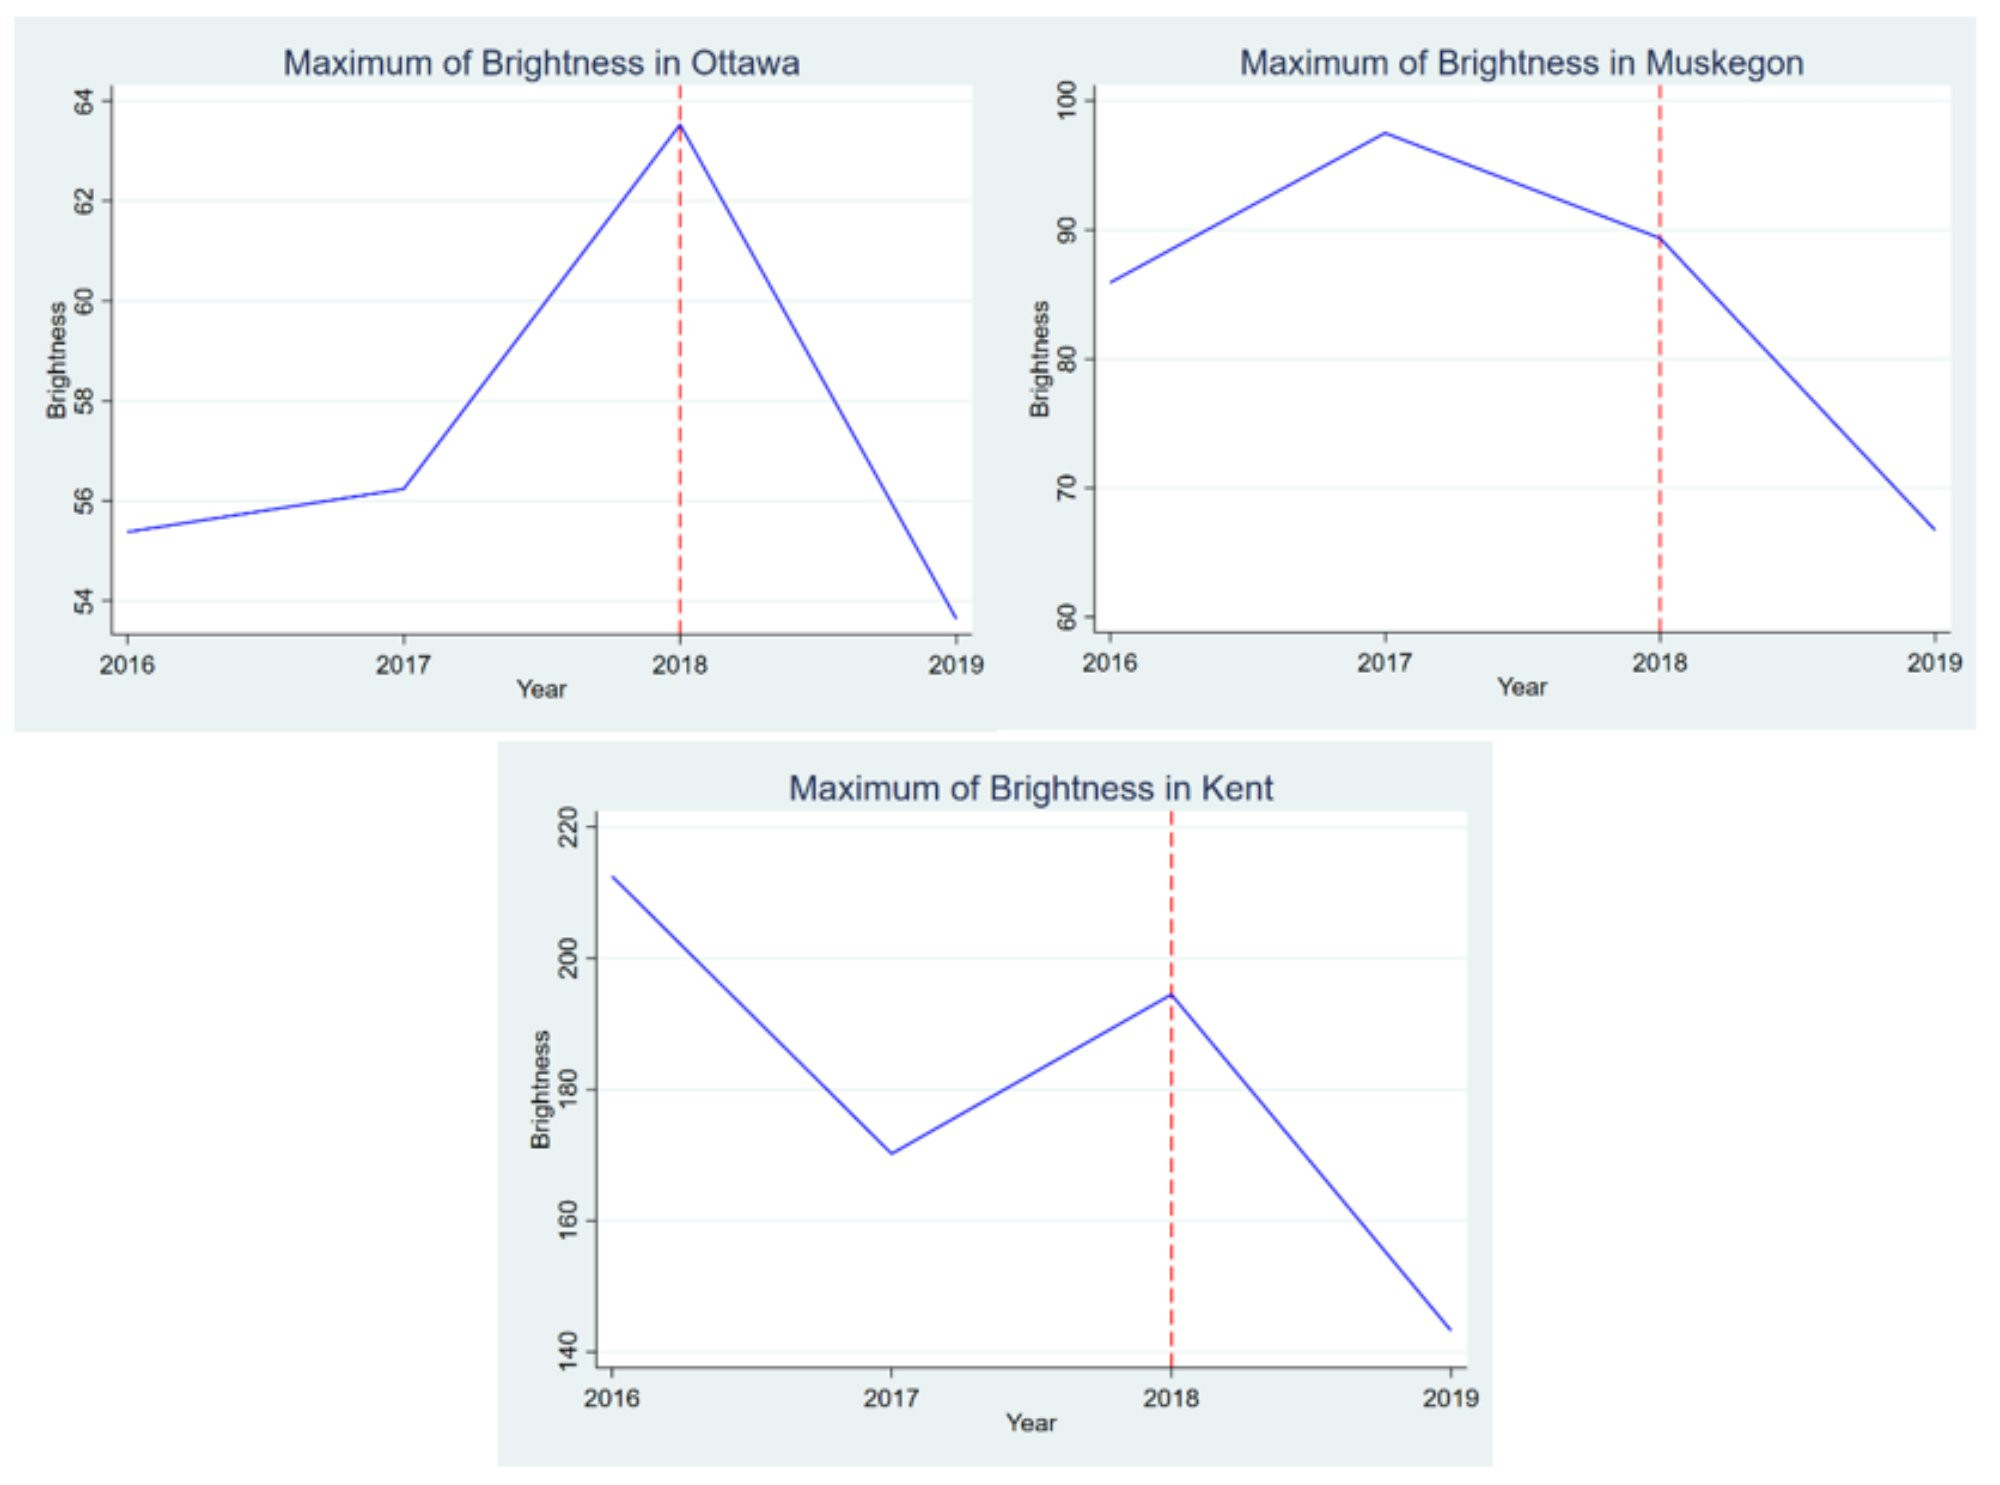
Description: The Nightlight Brightness Index in West Michigan Figure 6 shows substantial reductions in luminosity across Kent, Ottawa, and Muskegon counties following the start of the trade war.
Source: EOG, VIIRS, and authors’ calculations.
Figure 5 shows that, between 2018 and 2019, nightlight intensity visibly declined across West Michigan’s three major counties—Kent, Ottawa, and Muskegon. While city centers, such as downtown Grand Rapids, remained relatively bright, many suburban and rural areas experienced a significant reduction in brightness. This dimming indicates a noticeable slowdown in economic activity outside the urban core, with previously active regions becoming much less illuminated by 2019. The contrast between bright urban areas and dimmer rural regions highlights the uneven impact of tariffs on economic activity in West Michigan.
Data from these images can be used to create a Nightlight Brightness Index. Figure 6 shows that the maximum brightness index in each of these counties dropped significantly after 2018. This reduction in luminosity suggests that the region’s economic activity slowed during this period, consistent with the broader economic impact of the tariffs.
The information presented here highlights the exposure that West Michigan has to trade disputes. The escalation of the trade war in 2025, with substantially higher tariff levels, is likely to have an even more significant negative impact on the regional economy than during the first Trump administration. The region’s auto and furniture industries are likely to be significantly adversely affected by a continued trade war, particularly when it comes to trade with the E.U., Canada and Mexico.