Grand Rapids Housing Market: 2025 In Review
By Laudo M. Ogura, Ph.D., Associate Professor, Department of Economics
Paul Isely, Ph.D., Associate Dean, Seidman College of Business and Professor, Department of Economics
In 2025, average home prices, sales, and construction did not change much in the nation when compared to the previous year, but mortgage rates declined during the year, reaching 6.2% in December. As a result, sales started to trend up in September, suggesting that we may see greater market activity in 2026. See Table 1 for details on housing related data for 2025.
Table 1: Economic and Housing Market Conditions
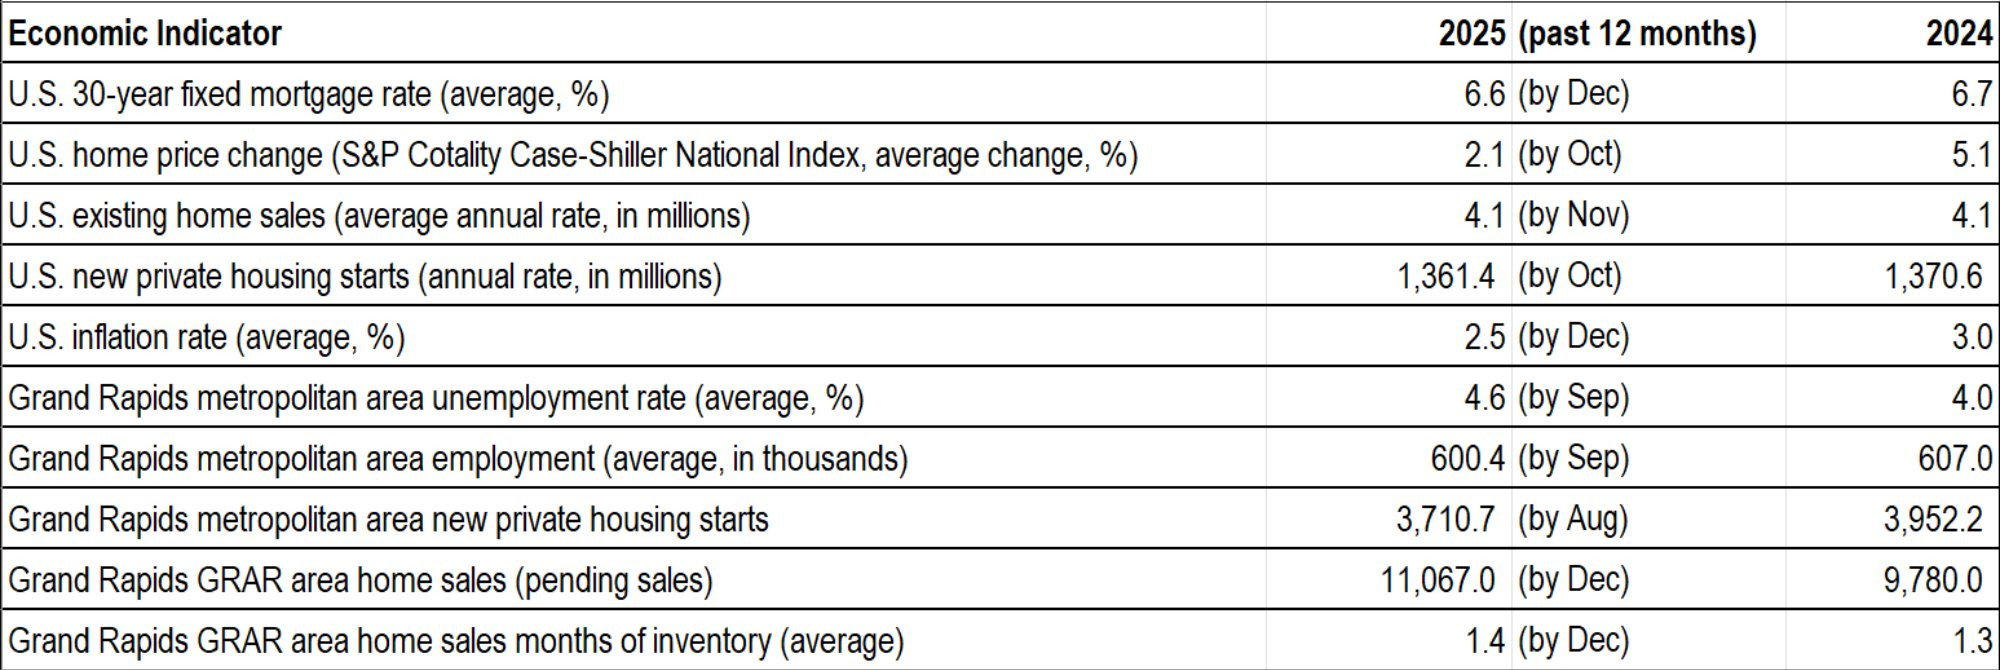
Note: The Grand Rapids metropolitan area includes Kent, Ottawa, Barry, and Montcalm counties. The Greater Regional Alliance of Realtors (GRAR) data referred to above includes Kent County, Ionia County, and parts of Ottawa, Barry, and Allegan counties. For 2025, data availability was limited to the months noted in the table.
Description: The Economic and Housing Market Conditions table shows that, at the national level, housing prices did not increase much in 2025, with sales and construction stable. At the regional level, home sales increased, while construction had a slight decrease.
Source: Greater Regional Alliance of Realtors (2026) and Federal Reserve Bank of St. Louis (2026).
For the Grand Rapids region, our price index estimates are presented in Figure 1. The indexes are arbitrarily set to equal 100 in 2006, when home prices in the region peaked before the crash. The estimates are based on the repeat-sales method and include only typical non-distressed home sales. The advantage of this method is that it compares the prices of the same houses as they are resold over time, thus holding the quality of houses relatively constant. (See Technical Notes at the end of the article for details about the method and data used.) According to our indexes, home prices in both the City of Grand Rapids area and in the suburban municipalities of City of East Grand Rapids and Grand Rapids Charter Township rose by 6% in 2025, following a 7% increase in the previous year.
Figure 1: Housing Price Indexes (HPI) for the Grand Rapids Area
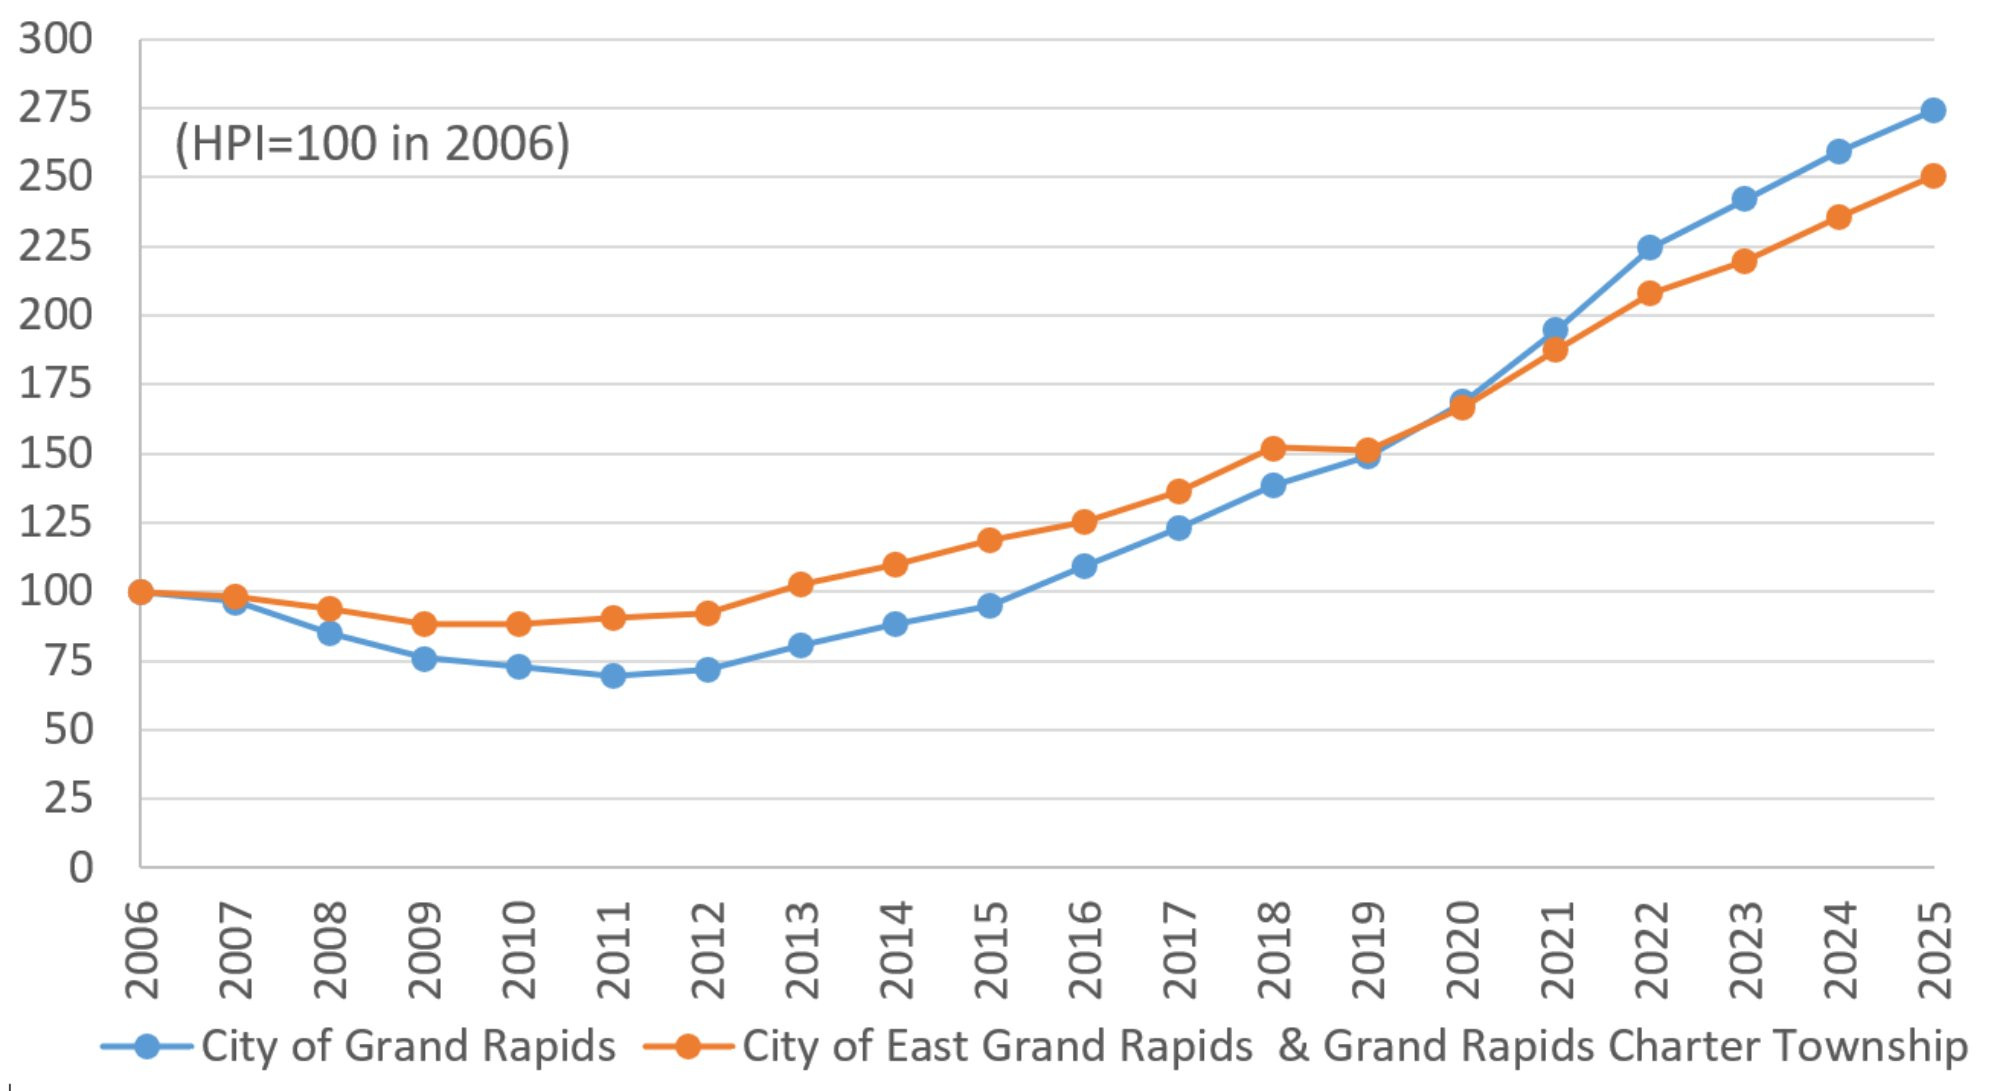
Note: See Technical Notes at the end of the article for details on methodology.
Description: The Housing Price Indexes graph shows that home prices were increasing in the City of Grand Rapids and the suburban municipalities of City of East Grand Rapids and Grand Rapids Charter Township during 2025, continuing a trend that started in 2012.
Source: BS&A Software (2026).
The rising price trends in the region reflect the strong demand in recent years due to employment growth together with a constrained supply of homes for sale. In 2025, despite a slowdown in the labor market, home prices still trended upwards as the inventory of homes for sale remained at a low 1.4-month supply (see Table 1).
Local construction activity has stayed relatively stable in recent years, in contrast to the declining trend at the national level (see Figure 2). Construction volume is not high enough to offset the sluggishness in the home sales market, where current homeowners avoid trading homes due to high interest rates in new mortgages. With the decrease in mortgage rates during the year, local home sales started to rebound posting 13% growth in 2025 in the main area of activity of the Greater Regional Alliance of Realtors (2026). Even with this growth, sales are still 15% lower than 2019-2020 levels.
Figure 2: New Housing Units Building Permits in the Grand Rapids Metro Area vs. Nation
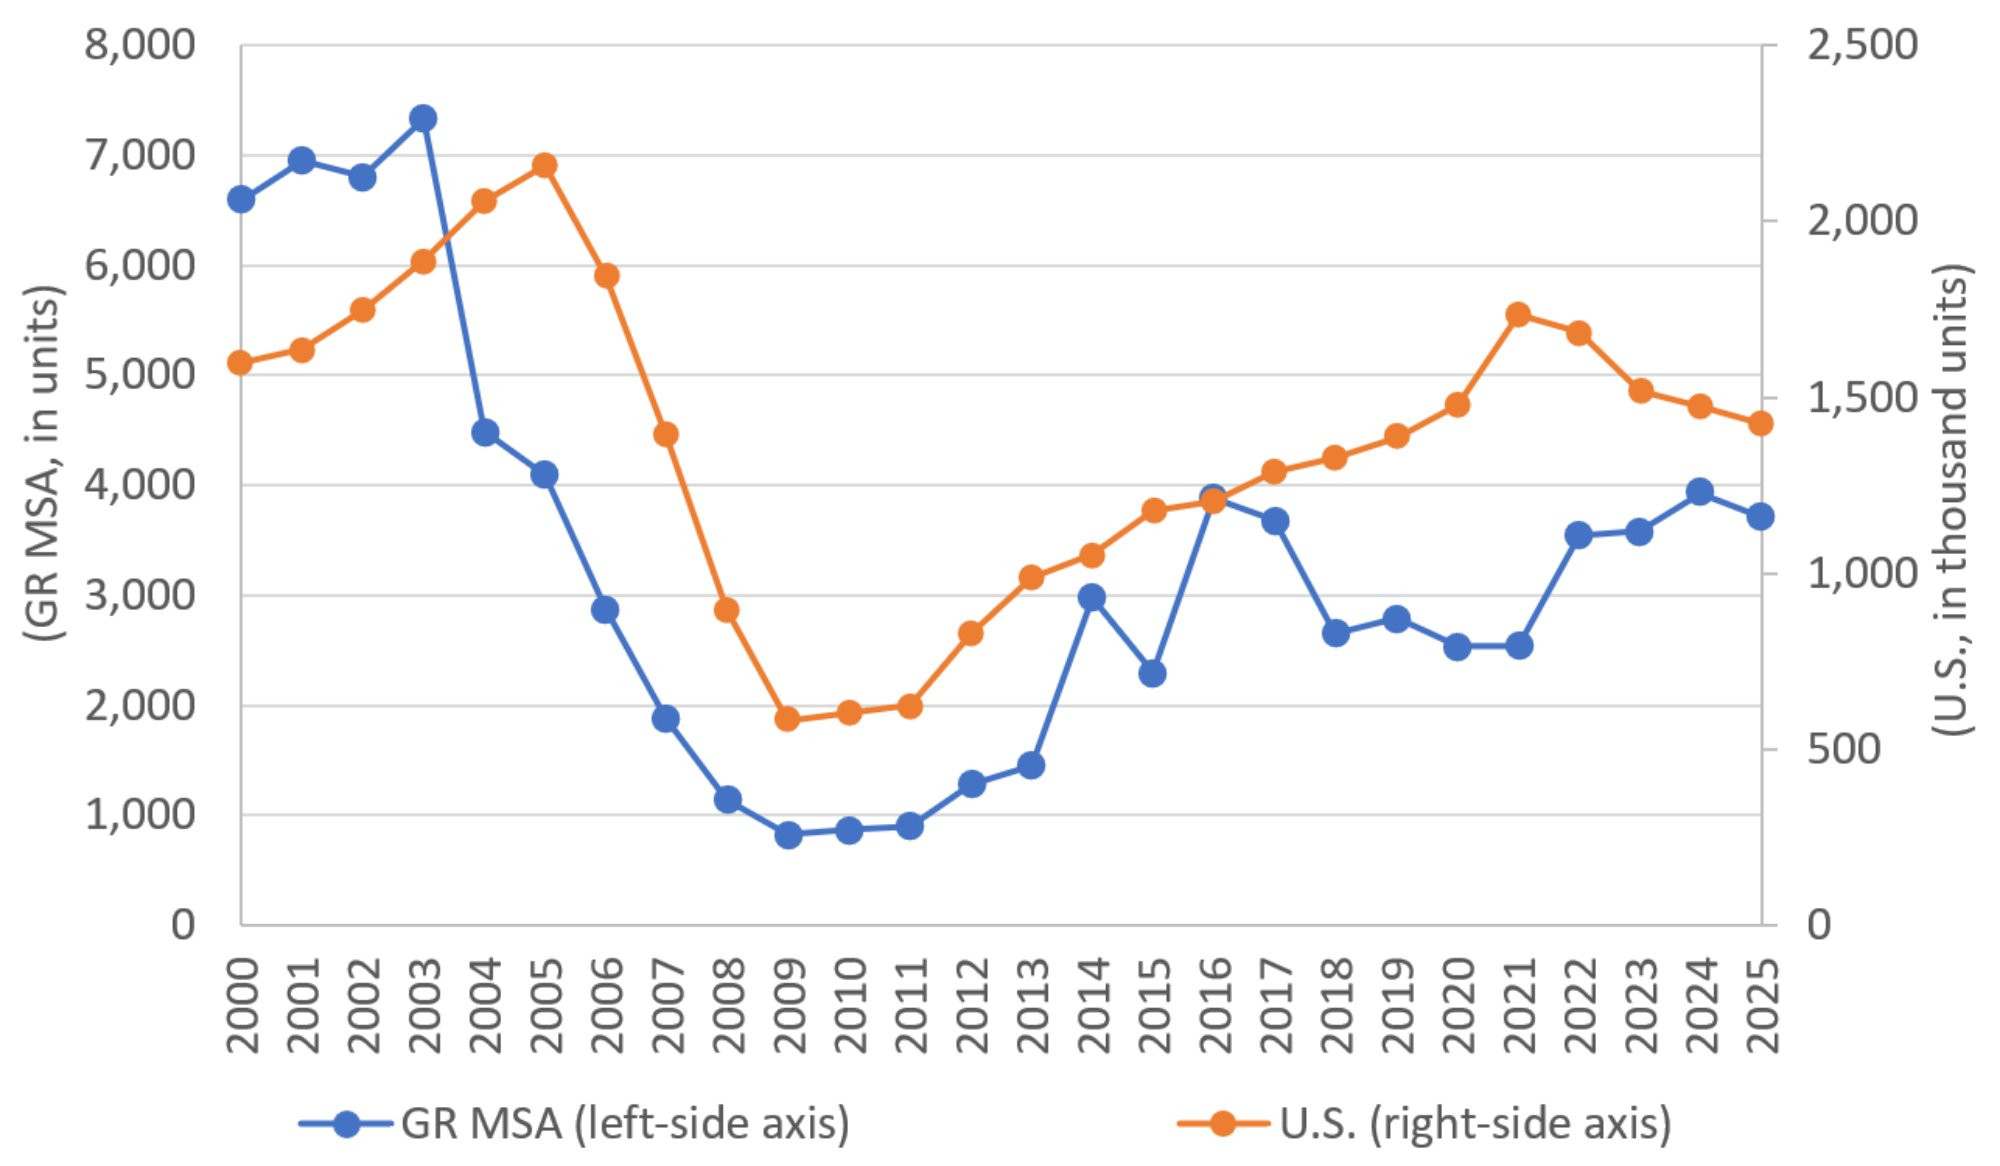
Note: The Grand Rapids metropolitan statistical area (GR MSA) includes Kent, Ottawa, Barry, and Montcalm counties. 2025 values are based on available data (the past 12 months until October for the U.S. and until August for the GR MSA).
Description: The New Housing Units Building Permits graph shows that construction activity has been in an upward trend since the housing foreclosure crisis in 2008-2011, but it has slowed down in the last few years nationally, while staying relatively stable in the Grand Rapids metropolitan area.
Source: Federal Reserve Bank of St. Louis (2026).
As in previous years, our repeat-sales price indexes continue to suggest a shift in demand towards less expensive housing units in response to rising buying costs. Since 2021, repeat-sales prices have risen by 40% on average in the three municipalities considered in our indexes shown in Figure 1, while median sales prices have grown by only 30% in the same area and period, suggesting a less expensive mix of homes.
Compared to the rest of the nation, it is notable that the Grand Rapids area still sees prices rising while many regions have seen declines recently. According to the Federal Housing Finance Agency (2026), home prices went down in 24 of the top 100 metropolitan areas in the U.S. in the 12-month period ending in September 2025. Areas with declining prices were mostly in California, Florida, Texas, Arizona, and Colorado, where large price increases were seen in the previous decades. In contrast, the metropolitan areas that still experienced price growth were mostly in the Northeast and Midwest, where prices or price growth rates were moderate in recent decades. For West Michigan, anecdotally this has resulted in young families moving to the area at a higher rate in search of affordable housing. For instance, the U-Haul migration trend index showed positive migration and an improvement in Michigan’s ranking across states in 2025 (U-Haul, 2026). In the long term, Kent County’s population is forecasted to increase by 13% from 2025 to 2050 despite an overall decline in the state population over the same period (Michigan Center for Data and Analytics, 2024).
Last, after years of rent growth well above inflation in the region, the supply of rental units seems to have risen enough to slow down rent increases in 2025, with a rate of 4% on average in Kent and Ottawa counties (see Figure 3, based on data from Zillow, 2026). There was growing anecdotal evidence of landlords needing to work harder to fill units with increasing gaps, where little effort was needed in previous years. With more than 1,000 multifamily homes under construction and slow population growth in the region, the pricing power of property owners is expected to remain constrained in 2026.
Figure 3: Smoothed Year-Over-Year Rent Change for the Middle of the Market
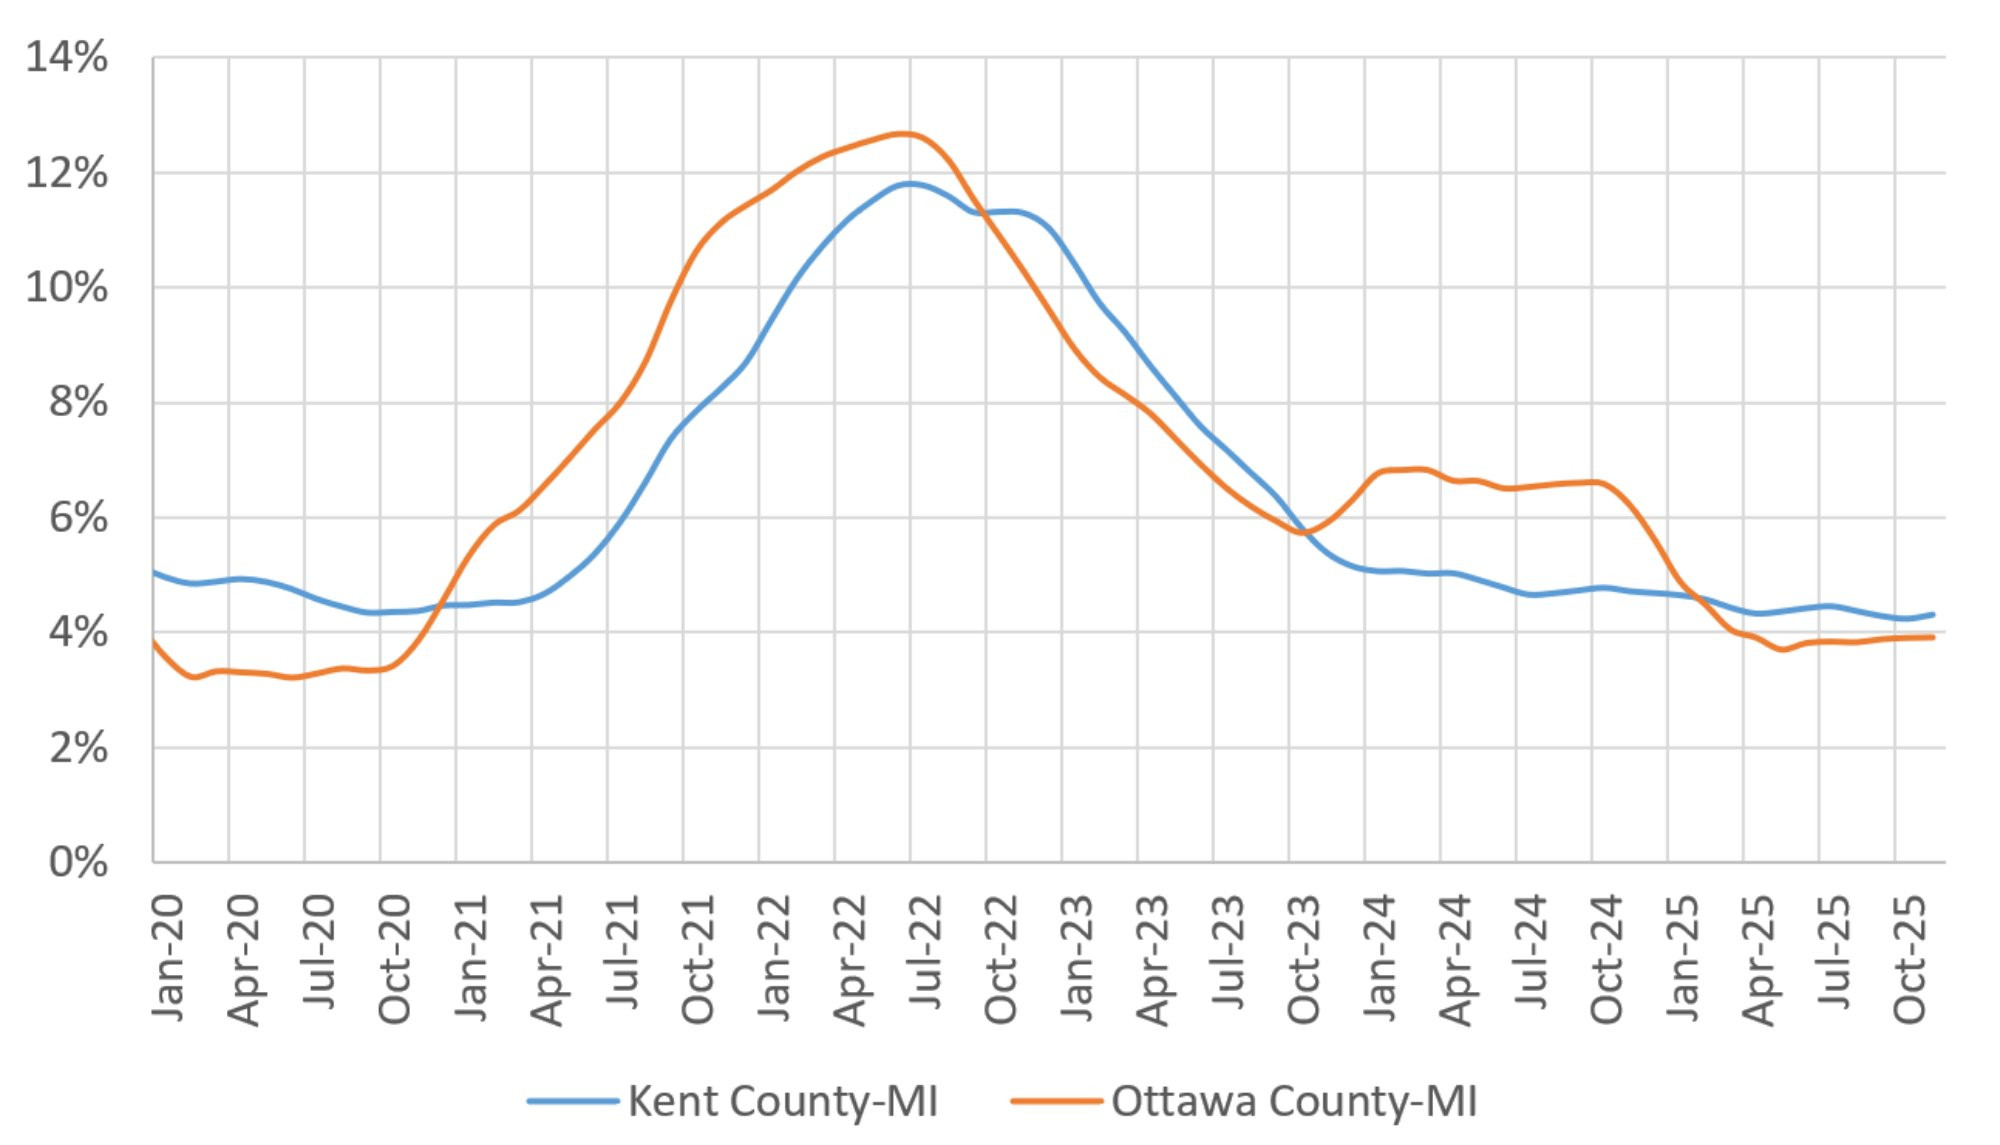
Note: Monthly periodicity. Middle of the market is defined as rental units in the 35th to 65th percentile range of rent distribution. The changes were smoothed out based on the average rent index in the past 12 months compared to the same period in the previous year. The last month of data available was November 2025.
Description: The graph shows that rent growth rate decreased to 4% in Kent and Ottawa counties in 2025.
Source: Zillow (2026).
Conclusion
In 2025, home prices in the region kept rising due to strong demand and limited supply of homes for sale. As mortgage rates decreased over the year, home sales started to rebound, but they are still low compared to 2019-2020 levels.
With rising home prices, households have looked for less expensive housing options, but rent growth seems to have slowed down in 2025 as the supply of rental units has expanded.
For 2026, employment growth is expected to stay low for at least the first half of the year, leading to slightly lower mortgage rates reflecting a softening economy. As a result, rising home sales should keep prices growing at moderate rates.
Technical Notes
The housing price indexes shown in Figure 1 are estimated using the repeat-sales method, which compares the prices of the same houses as they are resold over time. The method controls for variation in the quality of the different houses sold in each period, excluding houses that were not resold in the period of study. A possible flaw is that it disregards the impact of improvements or deterioration of each house and/or neighborhood. Nonetheless, the method is widely used to measure average price changes in a broad housing market.
Figure 1 compares the housing price indexes for the areas of the City of Grand Rapids and its eastside suburban municipality neighbors (City of East Grand Rapids and Grand Rapids Charter Township). The data for these suburban municipalities were merged for the purpose of estimating the housing price indexes because they have a much smaller population size, so that the number of repeat sales is too small to get accurate estimates for each municipality (for instance, in 2025, our analysis included only 124 repeat sales in the City of East Grand Rapids and 150 in the Grand Rapids Charter Township – see below for how data was restricted). Merging the home sales data for these two municipalities seems justifiable as they are located next to each other and have more similar housing and demographic characteristics, with more expensive housing and higher income households than the City of Grand Rapids.
For our study, sales data from January 2000 to December 2025 were used. The indexes were set at 100 in 2006 so that they can be interpreted as the amount of money needed to buy a house for every $100 that was needed to purchase the same house in 2006. To better measure the changes in market conditions for typical homes, we exclude:
- newly built properties (age 0 or 1, based on the year built);
- parcels sold for less than $30,000 or that were never sold for at least $50,000;
- parcels sold for more than $1,200,000;
- parcels transferred from or to a government, nonprofit, or financial institution (which are typically non-market transactions); and
- parcels that had a large variation in prices (possibly due to development or redevelopment).
References
BS&A Software. (2026). Property Sale Search Data. Retrieved January 10, 2026, from https://bsaonline.com/MunicipalDirectory
Federal Housing Finance Agency. (2026). U.S. House Price Index Report - 2025 Q3. Retrieved January 11, 2026, from https://www.fhfa.gov/document/fhfa-house-price-index-report-2025q3
Federal Reserve Bank of St. Louis. (2026). FRED Economic Data [Data files: CPIAUCSL, CSUSHPISA, EXHOSLUSM495S, GRAN326BPPRIVSA, GRAN326BP1FHSA, GRAN326URN, HOUST, LAUMT262434000000005, MORTGAGE30US, PERMIT]. Retrieved January 11, 2026, from https://fred.stlouisfed.org
Greater Regional Alliance of Realtors. (2026). Market Stats [Data Files]. Retrieved January 11, 2026, from https://www.grar.com/monthly-market-update
Michigan Center for Data and Analytics. (2024). Michigan Statewide Population Projections through 2050 Report. Retrieved from https://www.michigan.gov/mcda/insights/2025/03/06/mich-county-popproj-2050
U-Haul. (2026). U-Haul Growth Index. Retrieved January 17, 2026, from https://www.uhaul.com/about/migration/
Zillow. (2026). Zillow Observed Rent Index [Data Files]. Retrieved January 11, 2026, from https://www.zillow.com/research/data