Environmental Quality, Public Health, and Economic Implications for West Michigan: An Environmental Justice Index Approach
By Christopher John Cruz, Ph.D., Assistant Professor, Department of Economics
Manuel Pulido-Velásquez, Ph.D., Affiliate Faculty of Practice, Department of Economics
Introduction
West Michigan’s economic vitality depends on more than infrastructure and industry—it hinges on the health of its workforce and the quality of its environment. Poor air and water quality, combined with socioeconomic vulnerabilities, create hidden costs for businesses: higher healthcare expenses, reduced productivity, and talent retention challenges. Data from the Centers for Disease Control and Prevention (CDC) show that several census tracts in Kent, Muskegon, Ottawa, and Kalamazoo counties have some of the worst environmental conditions in the country (Fitzgerald & Gehrke, 2025). Leveraging the Environmental Justice Index (EJI) developed by the CDC and the Agency for Toxic Substances and Disease Registry (ATSDR), and released for the years 2022 and 2024, this article demonstrates how environmental and social conditions intersect to influence regional competitiveness and outlines actionable strategies for business leaders.
The Environmental Justice Index and West Michigan
The EJI measures cumulative impacts of three factors: environmental burden, socioeconomic vulnerability, and health risks at the census tract level. Created using data from multiple government agencies[1], the EJI is the first tool to measure the cumulative impacts of environmental, social, and health factors at the census tract level. According to the CDC (2024), the environmental burden focuses on pollution and exposure; socioeconomic vulnerability considers socioeconomic and demographic variables, such as poverty, race, education, housing, etc.; while health risks pertain to components of population health conditions such as asthma, heart disease, obesity, and low birth weight. Communities scoring high on all three dimensions face a “triple burden,” making them more susceptible to economic and health shocks.
Several census tracts in Kent, Muskegon, Ottawa, and Kalamazoo counties (Figure 1) rank in the upper third nationally in cumulative EJI scores (Fitzgerald & Gehrke, 2025). This means that some areas in West Michigan have some of the worst environmental conditions if we look at all census tracts in the county. According to the Michigan EGLE Air Quality Dashboard, industrial corridors in Kent and Muskegon counties show elevated exposure to particulate matter[2] and ozone levels near highways and manufacturing zones. Similarly, with respect to water quality, some environmental and public health concerns persist due to contamination of water sources in northern Kent County.
Figure 1: Environmental Burden Component (Pollution and Exposure)
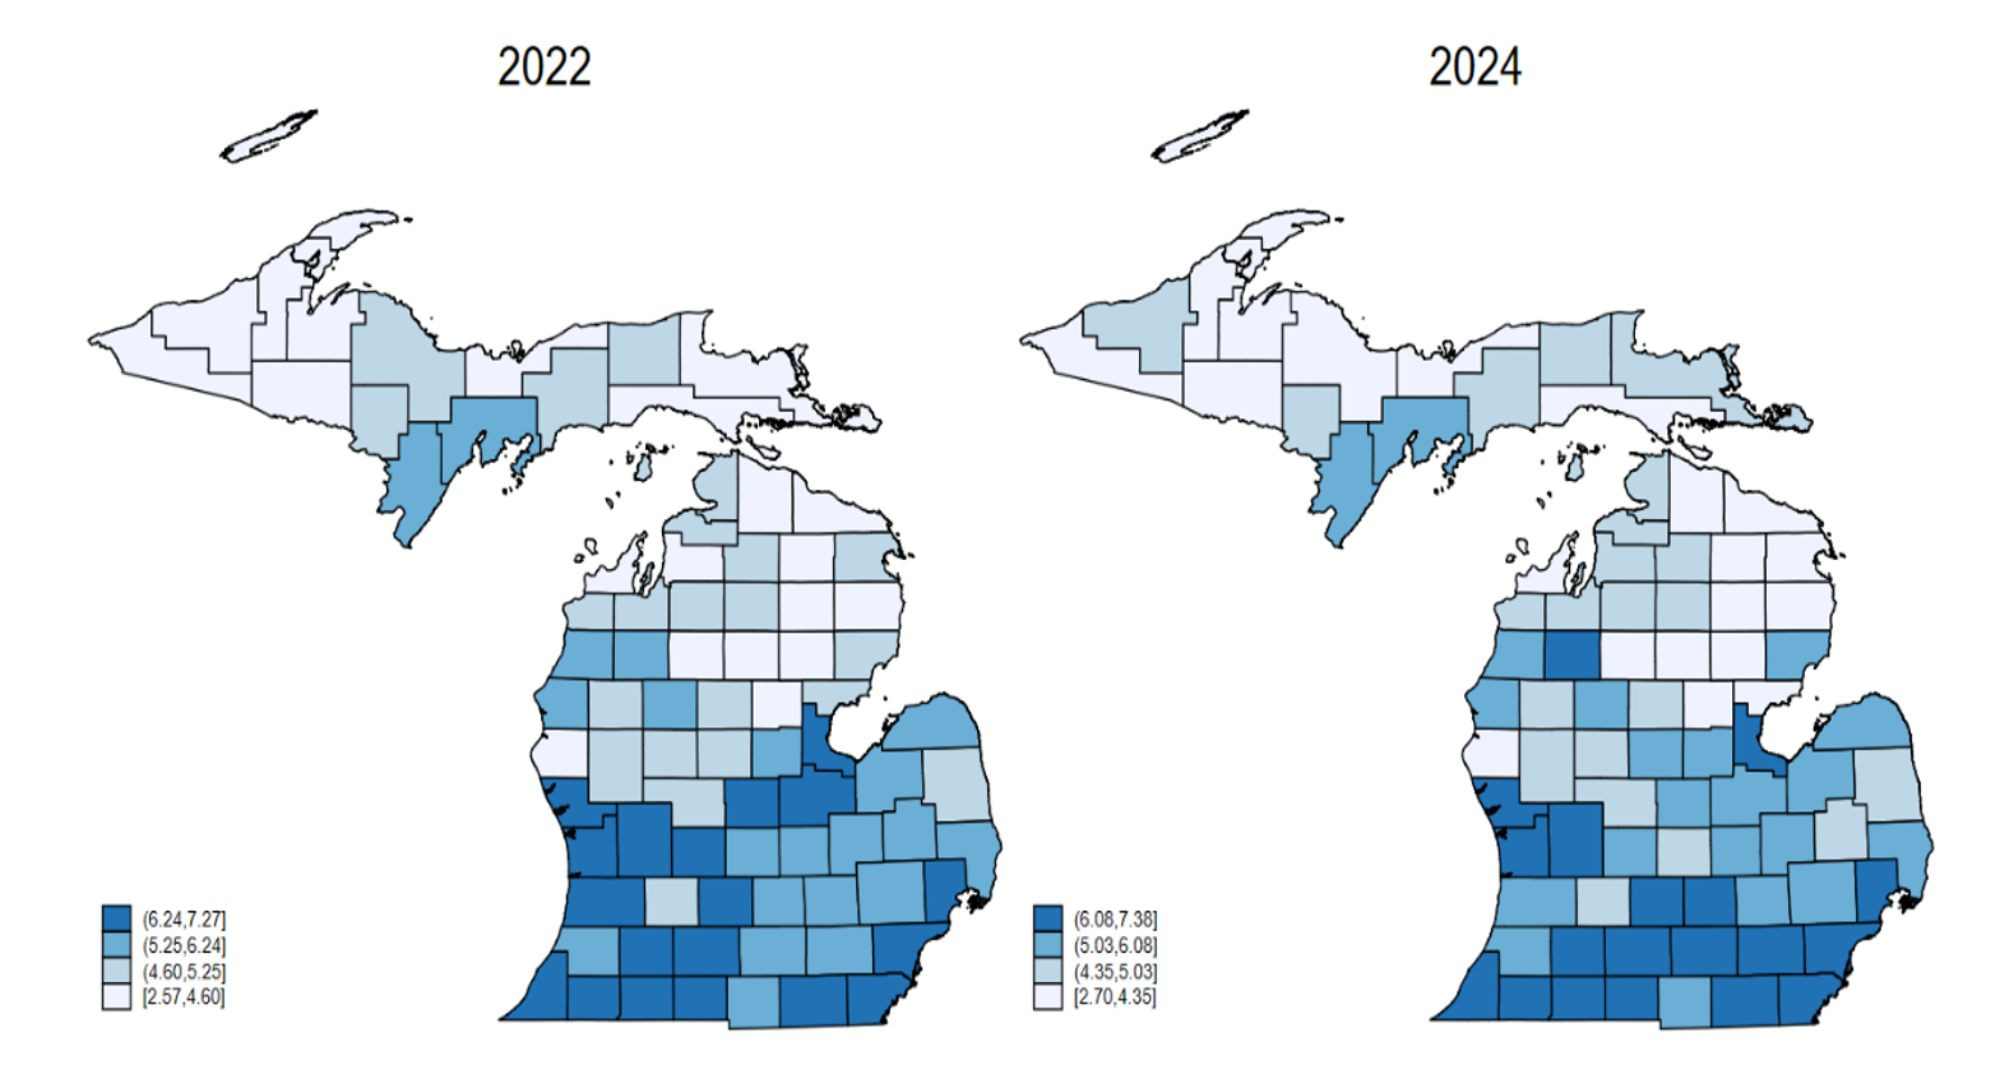
Description: The left panel shows the map of environmental burden across all counties of Michigan for 2022 while the right panel is for 2024. Darker blue shades indicate higher environmental burden or bad environmental conditions, while lighter shades indicate lower environmental burden. Counties in southeastern, southwestern, and western Michigan exhibit, on average, higher environmental burden scores.
Source: CDC/ATSDR; Authors’ Construction
The potential economic and health spillovers of environmental risks are a major concern. According to the CDC (2024), environmental burden can affect regional productivity and healthcare costs,[1] highlighting how environmental burden can have real consequences on businesses and the economy at large.
Evidence for West Michigan [4] and Michigan.
To examine correlations[5] among environmental burdens, socioeconomic vulnerability, and health outcomes in West Michigan and more broadly, across Michigan, we use data from the EJI and the University of Wisconsin’s Population Health Institute. We first focus on the EJI components that capture pollution exposure and socioeconomic vulnerability, excluding the health-outcome components. This approach allows us to isolate how location-based conditions are associated with differences in community health across West Michigan and the state.
Figure 2 shows the direction and strength of association between the EJI (with only the environmental burden and socioeconomic vulnerability components) and health outcomes[6] at the county level in West Michigan and at the state level. We find statistically significant and strong correlations between the EJI and poor health outcomes at the state and West Michigan levels. More specifically, we find that higher EJI scores align with higher premature mortality, lower life expectancy, and higher child/infant mortality in West Michigan counties. At the same time, we find that higher environmental burden and socioeconomic vulnerabilities in West Michigan are associated with increases in low birth weight, poor physical and mental health, preventable hospital stays, and insufficient sleep. Across all counties in Michigan, the direction of these associations remains consistent, but the magnitudes are smaller.
Figure 2: Association between the EJI (Environmental Burden and Social Vulnerability) and Health Outcomes in West Michigan and Michigan (statewide)
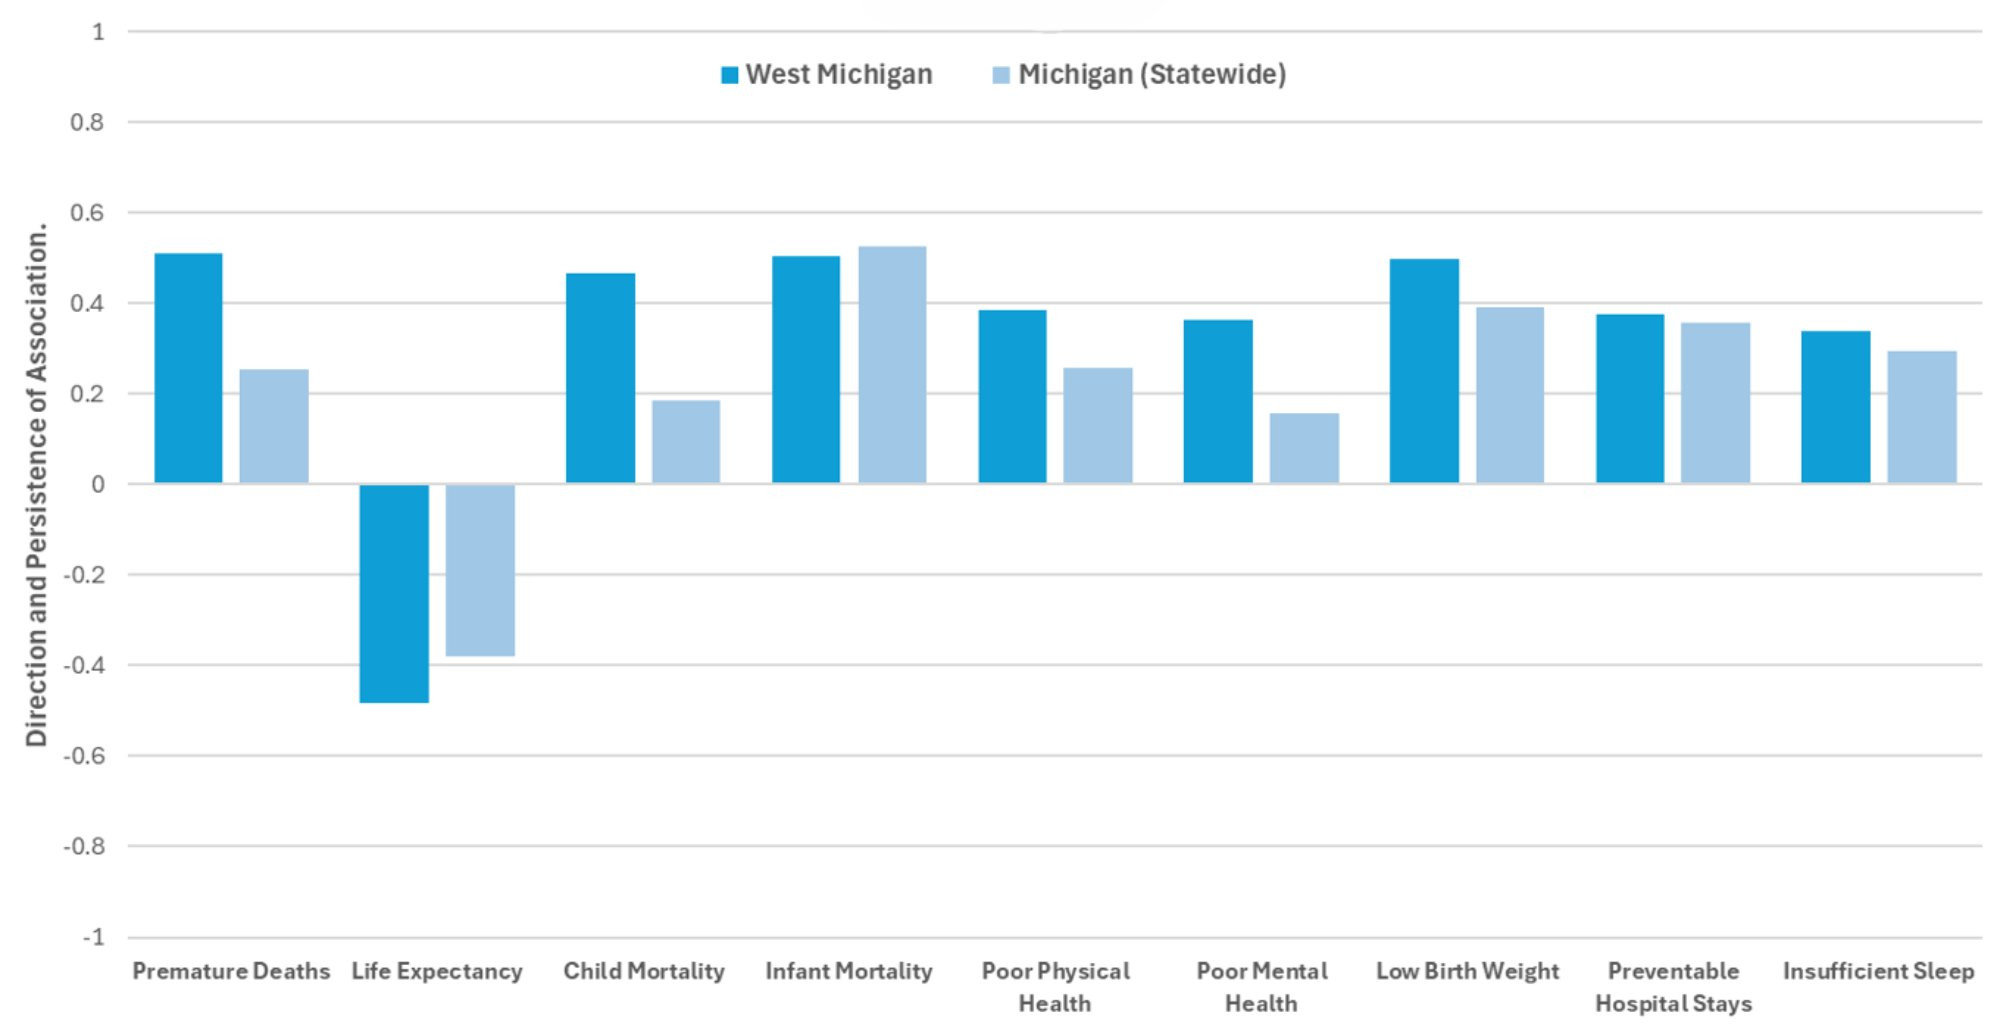
Description: Figure 2 describes the correlation between the EJI and health outcomes using combined data from both 2022 and 2024 in Michigan (statewide) and West Michigan counties. Correlation describes the relationship between variables: Positive means they move together (both up/down); Negative means they move oppositely (one up, one down); Zero means no linear relationship. The closer the correlation coefficient is to 1 (-1), the stronger the positive (negative) association between two variables. It may be noted that when the correlation coefficient is not significantly different from zero, then it can be concluded that the two variables don’t have any linear relationship. In both West Michigan counties and all Michigan counties, we observe positive correlations between the EJI and premature deaths, child and infant mortality, poor physical and mental health, low birth weight, preventable hospitalizations, and Insufficient sleep. Similarly, we find a negative correlation between the EJI and life expectancy. These correlations are stronger for counties in West Michigan relative to all counties in Michigan.
Source: CDC/ATSDR; Author’s Calculations
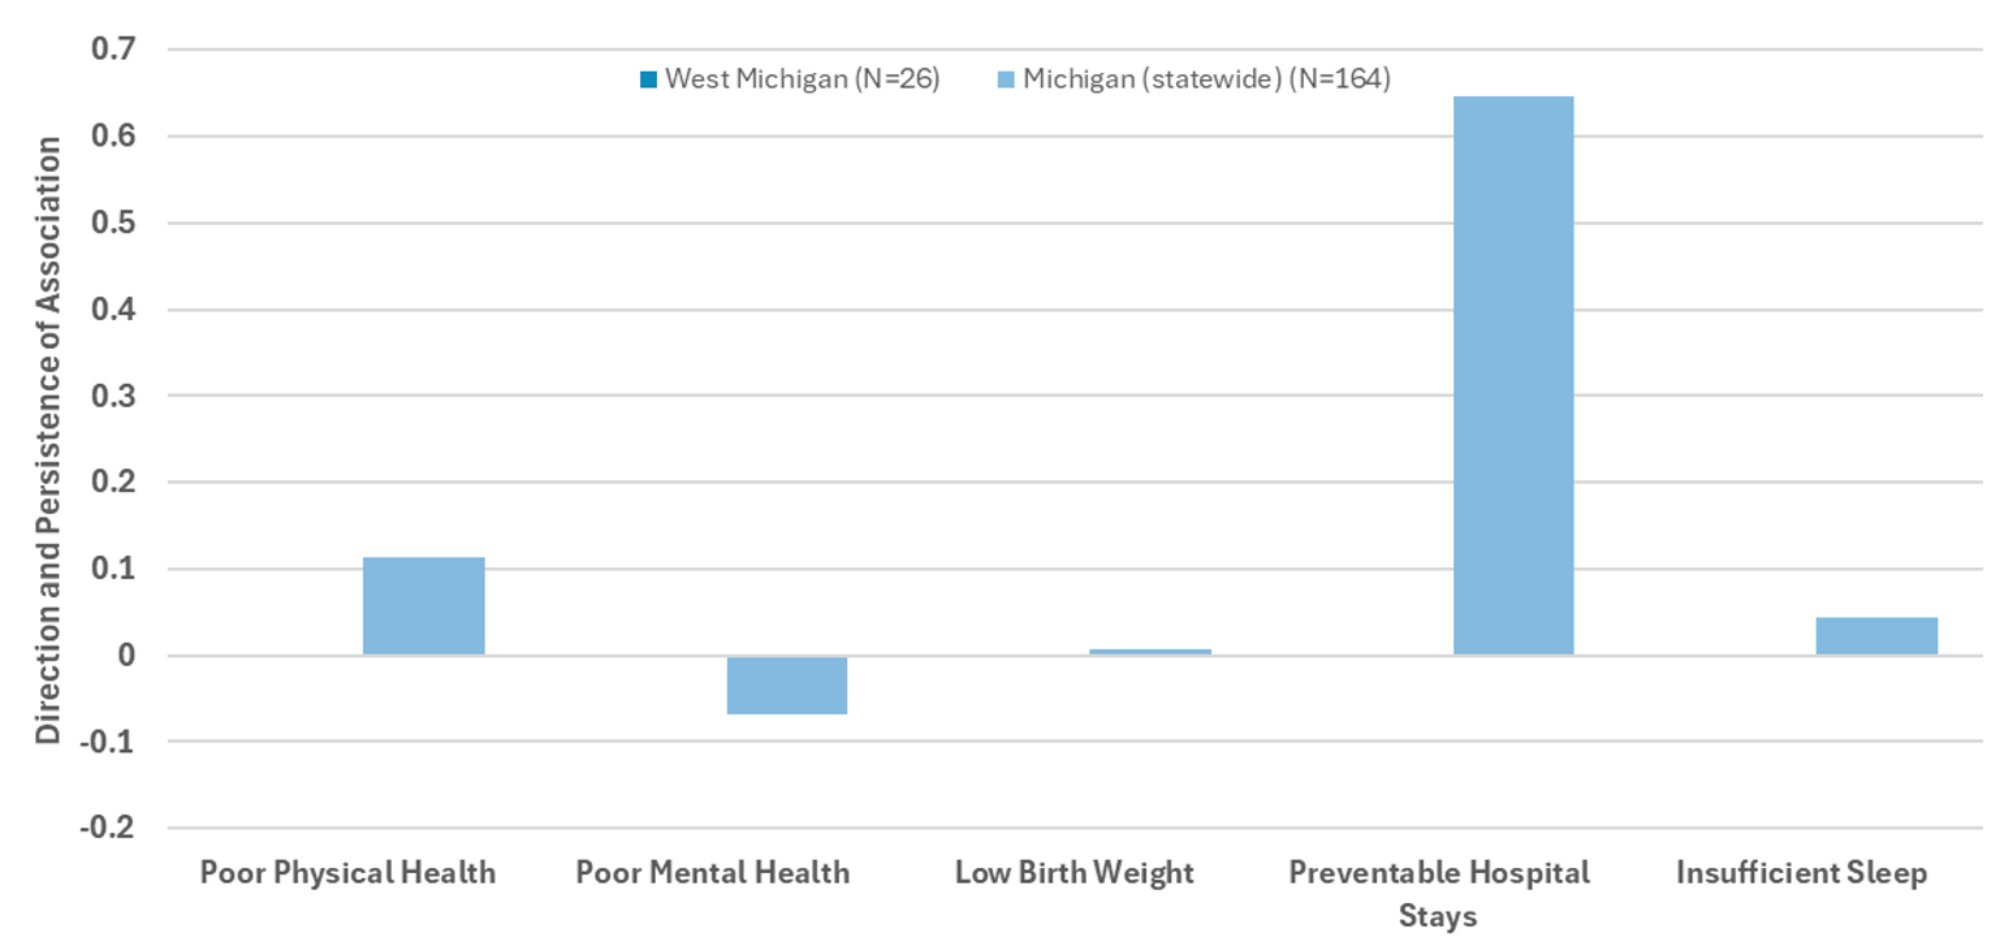
The next step in our analysis is to focus only on the environmental burden component of the EJI and examine if the results remain the same. It turns out that the association between environmental risks and certain health outcomes disappears in this exercise. Figure 3 shows that in West Michigan, only infant mortality and low birth weight are statistically significantly associated with environmental burden. Meanwhile, looking at all of Michigan, environmental burden is significantly associated with infant mortality, poor mental health, low birth weight, and preventable hospital stays.
Figure 3: Association between the Environmental Burden (only) and Health Outcomes in West Michigan and Michigan (statewide)
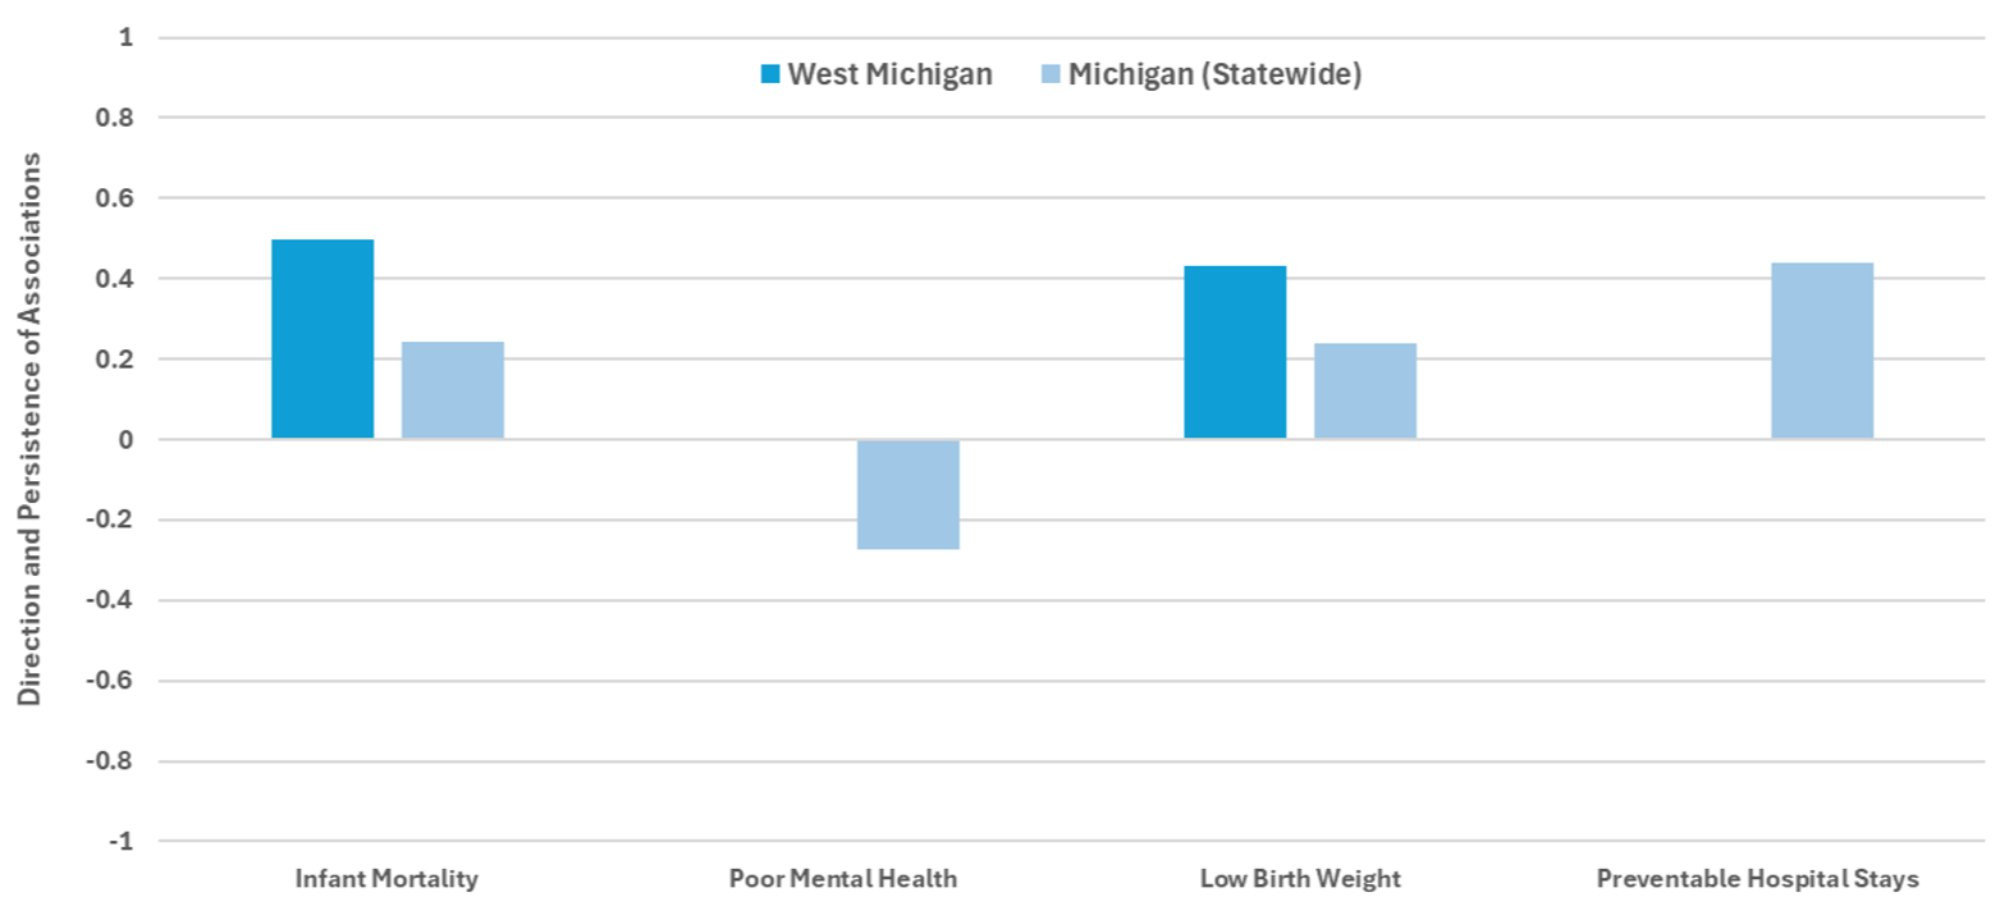
Description: Figure 3 describes the correlation between the environmental burden component of EJI and health outcomes in Michigan (statewide) and West Michigan counties. In both West Michigan counties and all Michigan counties, we observe positive correlations between the EJI and infant mortality as well as low birth weight. Across all Michigan counties, we find a positive correlation for preventable hospital stays, and a negative correlation for poor mental health.
Source: CDC/ATSDR; Author’s Calculations
Taken together, these patterns suggest that environmental burden alone does not fully explain differences in health outcomes. Instead, environmental risks appear to be most harmful in communities with higher socioeconomic vulnerabilities. The impacts of environmental risks are magnified for residents who also face economic insecurity, limited access to healthcare, and housing constraints. In other words, pollution risks translate into greater health and productivity losses when they intersect with social vulnerability.
We extend our analysis by considering sociodemographic variables, including the proportion of non-white residents, population density, median household income, and the percentage of owner-occupied housing units. That is, we ask whether, when comparing only individuals with very similar sociodemographic characteristics, we still observe a strong association between environmental burden and health outcomes.
In West Michigan counties, our results in Figure 4 indicate that only two variables remain statistically associated with the environmental burden: infant mortality and poor physical health. The results indicate that infant mortality increases by about 1 percent for every additional unit increase in EJI, whereas the impact on poor physical health is a bit less but remains significant. Looking at all counties in Michigan, we find that six of the nine health outcomes are significantly correlated with environmental burden, even after accounting for the impact of socioeconomic variables. In this case, increases in environmental burden are associated with higher premature deaths, poor physical health, low birth weight, preventable hospitalizations, and insufficient sleep.
Figure 4: Association between the Environmental Burden and Health Outcomes, accounting for Socio-Economic Variables
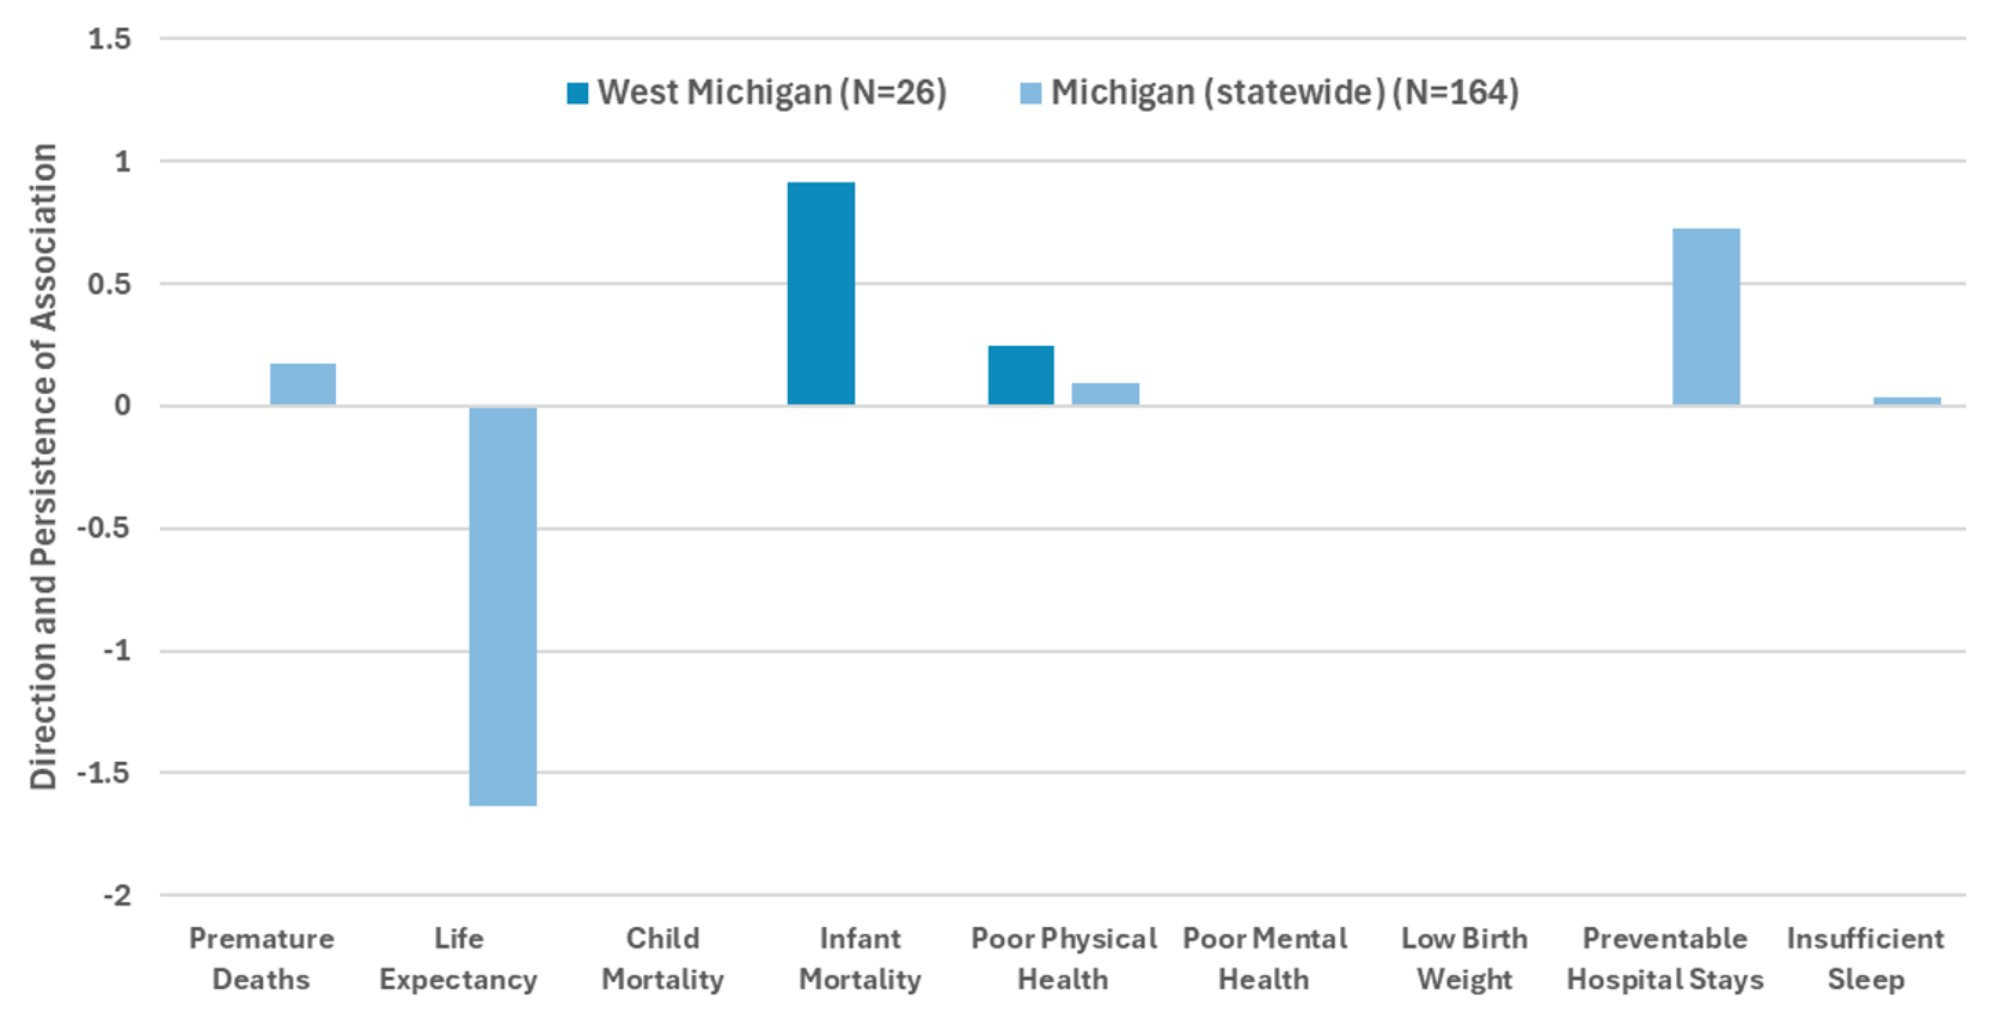
Description: Figure 4 describes the correlation between the environmental burden component of EJI and health outcomes after accounting for the impact of socioeconomic variables in Michigan (statewide) and in West Michigan counties (in a regression setting). We observe that for West Michigan counties, an additional unit increase in the EJI score is associated with a 1-percent increase in infant mortality and a smaller but statistically significant increase in poor physical health. Across all Michigan counties, a similar increase in the EJI score is associated with higher premature deaths, lower life expectancy, increases in poor physical health and preventable hospital stays, low birth weight, and insufficient sleep.
Source: CDC/ATSDR; Author’s Calculations
Finally, we ask the question, what if we also take into account access to health care? That is, if we compare only those having very similar sociodemographic characteristics and healthcare access, do we still see a strong link between environmental burden and health outcomes? For this exercise, we consider these additional variables: percentage of the population under 65 without health insurance and the number of primary care physicians per 100,000 inhabitants at the county level. Our results indicate that the number of health outcomes significantly associated with EJI decreases after accounting for the impact of healthcare access. At the state level, the number of significant variables falls to five out of nine: higher EJI is associated with increases in poor physical health, low birth weight, preventable hospital stays, and insufficient sleep. Focusing only on West Michigan, the association between environmental burden and health outcomes, in fact, totally disappears when both socioeconomic and health access variables are accounted for.
Figure 5: Association between the Environmental Burden and Health Outcomes, accounting for Socio-Economic Variables and Access to Health Services Variables
Description: Figure 5 describes the correlation between the environmental burden component of EJI and health outcomes after accounting for the impact of socioeconomic variables and healthcare access in Michigan (statewide) and in West Michigan counties (in a regression setting).We observe that across all Michigan counties, after accounting for socioeconomic factors and access to health services, a higher EJI score is associated with increased poor physical health, low birth weight, preventable sleep, and insufficient sleep. In the case of West Michigan, the inclusion of variables on access to health services eliminates any significant association between environmental burden and health outcomes.
Source: CDC/ATSDR; Author’s Calculations
Implications
Overall, the results presented in this analysis underscore an important message for business leaders and policymakers in West Michigan: environmental conditions are not merely a public health concern—they are an economic concern. Counties facing greater environmental burdens also tend to experience poorer health outcomes, particularly when these environmental risks intersect with socioeconomic vulnerability.
For the business community, investing in environmental quality and social resilience is not philanthropy—it’s a strategic move. Companies that engage in sustainability and community health initiatives can lower healthcare costs through reduced chronic illness, improve productivity by minimizing absenteeism, and enhance brand reputation while attracting talent seeking, socially responsible employers. From a business perspective, EJI offers a data-driven lens to identify high-risk areas for workforce health; guide site selection and expansion decisions; and inform community investment strategies that enhance operational resilience.
The findings also suggest that investments aimed at improving environmental quality may yield their largest economic returns when paired with efforts to reduce social vulnerability. Improving access to healthcare, stabilizing housing, and supporting income growth can reduce the extent to which environmental risks translate into costly health outcomes.
Ultimately, addressing environmental and social vulnerabilities is more than a moral imperative—it’s a business necessity. Companies that act now to reduce environmental risks and strengthen community health will secure a competitive edge, lower costs, and contribute to a thriving West Michigan economy.
Notes
[1] These agencies include the U.S. Census Bureau, the U.S. Environmental Protection Agency, the U.S. Mine Safety and Health Administration, the U.S. Geological Survey, OpenStreetMap, the U.S. Department of Transportation, and the U.S. Centers for Disease Control and Prevention.
[2] More specifically, PM2.5 which the Environmental Protection Agency describes as inhalable particles, with diameters that are generally 2.5 micrometers and smaller. These can be inhaled deep into the lungs and enter the bloodstream, causing respiratory and cardiovascular issues.
[3] According to the West Michigan Clean Air Coalition (2025), the presence of particulate matter and ozone is usually associated with changes in the incidence of respiratory diseases, heart conditions, and absenteeism.
[4] For the purposes of this document, we include Allegan, Barry, Berrien, Calhoun, Cass, Eaton, Ionia, Kalamazoo, Kent, Montcalm, Ottawa, St. Joshep and VanBuren Counties as West Michigan.
[5] Correlation describes the relationship between variables: Positive means they move together (both up/down); Negative means they move oppositely (one up, one down); Zero means no linear relationship. The closer the correlation coefficient is to 1 (-1), the stronger the positive (negative) association between two variables. It may be noted that when the correlation coefficient is not significantly different from zero, then it can be concluded that the two variables don’t have any linear relationship.
[6] Classified into (1) measures of mortality (i.e., years of life lost or premature deaths, life expectancy, child mortality, and infant mortality); (2) health conditions (i.e., poor physical health, poor mental health, low birth weight, preventable hospital stays, and insufficient sleep).
References
CDC and Agency for Toxic Substances and Disease Registry. (2022 & 2024). Environmental Justice Index. https://atsdr.cdc.gov/place-health/php/eji/index.html. Accessed: June 2025.
CDC. (2024, December 3). Environmental Justice Index. Place and Health - Geospatial Research, Analysis, and Services Program (GRASP). Retrieved: October 30, 2025. https://www.atsdr.cdc.gov/place-health/php/eji/index.html
Fitzgerald, W., & Gehrke, G. (2025). CDC Environmental Justice Index (EJI) County Map Series: Prepared County Maps [Data set]. Environmental Data & Governance Initiative. https://doi.org/10.5281/zenodo.14641818
University of Wisconsin Population Health Institute. County Health Rankings & Roadmaps 2024 (2022). https://www.countyhealthrankings.org/
West Michigan Clean Air Coalition. (2025). Monitoring Information. West Michigan Clean Air Coalition. Retrieved: October 29, 2025. https://www.wmcac.org/air-quality-monitoring/