The State of the Grand Rapids Labor Market
By Gerry Simons, Ph.D., Professor, Department of Economics
Labor market issues are a perennial concern in business and conditions in the market are often seen as bellwethers for the broader economy. In this article I highlight some of the key measurements of the greater Grand Rapids labor market, with some historical perspective from the last few years. [1]
Figure 1: Unemployment Rate
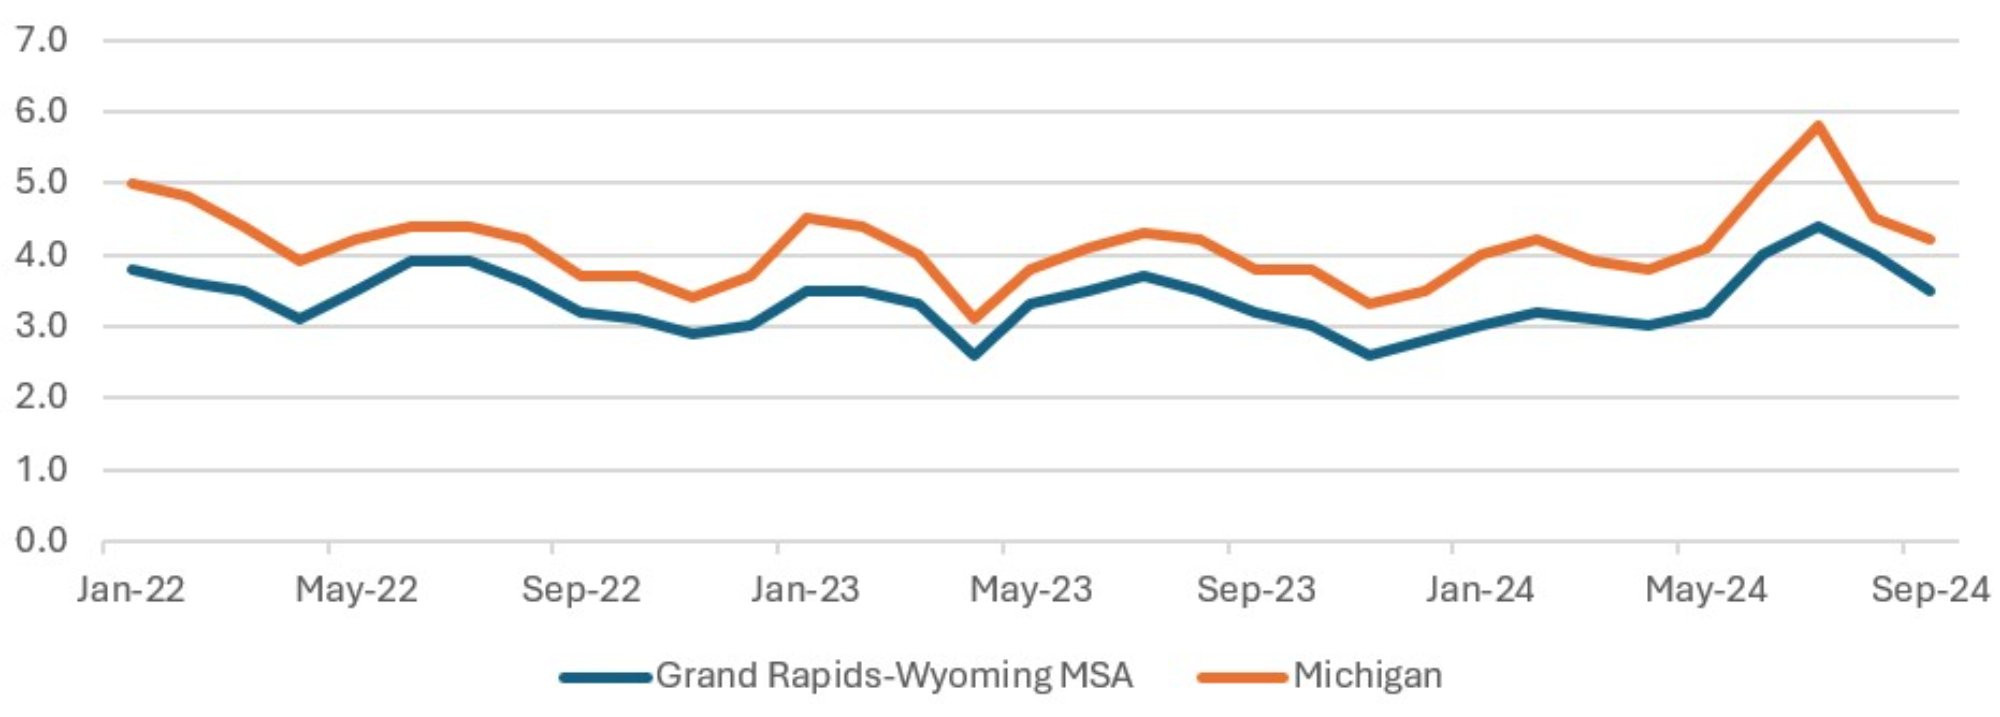
Description: The Unemployment Rate graph shows that the Grand Rapids-Wyoming MSA has a lower unemployment rate than Michigan as a whole and that both rates have been fairly stable.
Source: Bureau of Labor Statistics.
Figure 1 shows the monthly unemployment rate for the Grand Rapids-Wyoming Metropolitan Statistical Area (MSA) [2] and Michigan as a whole, from January 2022-September 2024. As is usually the case, the metro Grand Rapids unemployment rate was consistently below that for the state as a whole. Both the MSA and the state experienced generally stable trends during this time period. For the entire period of January 2022-September 2024, unemployment rates averaged out to 3.4% for the MSA and 4.1% for the state, while the averages for January 2024-September 2024 were 3.5% and 4.4% respectively.
Although the unemployment rate has been fairly stable, the labor force for metro Grand Rapids has increased by almost 43,000 people from January 2022-September 2024, as shown in Figure 2, a growth rate of 7.5%. Bureau of Labor Statistics (BLS) data shows that this compares to a 5.8% increase in the Michigan labor force and a 3.5% increase in the labor force of the U.S. as a whole.
Figure 2: Civilian Labor Force, Grand Rapids-Wyoming MSA
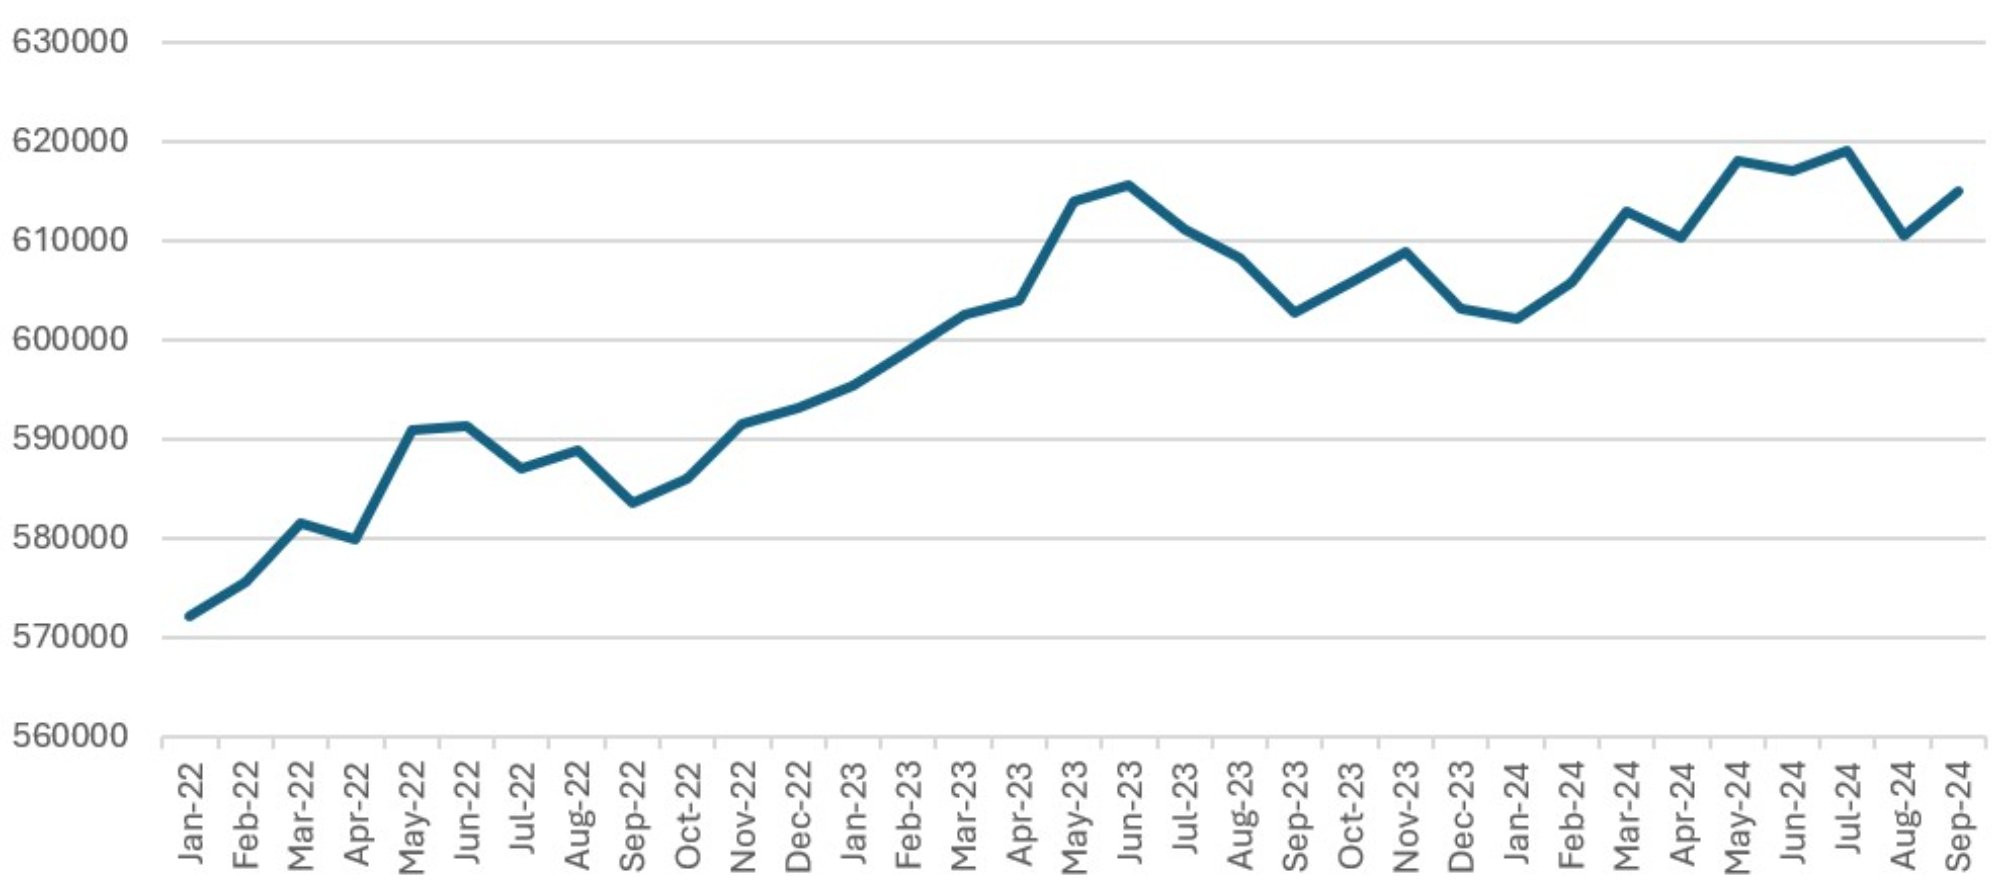
Description: The Labor Force graph shows that the civilian labor force in the Grand Rapids-Wyoming MSA has increased somewhat steadily to about 615,000 people in September 2024.
Source: Bureau of Labor Statistics
While some of this labor force growth reflects overall population growth in the area, it is also affected by the labor force participation rate (LFPR), which measures the percentage of working-age people who are either employed or actively seeking employment – therefore omitting those who choose not to work. Reliable government data for West Michigan’s LFPR are not available, but the BLS does measure the LFPR at the state level. Figure 3 shows the LFPR for Michigan (with those of Ohio and Indiana for comparison) from January 2022-September 2024. Michigan’s LFPR was initially well below that of Ohio and Indiana but increased to a comparable level by September 2024. It is important to note that the LFPR in Michigan has been very stable since June 2023, with values just over 62%. This is close to the highest LFPR values that Michigan has experienced since August 2009 and may indicate that labor force growth in the near future is unlikely to come from further increases in the LFPR and will instead be due only to population growth in the area, including from worker migration to West Michigan.
Figure 3: Labor Force Participation Rates
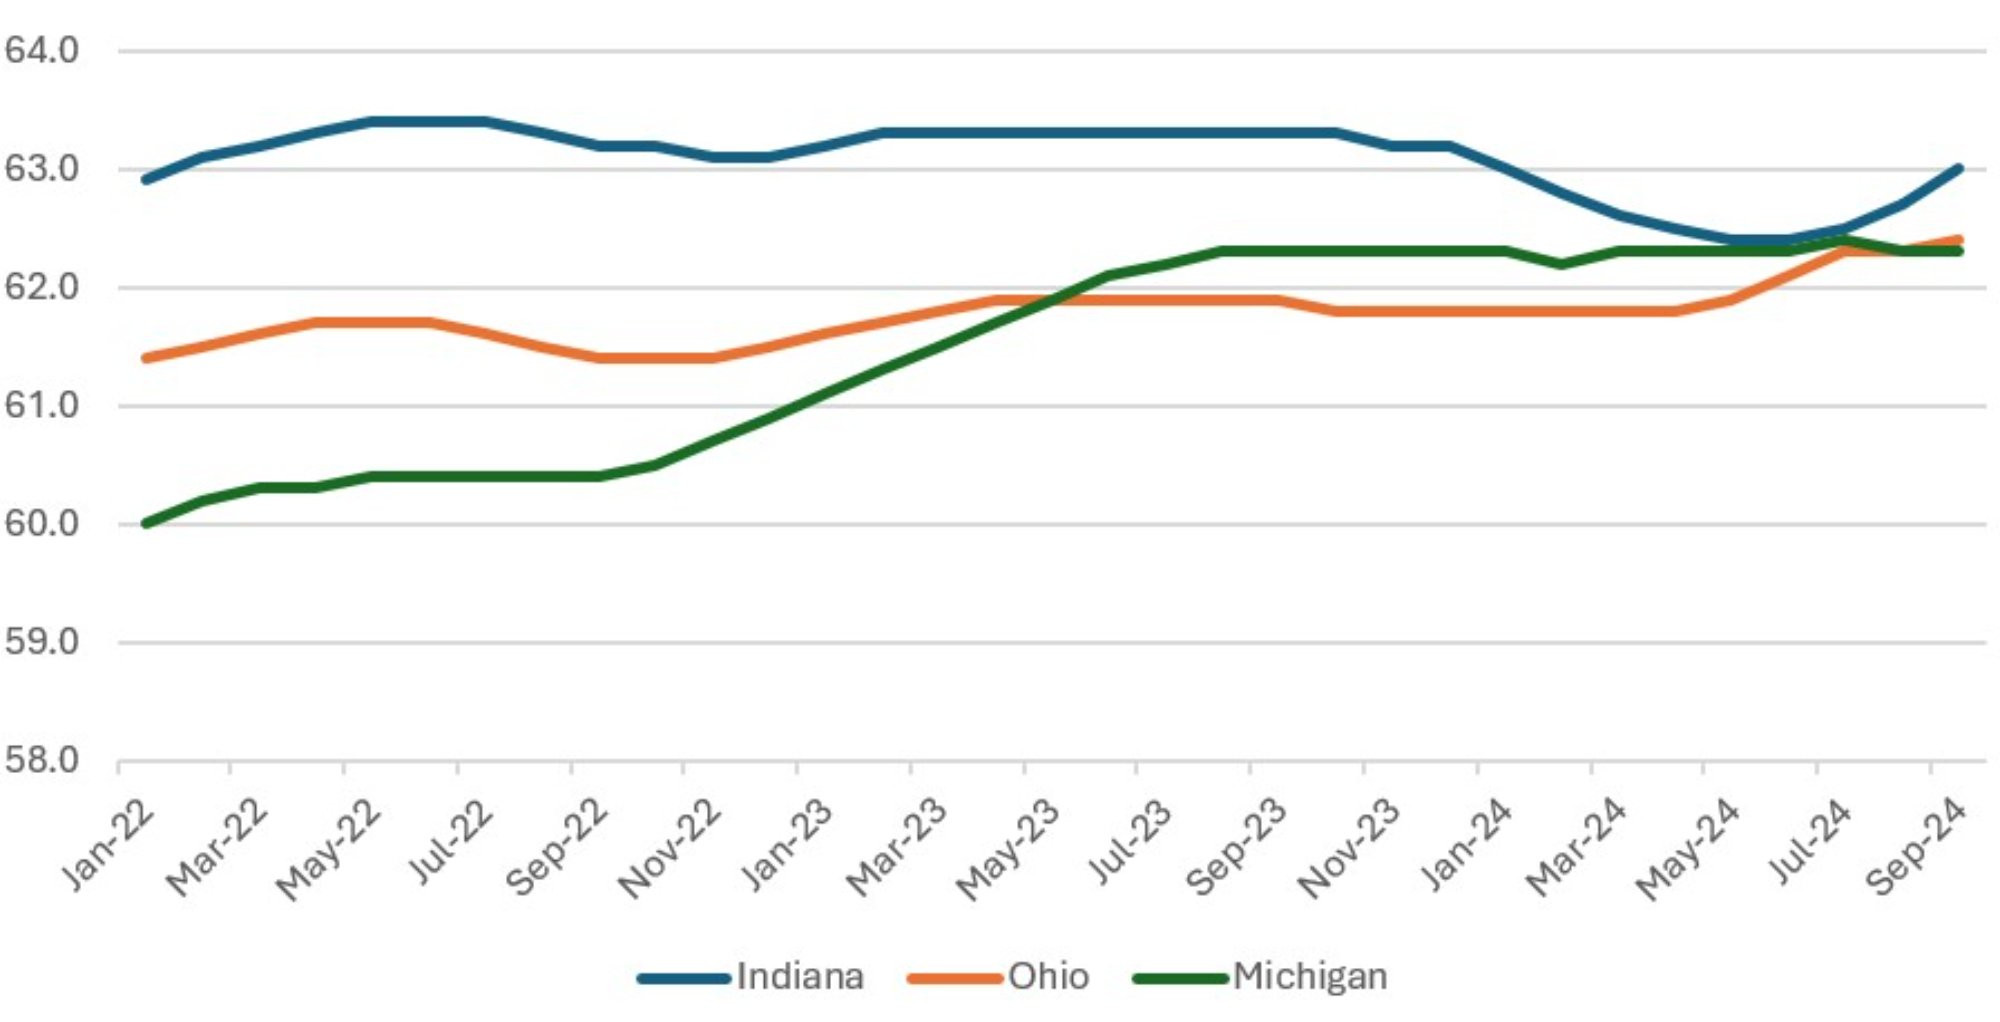
Description: The Labor Force Participation Rate graph shows that the rate for Michigan has increased since 2022 from 60% to about 62% in September 2024 and has caught up to the rates for Indiana and Ohio.
Source: Bureau of Labor Statistics
Along with the changes in overall employment in West Michigan shown above, there have been different changes in employment across sectors. Table 1 shows the five largest sectors of nonfarm employment in the metro Grand Rapids area and how those sectors have changed over time. [3] Although all of the sectors shown experienced increases in employment for September 2022-September 2023, the percentage changes vary significantly. For September 2023-September 2024, employment in the manufacturing sector and in professional and business services decreased while the other three sectors experienced positive growth though all at a slower pace than for September 2022-September 2023. This indicates a slowdown of growth in the West Michigan labor market.
Table 1: Employment in Grand Rapids-Wyoming MSA
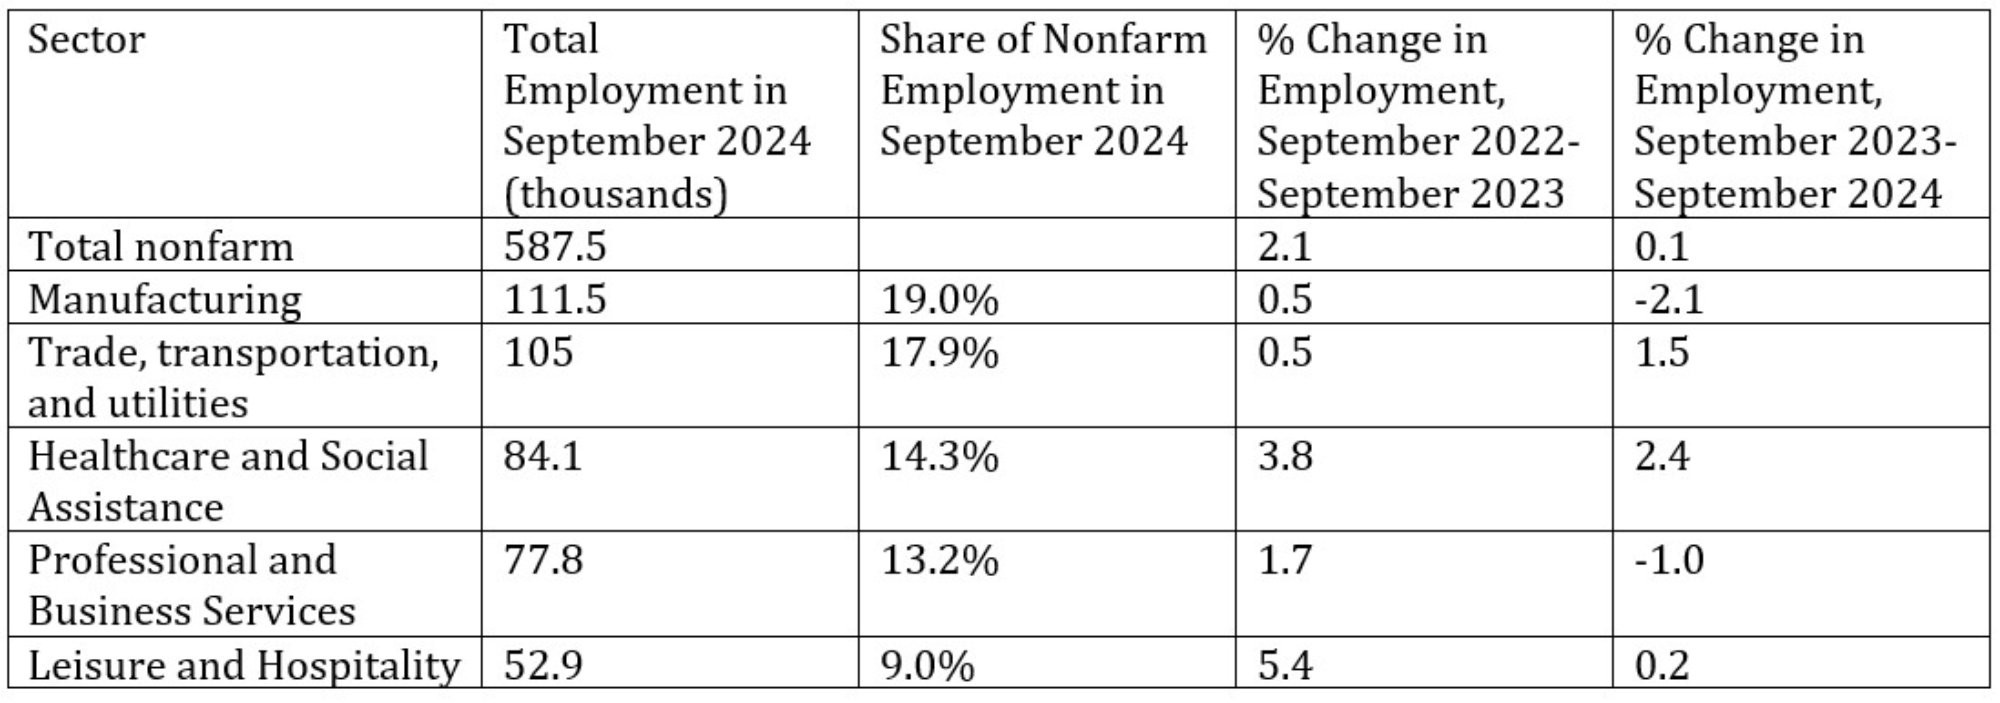
Description: The Employment table shows that employment growth in the largest sectors of the Grand Rapids-Wyoming MSA has been declining. While employment in healthcare and social assistance has increased over the past year, employment in manufacturing and professional and business services has declined.
Source: Bureau of Labor Statistics
What about worker pay? With the relatively low unemployment rate, workers’ concerns over the cost of living, and the difficulties some employers have faced in filling open positions, we might expect a corresponding increase in worker pay. Figure 4 shows the average weekly earnings of all private sector employees in the Grand Rapids-Wyoming MSA both nominally and after adjusted for inflation. Over the time period shown, average weekly earnings changed very little – a growth of about 1% from January 2022-September 2024. When adjusted for inflation, this represents a 9.3% decrease in average weekly earnings.
In conclusion, the West Michigan labor market has been strong over the last few years but is experiencing a definite cooldown. The lackluster pattern of inflation-adjusted pay is a concern, as that has a dampening effect on consumer spending. While there has still been some growth in overall employment, a deterioration in the economic fundamentals of the U.S. economy as a whole could be enough to push the regional market from a cooldown into an outright decline.
Figure 4: Average Weekly Private Employee Earnings, Grand Rapids-Wyoming MSA
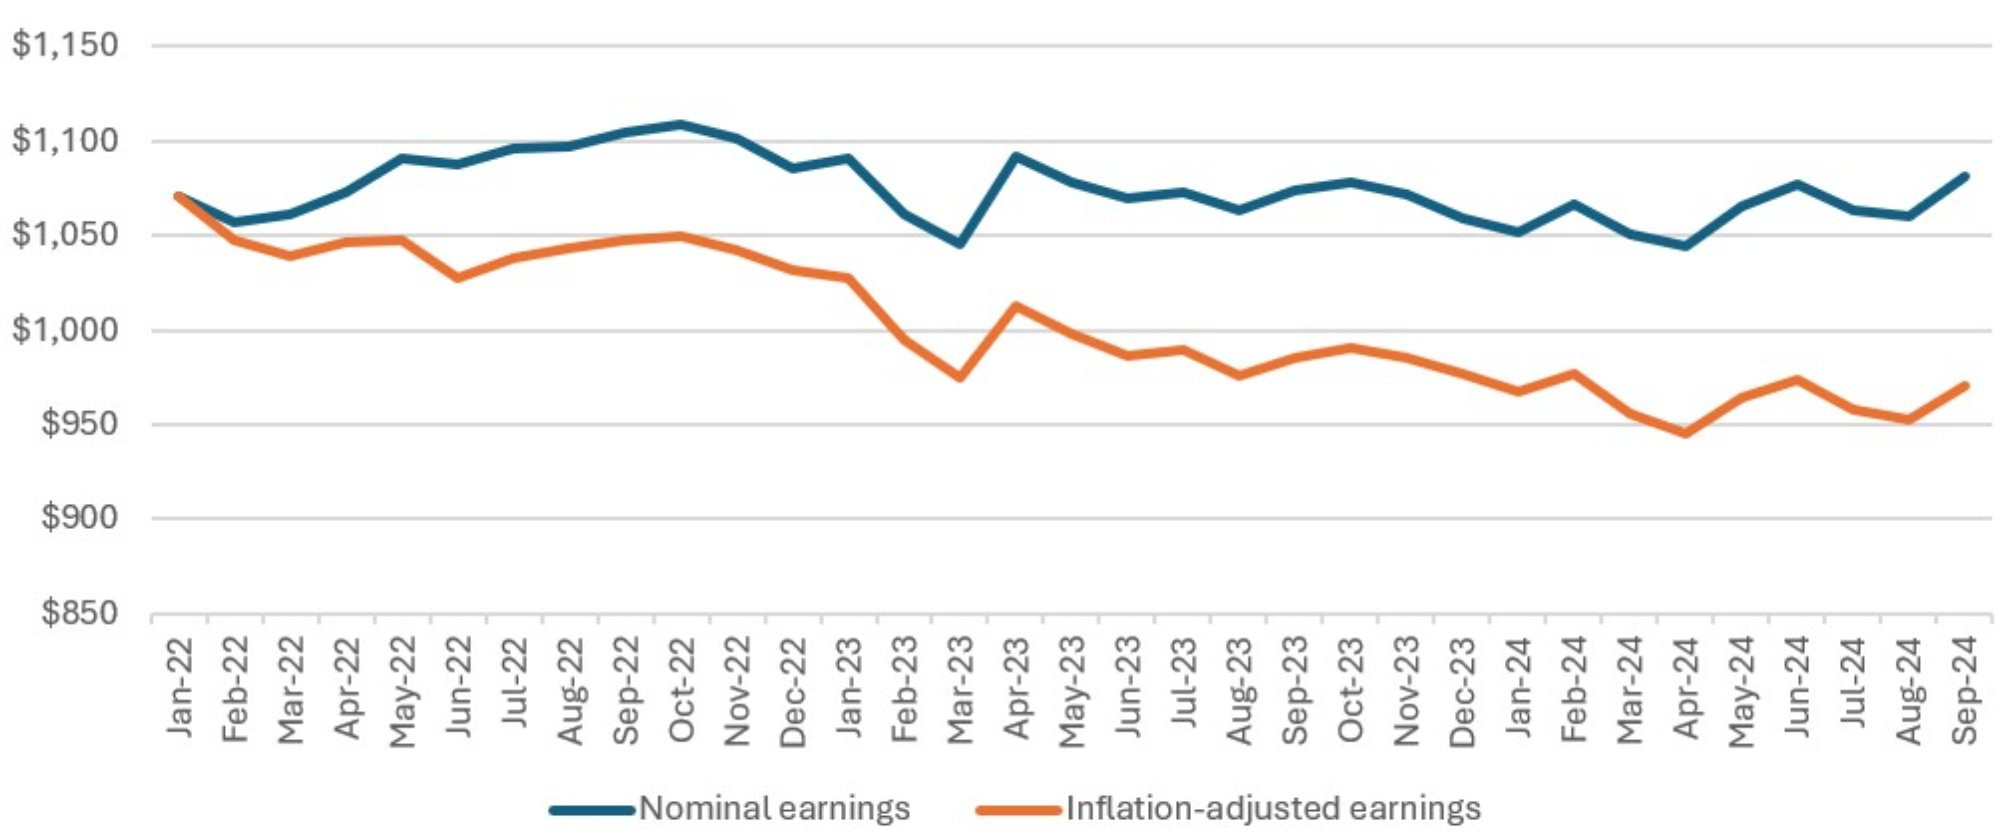
Description: The Weekly Earnings graph shows that the average weekly earnings of private sector employees in the Grand Rapids-Wyoming MSA has been fairly stable since 2022 at just over $1050. A However, when adjusted for inflation, these earnings have experienced a significant decline in purchasing power.
Source: Bureau of Labor Statistics and author’s calculations.
Notes
[1] All the data presented here are from the database of the Bureau of Labor Statistics (BLS; part of the U.S. Department of Labor). This database is freely available to the public online at bls.gov
[2] In 2018, the Office of Management and Budget changed the definition of the Grand Rapids-Wyoming MSA (from Barry, Kent, Montcalm, and Ottawa counties to Ionia, Kent, Montcalm, and Ottawa counties) and renamed it the Grand Rapids-Kentwood MSA. However, the BLS continues to use the earlier definition to make historical comparisons easier.
[3] To avoid the distortion caused by seasonal employment variations, percentage changes here are calculated using the same starting and ending month.