Grand Rapids Housing Market - 2024 In Review
By Laudo M. Ogura, Ph.D., Associate Professor, Department of Economics
Paul Isely, Ph.D., Associate Dean, Seidman College of Business
In 2024, the U.S. housing market continued to face high mortgage rates, with an average of 6.7% for the year. There was a short-lived drop in rates during August and September, reaching 6.1% and raising hopes that sales would rebound, but rates went up again to previous levels by November. As a result, home sales slowed down by another 2% in 2024 after a 20% decline in 2023. Construction activity also dropped further from an annual rate of 1.4 million new private housing starts in 2023 to 1.3 million in 2024. Home prices, however, recovered slightly by about 5% on average compared to the previous year. See Table 1 for details on the U.S. economy and housing data.
Table 1: Economic and Housing Market Conditions
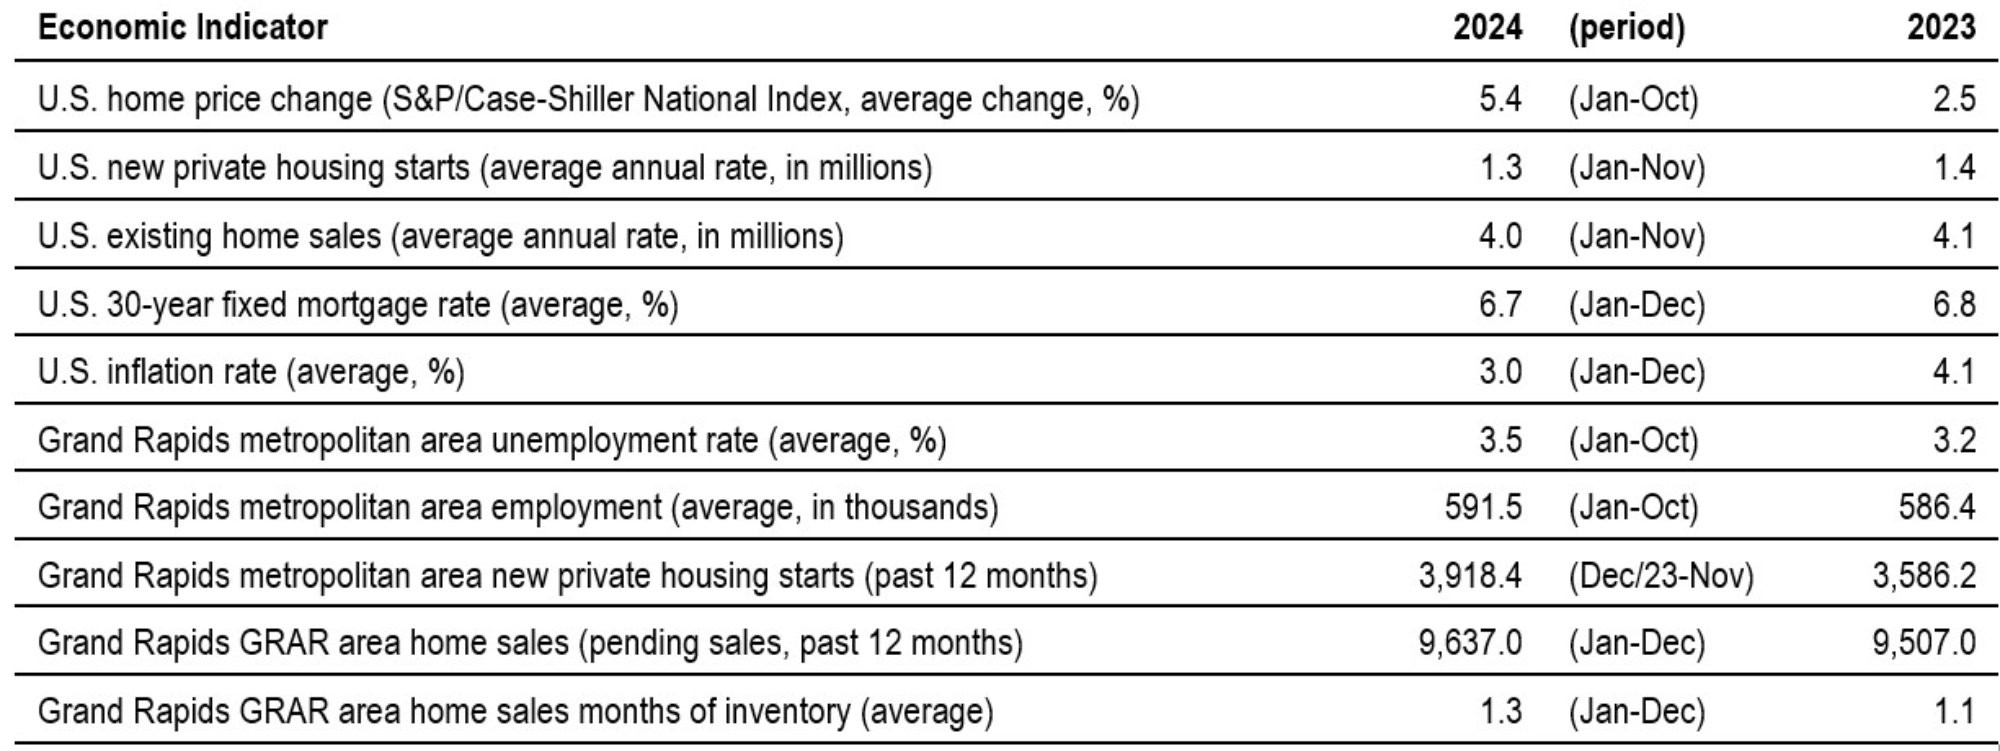
Notes: The Grand Rapids metropolitan area includes Kent, Ottawa, Barry, and Montcalm counties. The Greater Regional Alliance of Realtors (GRAR) area includes Kent County, Ionia County, and parts of Ottawa, Barry, and Allegan counties. For 2024, data availability was limited to the months noted in the table.
Description: The Economic and Housing Market Conditions table shows that, at the national level, prices increased slightly faster in 2024, but sales and construction were stable as mortgage rates did not go down significantly. At the regional level, construction activity increased, but sales were stable.
Sources: Greater Regional Alliance of Realtors (2025) and Federal Reserve Bank of St. Louis (2025).
For the Grand Rapids region, our price index estimates are presented in Figure 1. The indexes are arbitrarily set to equal 100 in 2006, when home prices in the region peaked before the crash. The estimates are based on the repeat-sales method and include only typical non-distressed home sales. The main advantage of this method is that it compares the prices of the same houses as they are resold over time, thus holding the quality of the houses relatively constant (see Technical Notes at the end of the article for details). For homes in the City of Grand Rapids, our estimates show prices rising by an average of 9% in 2024 following a 7% increase in 2023. In comparison, home prices in the suburban municipalities of East Grand Rapids and Grand Rapids Township rose by 6% in 2024 following a 7% increase in the previous year.
Figure 1: Housing Price Indexes (HPI) for the Grand Rapids Area
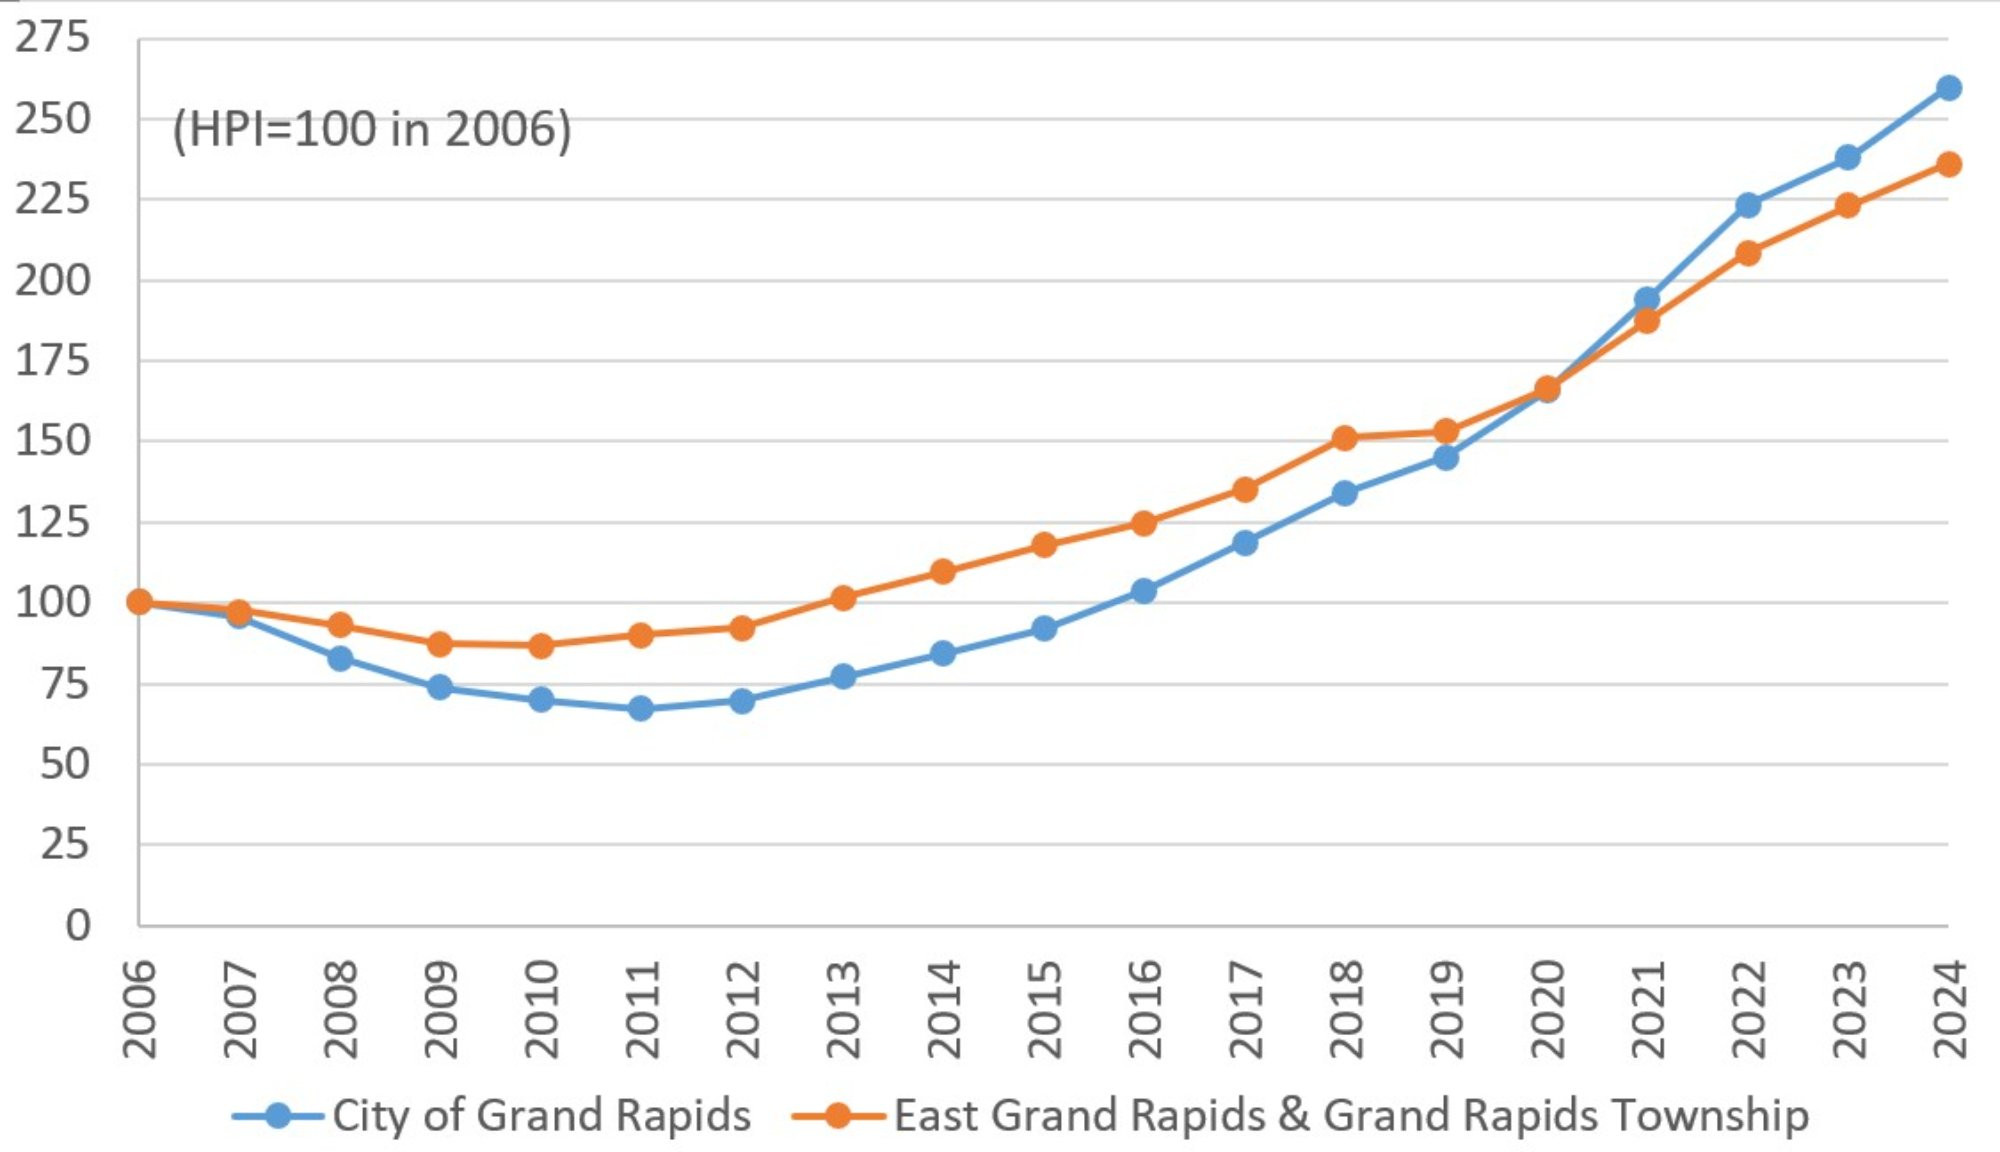
Note: See Technical Notes at the end of the article for details.
Description: The Housing Price Indexes graph shows that home prices increased further in the Grand Rapids City and the suburban municipalities of East Grand Rapids and Grand Rapids Township, continuing a trend that started in 2012, after the housing foreclosure crisis in 2008-2011.
Source: BS&A Software (2025).
The increasing price trends in the region result from a strong local demand for housing relative to a constrained supply. The high demand reflects rising employment, which grew by another 1% in 2024 in the region, together with low unemployment rates, at 3.5% on average for the year (see Table 1). Demand has also grown in recent years due to millennials continuing their transition to homeownership, as most millennials are in their thirties now. On the supply side, the rate of building permits issued in the region has increased slightly in the past few years despite higher costs of construction and financing. This trend in local construction contrasts with the declining rates in the nation as a whole (see Figure 2). However, the current rate of construction is not enough to offset the low inventory of homes for sale, which continued to reflect a 1.7 month supply by November of 2024 (Greater Regional Alliance of Realtors, 2025). With high mortgage rates, existing homeowners remain unwilling to trade homes, since most of them are paying much less for their current mortgage loans. As a consequence, the number of houses sold remained stable in 2024, rising by 1% compared to 2023, but still 25% below the levels seen in 2019 and 2020 (Greater Regional Alliance of Realtors, 2025).
Figure 2: New Housing Units Building Permits in the Grand Rapids Metro Area vs. Nation
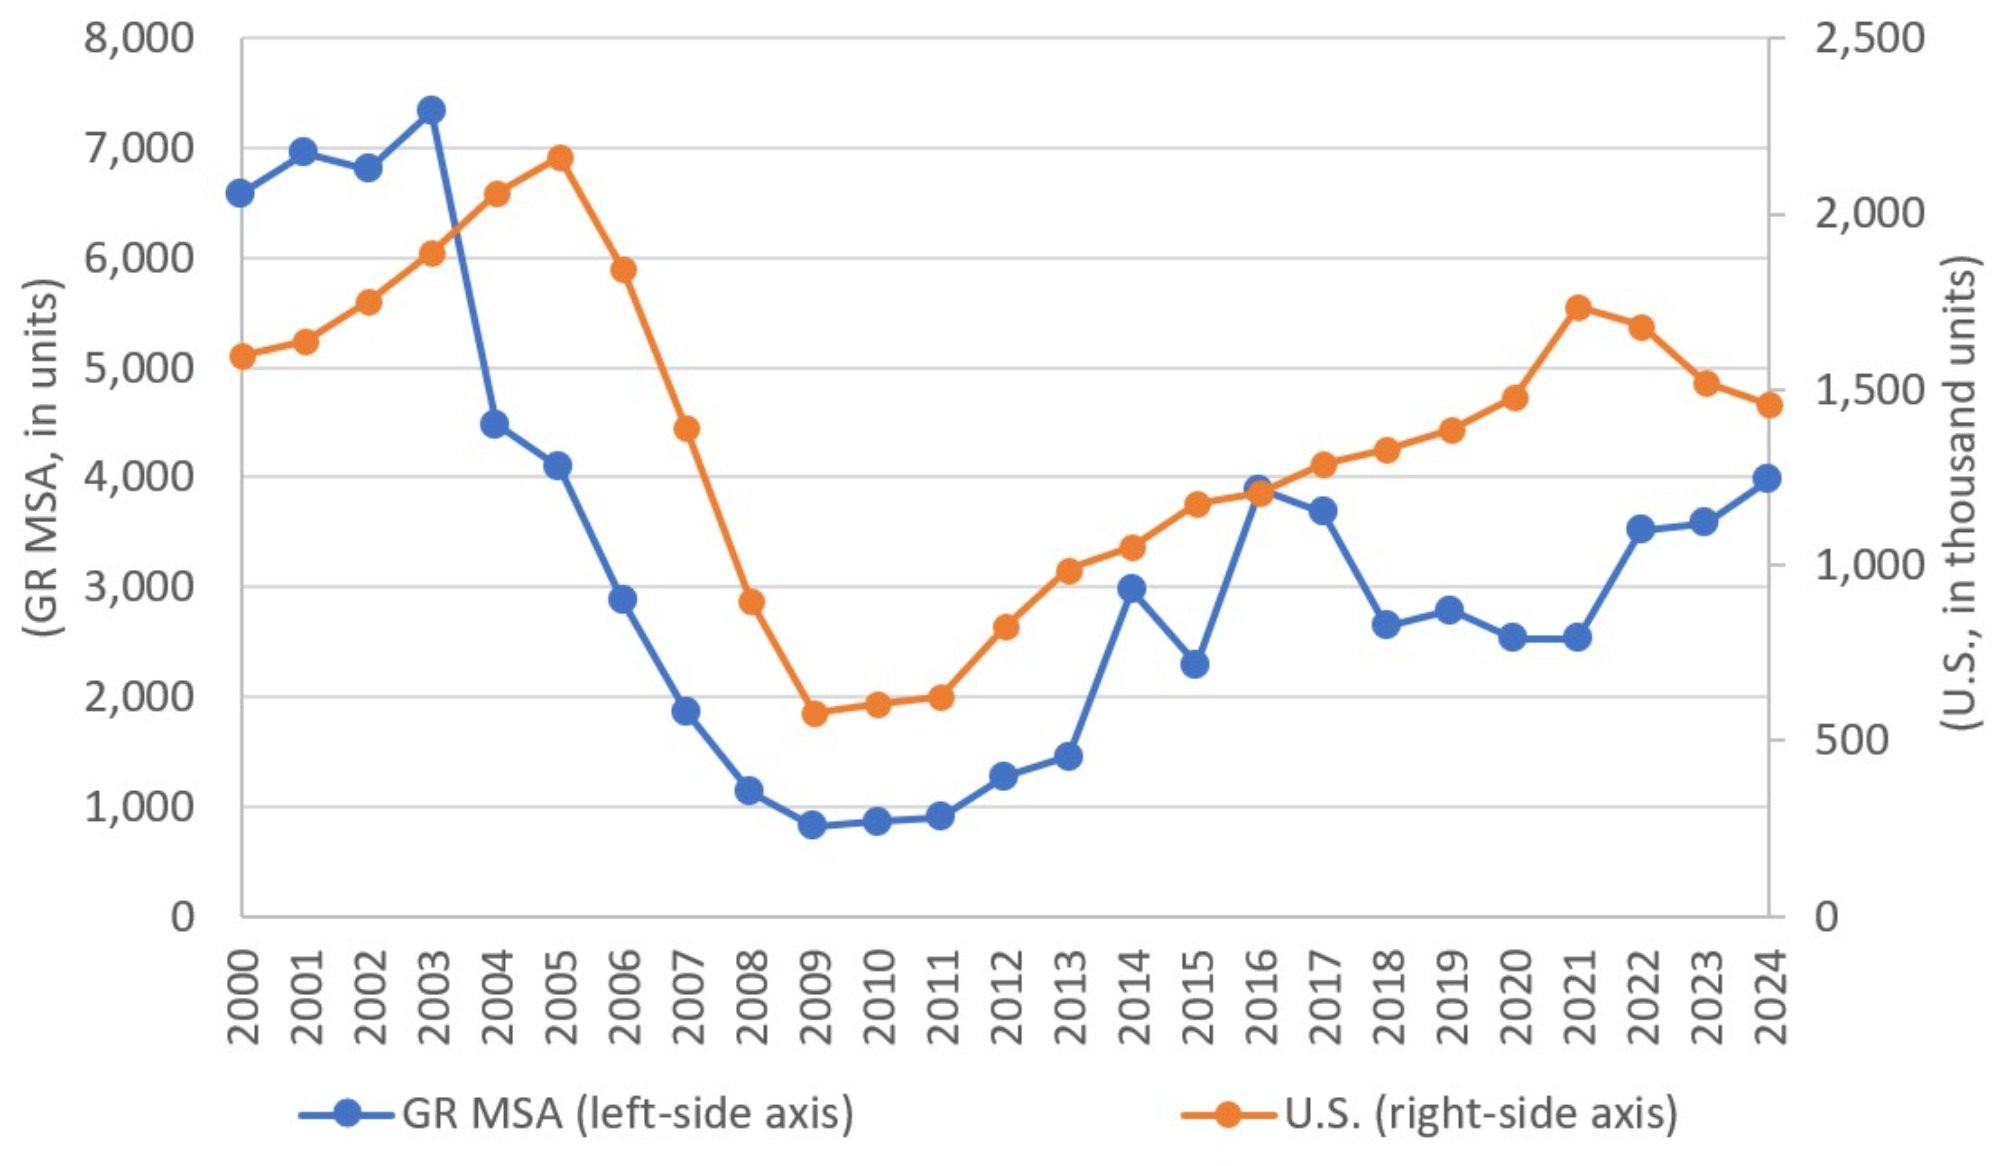
Note: The Grand Rapids metropolitan statistical area (GR MSA) includes Kent, Ottawa, Barry, and Montcalm counties.
Description: The New Housing Units Building Permits graph shows that construction activity has been in an upward trend since the housing foreclosure crisis in 2008-2011, but it has slightly declined in the last few years in the nation, contrasting with the increase seen in the Grand Rapids metropolitan area.
Source: Federal Reserve Bank of St. Louis (2025).
Our price index estimations also suggest that there was a shift in demand towards less expensive housing units, likely in response to the rising home buying costs in recent years. Since 2021, prices have risen by 32% on average in the three municipalities considered in our price index estimations shown in Figure 1. However, median sale prices have grown by only 23% in the same period in the area, suggesting that homes of a less expensive quality mix have been traded. In addition, the price index for the City of Grand Rapids has grown faster in recent years than for the suburban neighboring areas (see Figure 1). The faster appreciation of houses in the City of Grand Rapids, where they are still less expensive, reflects a greater demand for more affordable units, in addition to the increasing attractiveness of the city, which has seen strong redevelopment activity in the downtown area in recent decades.
The high expense and lack of single-family properties for sale in the area has resulted in households continuing to rent, with rental prices rising faster than inflation in the region (see Figure 3, using data from Zillow, 2025). Developers are responding by producing more multi-family housing, which represented nearly 40% of authorized residential unit permits in 2024 in the metropolitan area (Federal Reserve Bank of St. Louis, 2025). Anecdotal evidence supports the view that affordability has been an issue, with increased interest in efficiency units as the costs of renting one-bedroom units continue to rise. As long as there continues to be an affordability issue with single family housing, demand for rental properties will remain strong, pressuring rental rates to rise.
Figure 3: Smoothed Year-Over-Year Rent Change for the Middle of the Market
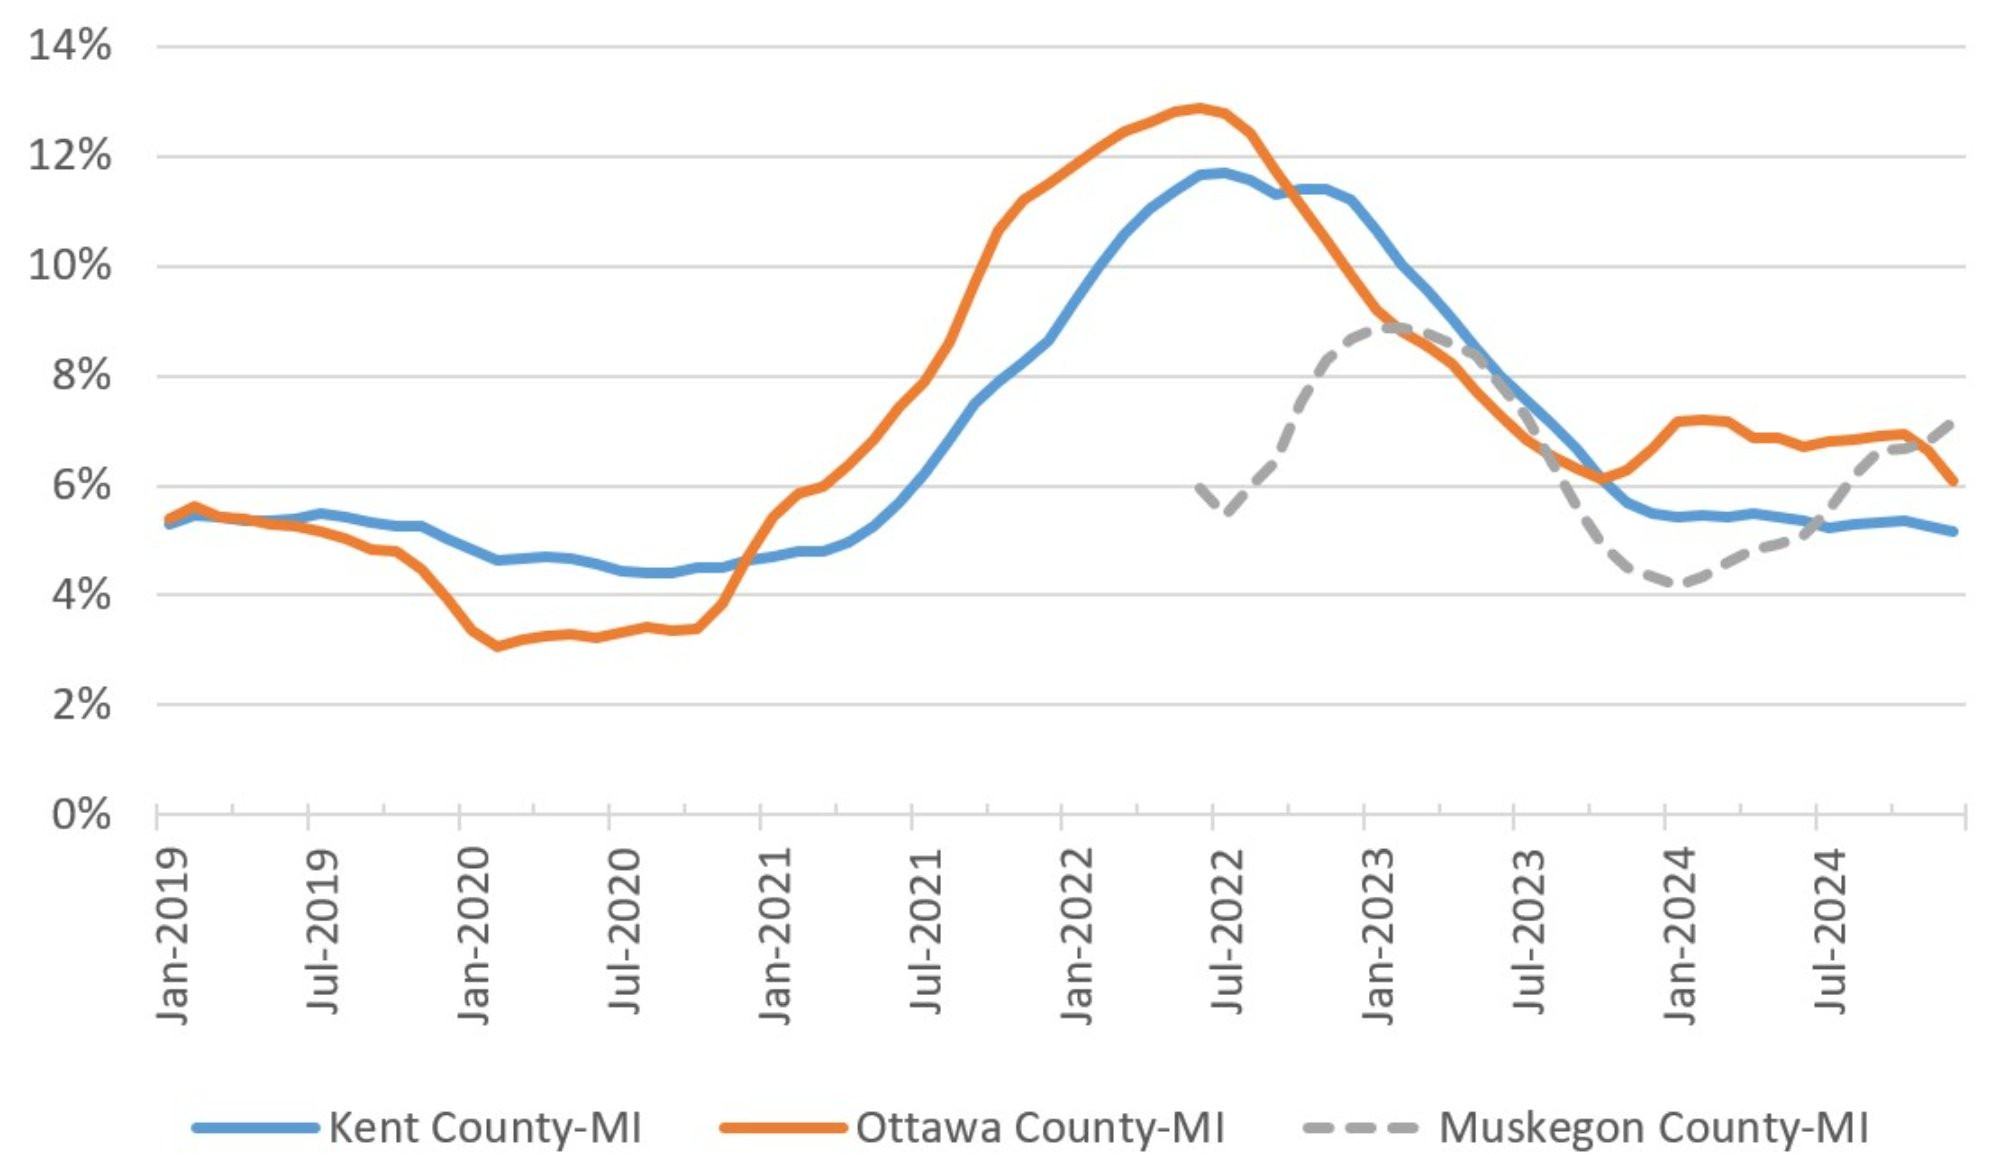
Notes: Monthly periodicity. Middle of the market is defined as rental units in the 35 to 65 percentile range of the rent distribution.
Description: The Rent Change graph shows that rental prices have increased by about 5% or more in recent years in the region.
Source: Zillow (2025).
Conclusions
In 2024, the nation avoided a recession, but interest rates remained high. With housing demand staying strong in the region, prices continued to rise due to the limited supply of homes for sale. Construction activity rose slightly, but home sales volume remained low, at similar levels to the previous year. With prices rising, buyers have looked for less expensive housing options, including rental units.
For 2025, while economic growth is likely to continue, there is uncertainty about how fast and how low mortgage rates can go down, so we might see a slow recovery of home sales during the year.
Technical Notes
The housing price indexes shown in Figure 1 are estimated using the repeat-sales method, which compares the prices of the same houses as they are resold over time. The method controls for variation in the quality of the different houses sold in each period, excluding houses that were not resold in the period of study. A possible flaw is that it disregards the impact of improvements or deterioration of each house and/or neighborhood. Nonetheless, the method is widely used to measure average price changes in a broad housing market. For our study, sales data from January 2000 through December 2023 were used. The indexes were set at 100 in 2006 so that they can be interpreted as the amount of money needed to buy a house for every $100 that was needed to purchase the same house in 2006. To better measure the changes in market conditions for typical homes, we exclude:
- newly built properties (age 0 or 1, calculated based on the year built of the building);
- parcels sold for less than $30,000 or that were never sold for at least $50,000;
- parcels sold for more than $1,200,000;
- parcels transferred from or to a government, nonprofit, or financial institution (typically non-market transactions); and
- parcels that had a large variation in prices (possibly due to development or redevelopment).
References
BS&A Software. (2025). Property Sale Search Data. Retrieved January 1, 2025, from https://bsaonline.com/MunicipalDirectory
Federal Reserve Bank of St. Louis. (2025). FRED Economic Data [Data files: CPIAUCSL, CSUSHPISA, EXHOSLUSM495S, GRAN326BPPRIVSA, GRAN326BP1FHSA, GRAN326URN, HOUST, LAUMT262434000000005, MORTGAGE30US, PERMIT]. Retrieved January 15, 2025, from https://fred.stlouisfed.org
Greater Regional Alliance of Realtors. (2025). Market Stats [Data Files]. Retrieved January 15, 2025, from https://www.grar.com/monthly-market-update
Zillow. (2025). Housing Data [ Data Files]. Retrieved January 1, 2025, from https://www.zillow.com/research/data/