Grand Rapids Economic Forecast 2025
By Paul Isely, Ph.D., Associate Dean and Professor of Economics, Seidman College of Business
Albert Nii Noi Okwei, Graduate Assistant
- The Current Business Confidence Index for the end of 2024 is 69%, right in line with the expectations at the beginning of the year.
- The Forecast Business Confidence Index for 2025 is 73%, showing an increase in confidence for the coming year.
- Employment is expected to grow by 1.0% to 1.6% in 2025, showing a small increase in growth compared to 2024.
- Overall nominal sales are expected to increase by 3.1% to 3.6% for 2025, which is faster than growth in 2024.
- Wages are expected to increase by 3.0% to 3.4% for 2025 which is slower than the increases seen in 2024.
- Inflation is expected to stay at its current level of 2.5-3.0% for 2025.
- All indicators signal the West Michigan economy will be mixed but overall will grow slightly faster than 2024.
Introduction
The survey for the greater Grand Rapids economy (Kent, Ottawa, Muskegon, and Allegan counties or KOMA) was conducted in November and December 2024. A survey was mailed to the CEOs and business leaders of nearly 700 organizations based on a representative sample. We tried to ensure that the sample reflected different sectors of the regional economy and the geographical diversity of the area. Eventually, 75 organizations responded, resulting in a strong response rate of 11.0%. There is also a convenience sample survey administered through the Grand Rapids Chamber of Commerce, West Coast Chamber, Muskegon Chamber, and the Grand Haven Chamber members which yielded 414 responses. However, due to the possibility of a non-random response sample, the survey should be interpreted with caution. The survey was timed for the week after the elections to allow respondents time to digest some of the possible implications of the results.
A few methodological considerations are in order. Although we discuss the survey results in terms of averages, the data are represented in a histogram format to show the entire distribution of responses. The employment, sales, and export numbers are more volatile as raw averages (when calculated without adjusting for outliers—responses beyond one standard deviation). Since the average of a small sample is significantly influenced by extreme numbers, we use the averages without the outliers to provide more reliable results. The histograms, however, depict all the available observations to show the broader picture.
Confidence Index
The Confidence Index has been tracked by researchers at the Seidman College of Business since 1995. A continuing goal of the survey is to historically track the overall business confidence of the Grand Rapids area. The survey respondents use a scale from zero percent (no confidence at all) to one hundred percent (complete confidence) in response to the question: How confident are you in the regional economy? The average responses for the private sector and the government/non-profit sector over the past 29 years are shown in Figure 1.
Figure 1: West Michigan Confidence Index Forecast 1995-2025
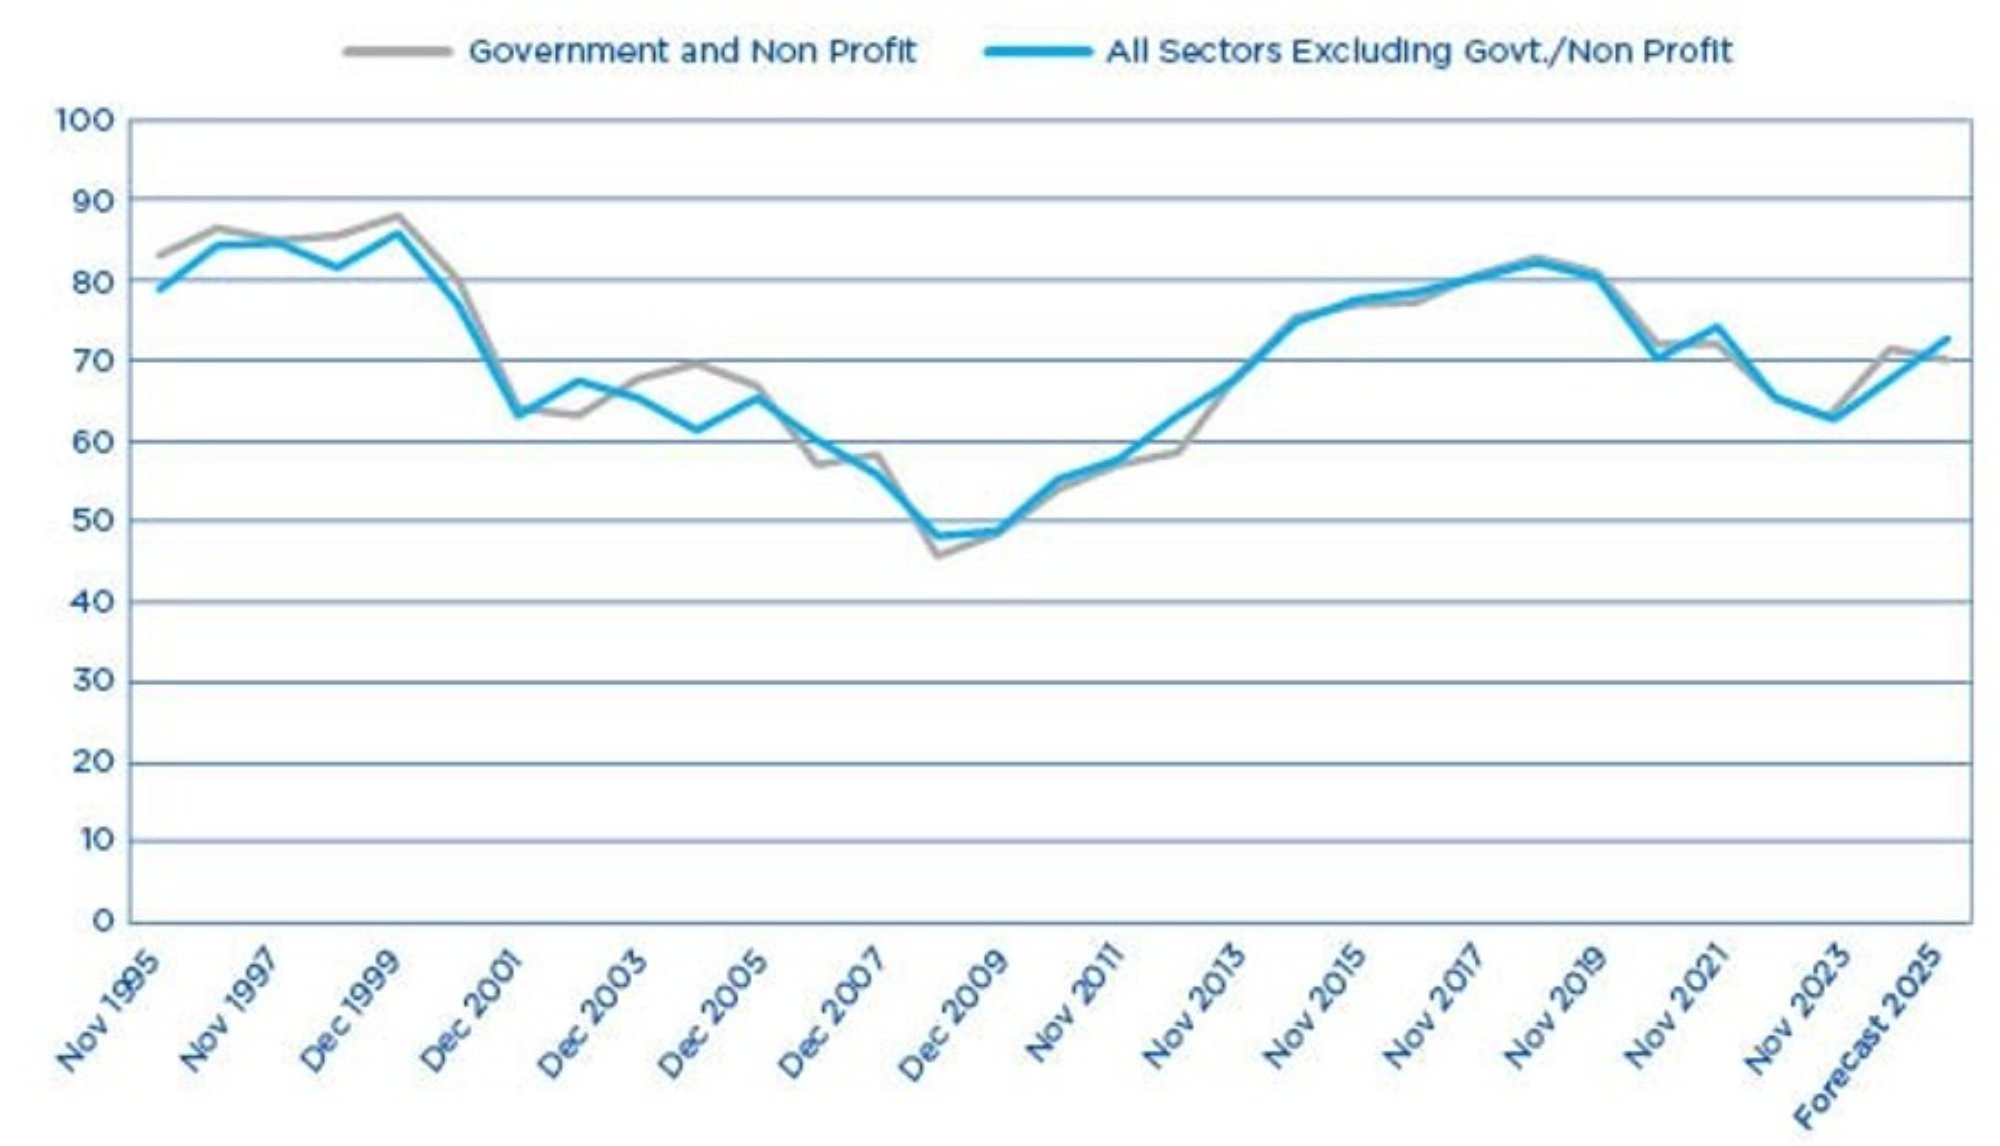
Description: The line graph depicts the West Michigan Confidence Index broken out by Government and Non-Profit and by All Sectors Excluding Government and Non-Profit responses. Data shown is from 1995 to the 2025 forecast.
Source: West Michigan Confidence Index Survey, administered in November and December, 2024
The Confidence Index overall did not change much. However, the confidence for the coming year for the private sector is expected to increase. However, the government and nonprofit sectors are exhibiting a drop from their high expectations in 2024 while still showing strong confidence. This is consistent with the improved sales tax revenue and strong property values, with possible headwinds being declining federal stimulus funds and a new president promising a level of austerity. The private sector is showing some reserved optimism for the coming year with the percent saying the political environment was affecting their business negatively moving from 70% last year to 36% in the coming year.
Employment
Last year employment for KOMA grew 0.5% between November 2023 and November 2024. This was one third the rate at which businesses wanted to hire. This was due to not enough applicants in the labor pool. The responses to the question: What percent change do you expect in employment for the four counties in 2025? are shown in Figure 2.
Figure 2: Employment Growth Outlook (2023-2025): Projected Workforce Expansion Trends
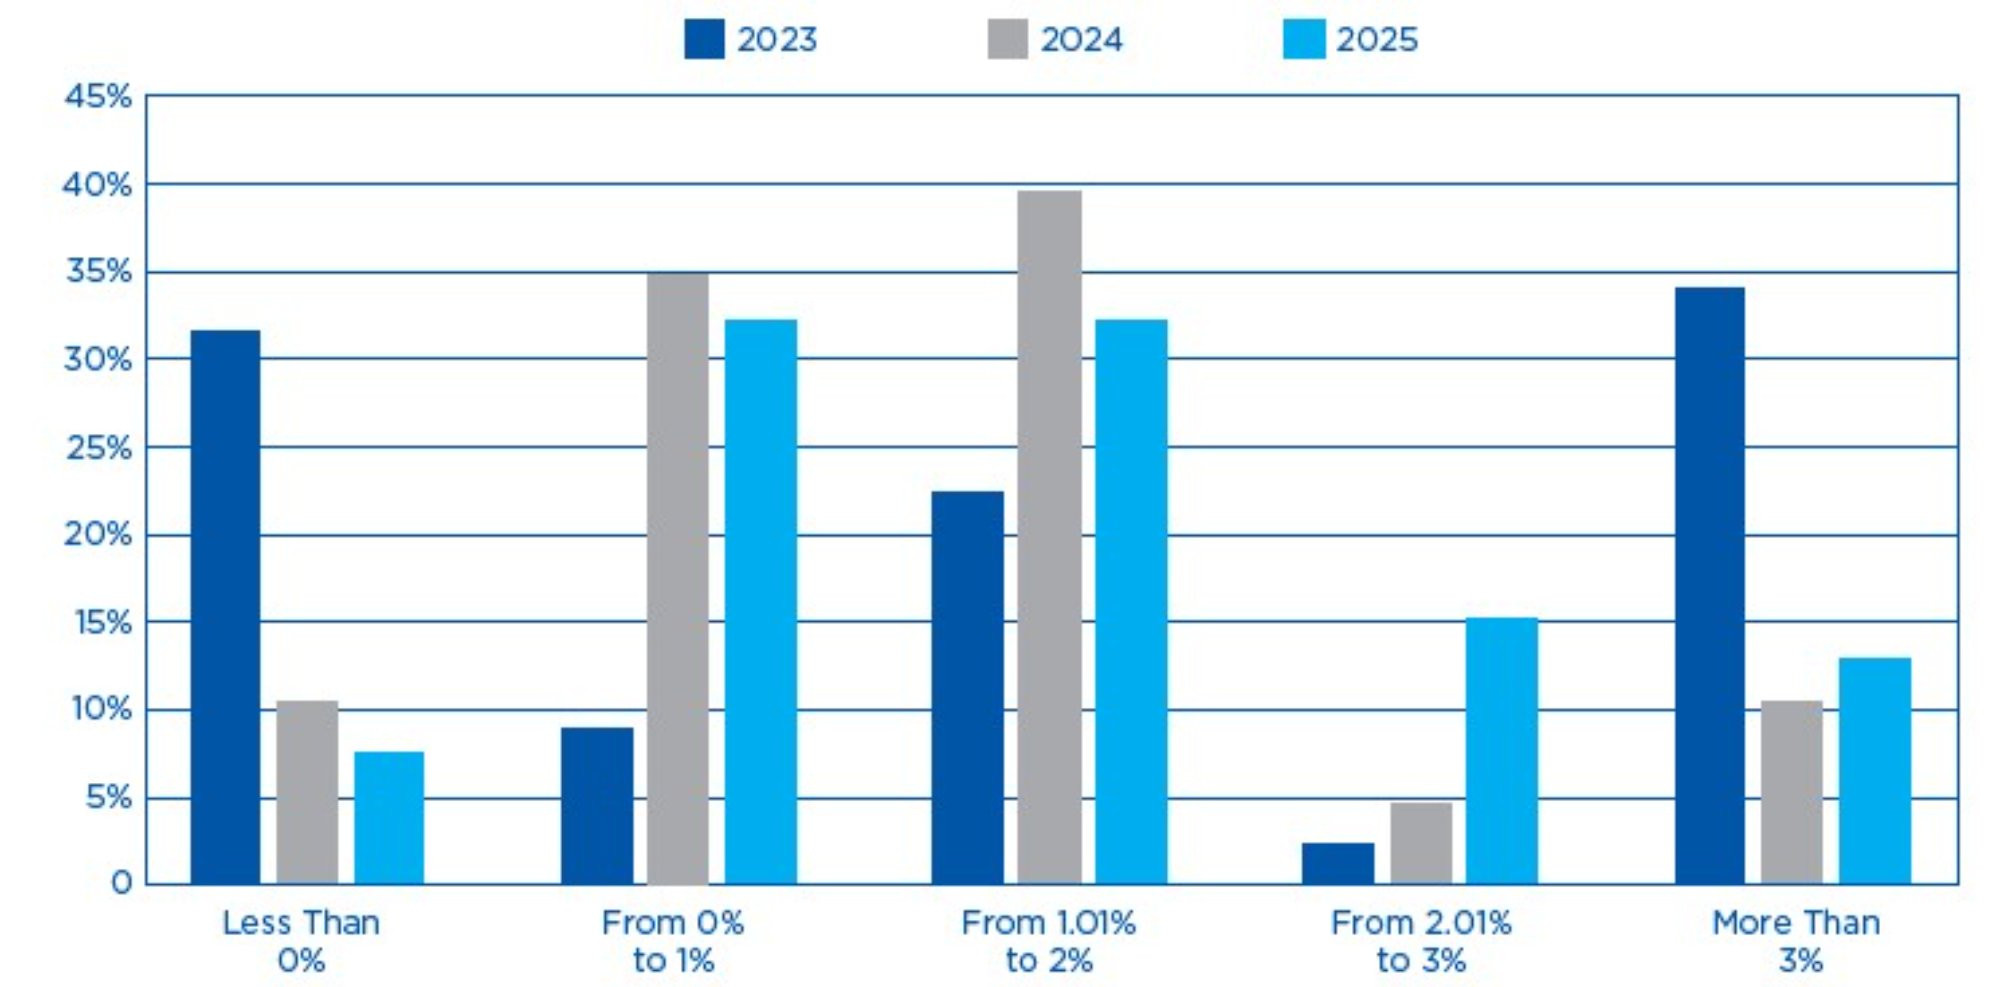
Description: The bar chart shows the percentage of survey respondents by their projected change in employment for the years 2023, 2024, and 2025.
Source: West Michigan Confidence Index Survey, administered in November and December, 2024
Average employment in the KOMA region during 2025 is expected to grow a little faster than last year at a 1.25% pace, provided there are enough people willing to work. The big change is that a few more respondents now expect to hire at a rate greater than 2% growth. Over 2025, 70% of firms are expecting employment growth between 0% and 2%. This is consistent with firms reaching a consensus on how fast employment growth will happen over the next year. Regarding wages, the average increase in wages is expected to continue to grow this year but at a much slower rate than the last two years. The increase will fall to 3.2% from an average increase of 3.6% in 2024 as shown in Figure 3. The wage growth has stabilized to increases that are more consistent with pre-COVID numbers with the most common expectation across all surveys of 3% in 2025. This wage growth differs across types of industries but is converging on close to the expected rate of inflation which is 2.7%.
Figure 3: Expected Wage Increases By Industry
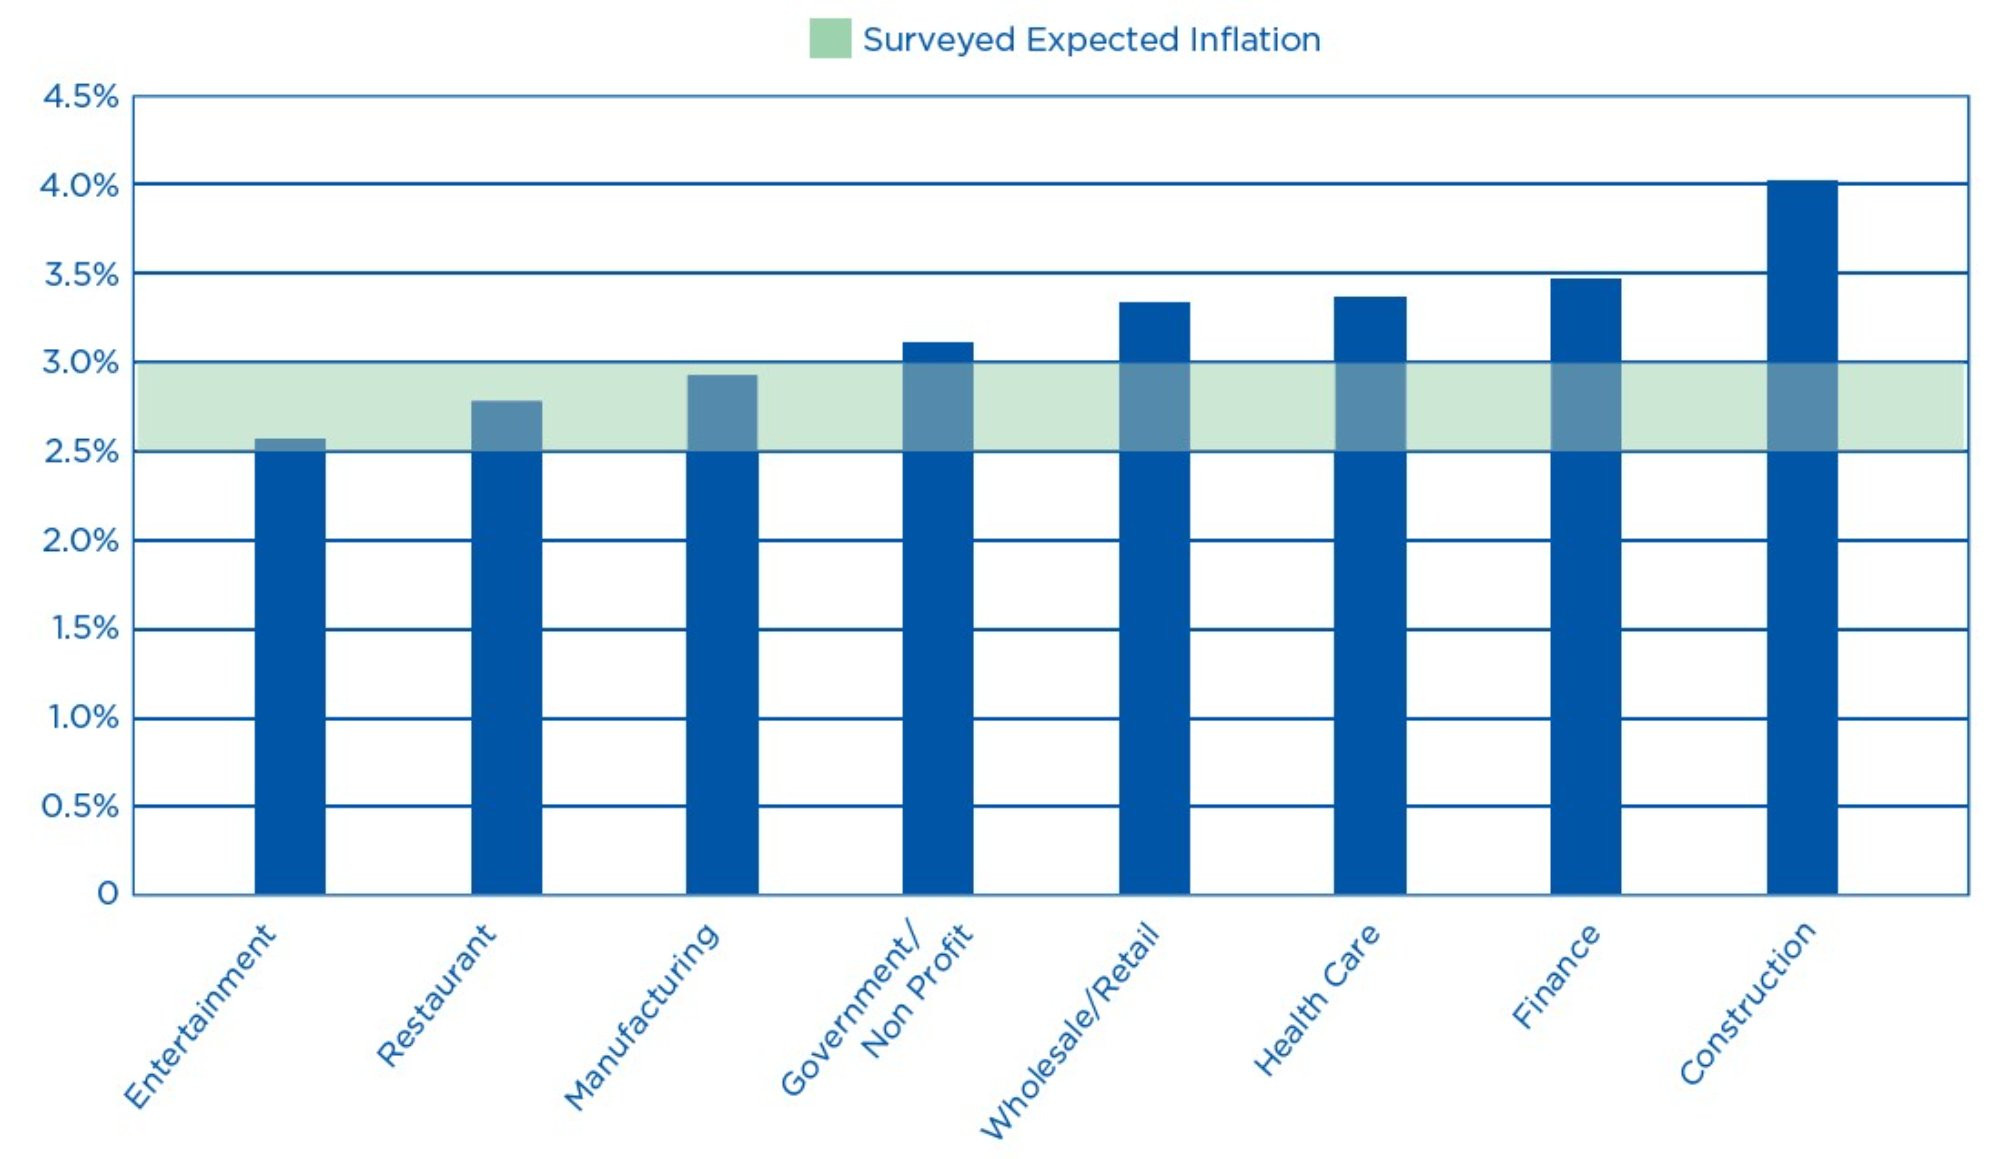
Description: The bar chart shows the expected wage increase by industry reported by Confidence Index survey respondents with the projected inflation rate range for 2025 of 2.5% to 3.0% overlaid horizontally on the chart.
Source: West Michigan Confidence Index Survey, administered in November and December, 2024
Sales
For sales, the respondents answer the following question: What percent change in sales do you project for the four counties in 2025? During the late 1990s, sales grew at an annual rate of 5%. During 2025 our respondents are expecting growth around 3.4% for the year up from the 2.5% last year as shown in Figure 4. This is an increase in sales expectations while at the same time the firms are reporting a slowdown in employment growth. This means that firms are expecting a speedup in productivity for their workers over the year. The major change in expectations for 2025 compared to last year is that the percentage of firms expecting sales growth below 2% has decreased to 32% from 49%. Firms are expecting to grow, with 85% of firms expecting to grow more than 1%.
Figure 4: Projected Sales Growth (2023-2025) Trends and Year-over-Year Comparisons
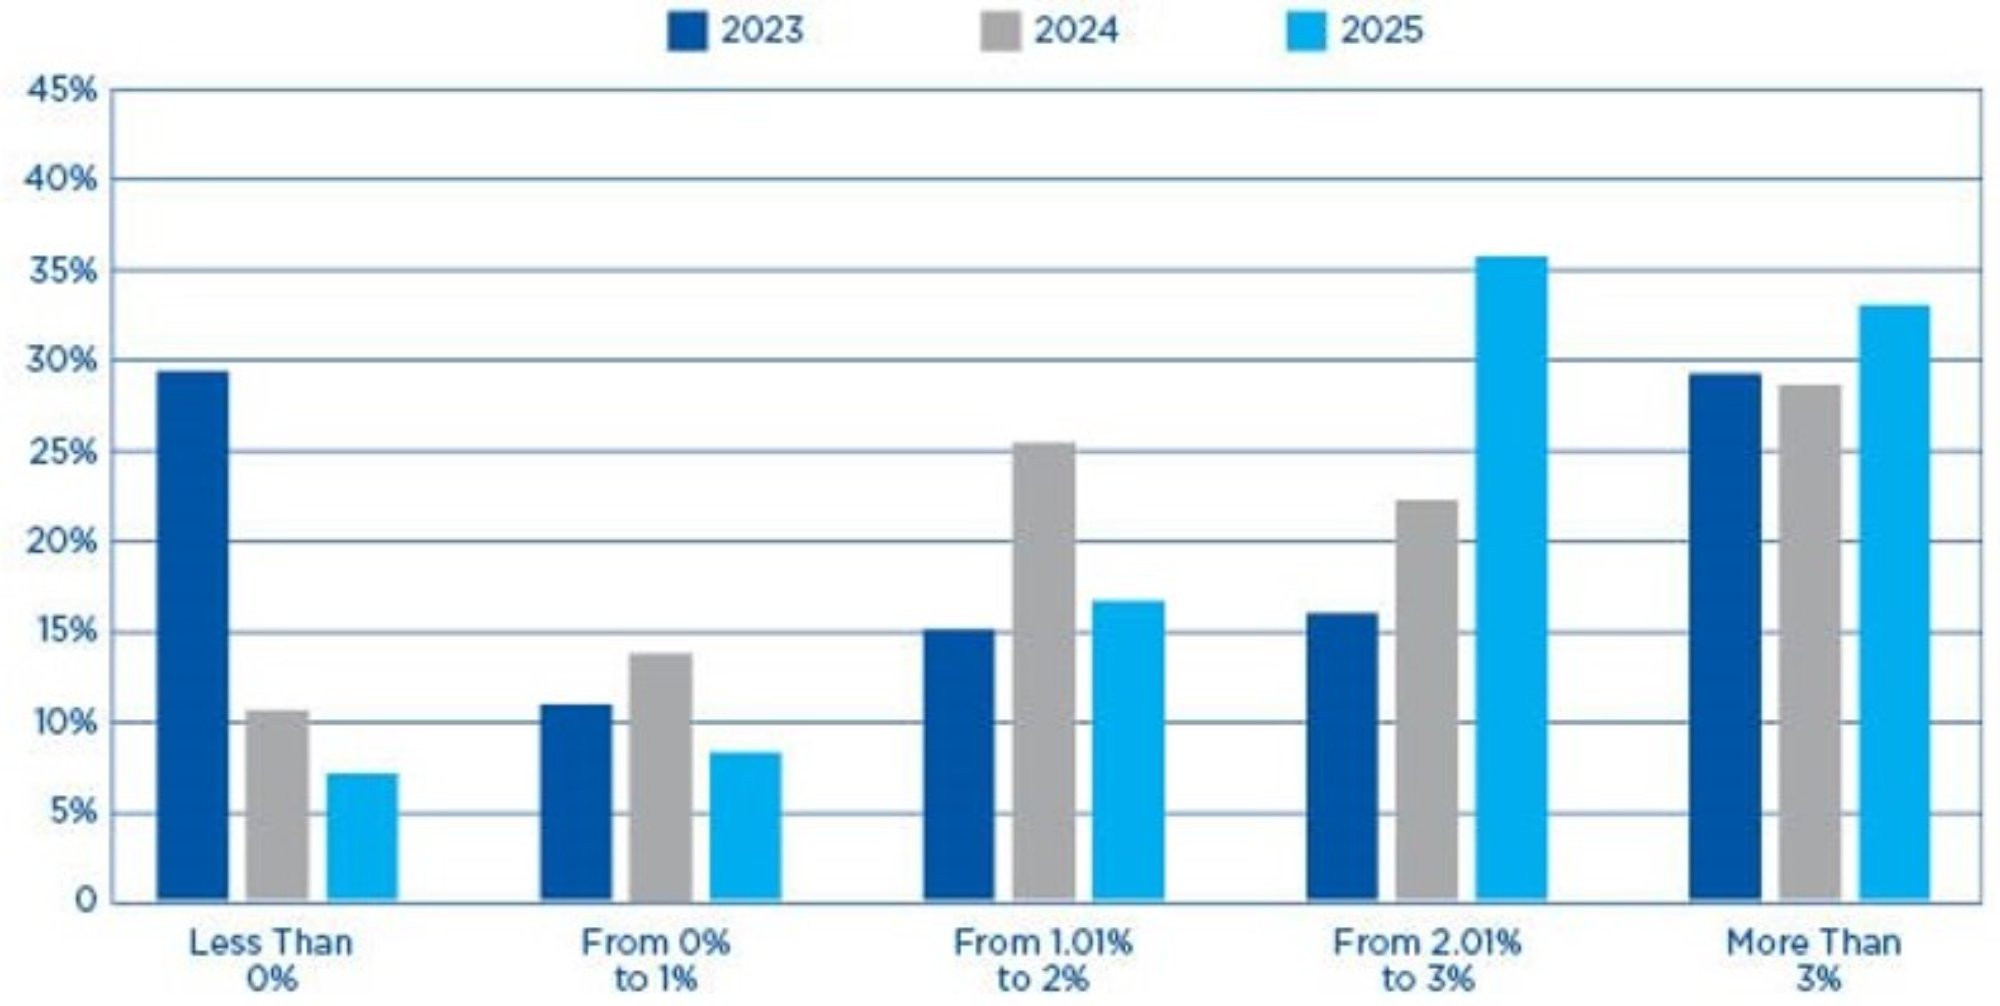
Description: The bar chart shows the expected sales growth for 2023, 2024, and 2025 by percent responding at different levels of growth as reported by Confidence Index survey respondents.
Source: West Michigan Confidence Index Survey, administered in November and December, 2024
General Outlook
The data for West Michigan shows a small increase in employment growth for 2025 compared to prior year. However, sales are expected to grow faster than last year. The continuing concern going into 2025 is that the excess savings for consumers has been used up, and now consumption is increasingly debt driven. This could lead to a slowdown if consumers start to pull back on spending to a more sustainable level. In addition, there is uncertainty surrounding expectations on tariffs, immigration, minimum wage, and sick time leaves causing businesses to hold off on many decisions until later in 2025.
Acknowledgments
We are very grateful to all the organizations that participated in the 2025 Confidence Index Survey.