A Closer Look at the Grandville Corridor
By Christopher John Cruz, Ph.D., Assistant Professor, Department of Economics
Michael DeWilde, MTS, Director, Koeze Business Ethics Initiative
Andrea Zorrilla, Student Research and Translation Assistant
In 2016, Seidman Business Review published a piece of DeWilde’s on the role of social capital in helping to make Grand Rapids the city it is. Following the Harvard sociologist Robert Putnam and the social psychologist Jonathan Haidt, DeWilde (2016) presented social capital as referring to “social connectedness, to the social ties among individuals and the norms of reciprocity and trustworthiness that arise from those ties” and highlighted its important role in determining the well-being of individuals and communities.
In that study, Grand Rapids came out looking very good, especially in comparison to some of the cities around the country that at various points in time were perceived as much more vibrant and promising than Grand Rapids. Grand Rapids had, and continues to have, denser social capital ties than most comparably-sized cities, a stronger, more consistent philanthropic community, and healthier community institutions, including schools, universities, churches and temples, city government, and hospitals. Those ties produce higher levels of trust among individuals, businesses and institutions than the contractual agreements that are the norm elsewhere, and Grand Rapids has relied on strong social capital to thrive both economically and culturally in ways that has gained it national recognition for its many successes.
However, like most American cities, the success of Grand Rapids (its wealth, opportunities, infrastructure, access to institutions, etc.) is not shared to the same degree across its various neighborhoods. We intend to shed light on this issue by studying different neighborhoods in the city. We first focus on the Grandville Corridor to examine how a predominantly minority neighborhood is linked to the rest of the city and to determine whether the role of social capital in the city manifests itself as well in this specific neighborhood. The Grandville Corridor, particularly the Roosevelt Park neighborhood, is an area deeply rooted in the immigrant experience. Dutch immigrants looking for a new life in the new world settled it first, followed by members of the Black community, many of whom continue to live and work there. But for many decades now, it has been dominated by those of Latino heritage, and they contribute significantly to the Corridor’s culture and its economic makeup. The Corridor is home to immigrants from Mexico, Puerto Rico, Venezuela, Columbia, Cuba and a host of other Latin American countries, leading to the development of a unique cultural hub within Grand Rapids.
For this study, we conducted interviews with four focus groups, all with the help of the Hispanic Center of West Michigan. We also spoke with a handful of local leaders in the Grandville Corridor, people who have spent a considerable amount of time dedicated to making life there better for residents through a variety of services. Altogether, we had a chance to speak at length with 52 residents and leaders. One of our key findings from our discussions with various groups in the community is that they do not feel particularly connected to “downtown” – understood as the center of power politically, economically, and culturally. As part of our previous study which concluded in 2016, we paid casual visits to the Grandville Corridor. One of our takeaways at the time was that the Grandville Corridor residents do not feel like they belonged, in any meaningful sense, to Grand Rapids as a whole. At the time, we walked away having heard that the Grandville Corridor might well have been plopped down anywhere, just another urban island comprised largely of immigrants, held at arm’s length from downtown. Part of the irony of this was that at least some of the success of downtown lay in taking advantage of the relatively cheap labor the Grandville Corridor provided, some documented and some not. Assimilation issues and economic exploitation among immigrants (and, to be fair, opportunity) is a story as old as America itself. It appears that these issues continue to plague the community up to this day.
While we are working on a longer article to present our detailed results, we present in this article the baseline research that we undertook using publicly available data to contextualize our research questions and findings. We use available disaggregated Census data to track how the Grandville Corridor has changed over time. In particular, we compare the decennial data for 2020 with Census data from 2013, when we started studying the community. We choose to present data for 2020 as it is the most recent available data which are not particularly affected by Covid issues. While the analysis can be done at the census tract or at the block group level, we opted for block group aggregation, the lowest possible level of geographic analysis, because it provides the most accurate representation of the Grandville Corridor area. More specifically, we combined information from block groups (BG) 1 and 3 from census tract (CT) 26 as well as block groups 1 and 2 from census tract 39 (Figure 1).[1]
Figure 1: Grandville Corridor Map
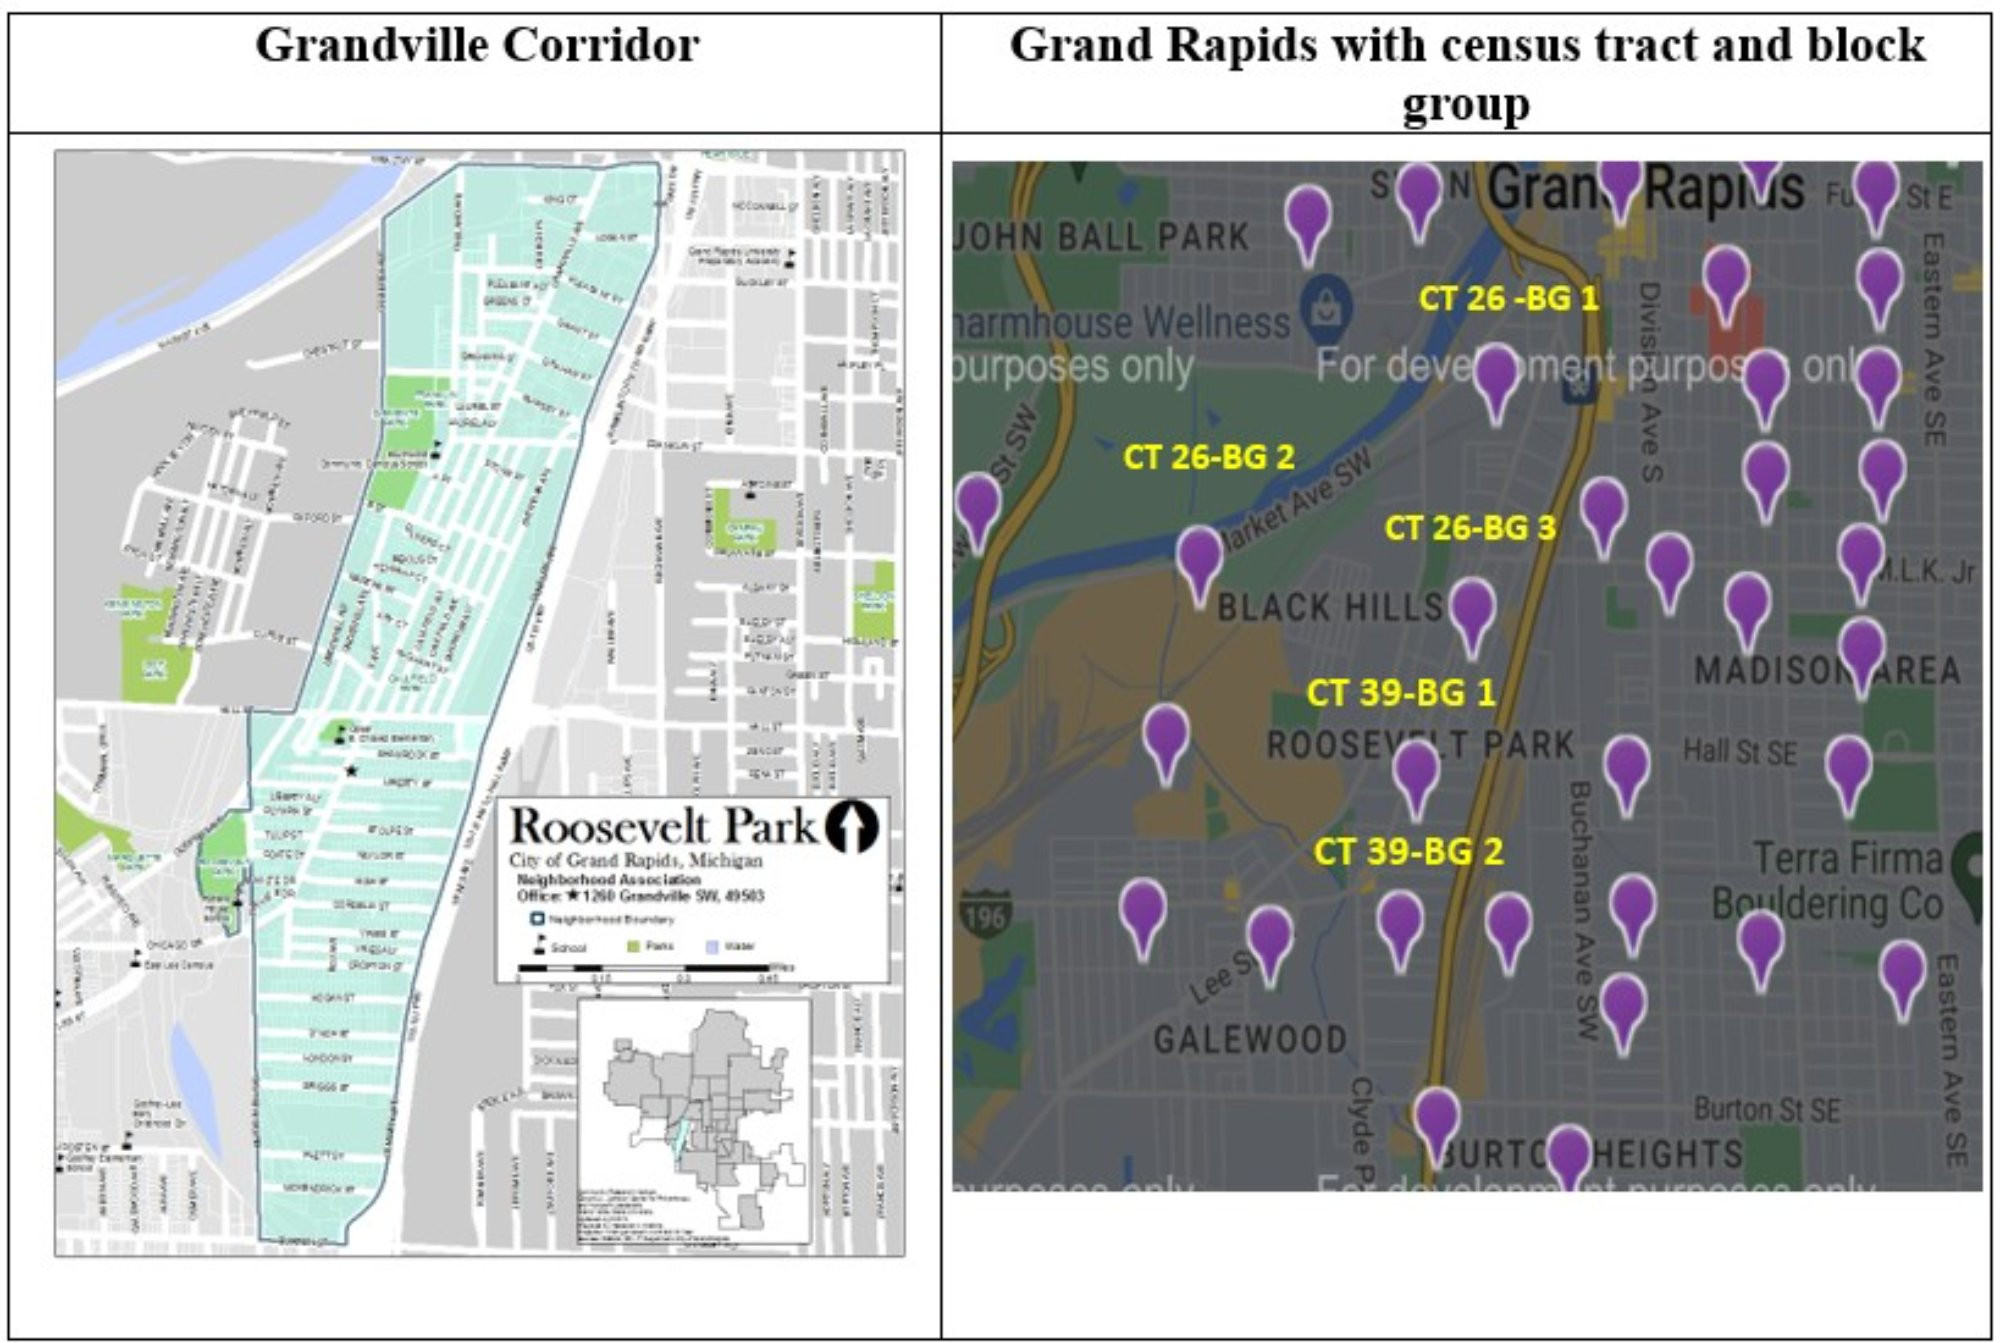
Description: The left panel of Figure 1 shows the geographical demarcation of the Grandville Corridor as published by local news website woodtv.com, while the right panel shows the relevant census tracts and block groups as defined by the Census Bureau. The statistical information for the Grandville Corridor is an aggregation of data from block groups 1 and 3 of census tract 26 and block groups 1 and 2 of census tract 39. It may be noted that each marker in the right panel represents a block group from a specific census tract in the City of Grand Rapids.
Sources: https://www.woodtv.com/news/grand-rapids-rolls-out-plan-to-revamp-grandville-avenue-corridor/ (left panel); http://www.usa.com/MI0810039001.html (right panel); US Census Bureau (for basic information on census tracts and block groups)
The demographic characteristics of the residents of the Grandville Corridor have changed in the last decade. Compared to 2013, the population of the Grandville Corridor grew by 8 percent to reach 6,156 in 2020 (Table 1). This increase is slightly higher than the population growth rate of the Grand Rapids metro area at 7 percent. Nonetheless, the area remains a small portion (about 0.6 percent) of greater Grand Rapids. The population growth in the Grandville Corridor is driven by women, with the population of prime working-age women expanding by 8 percent and their male counterparts shrinking by about 14 percent.
Table 1: Grandville Corridor Key Economic Indicators
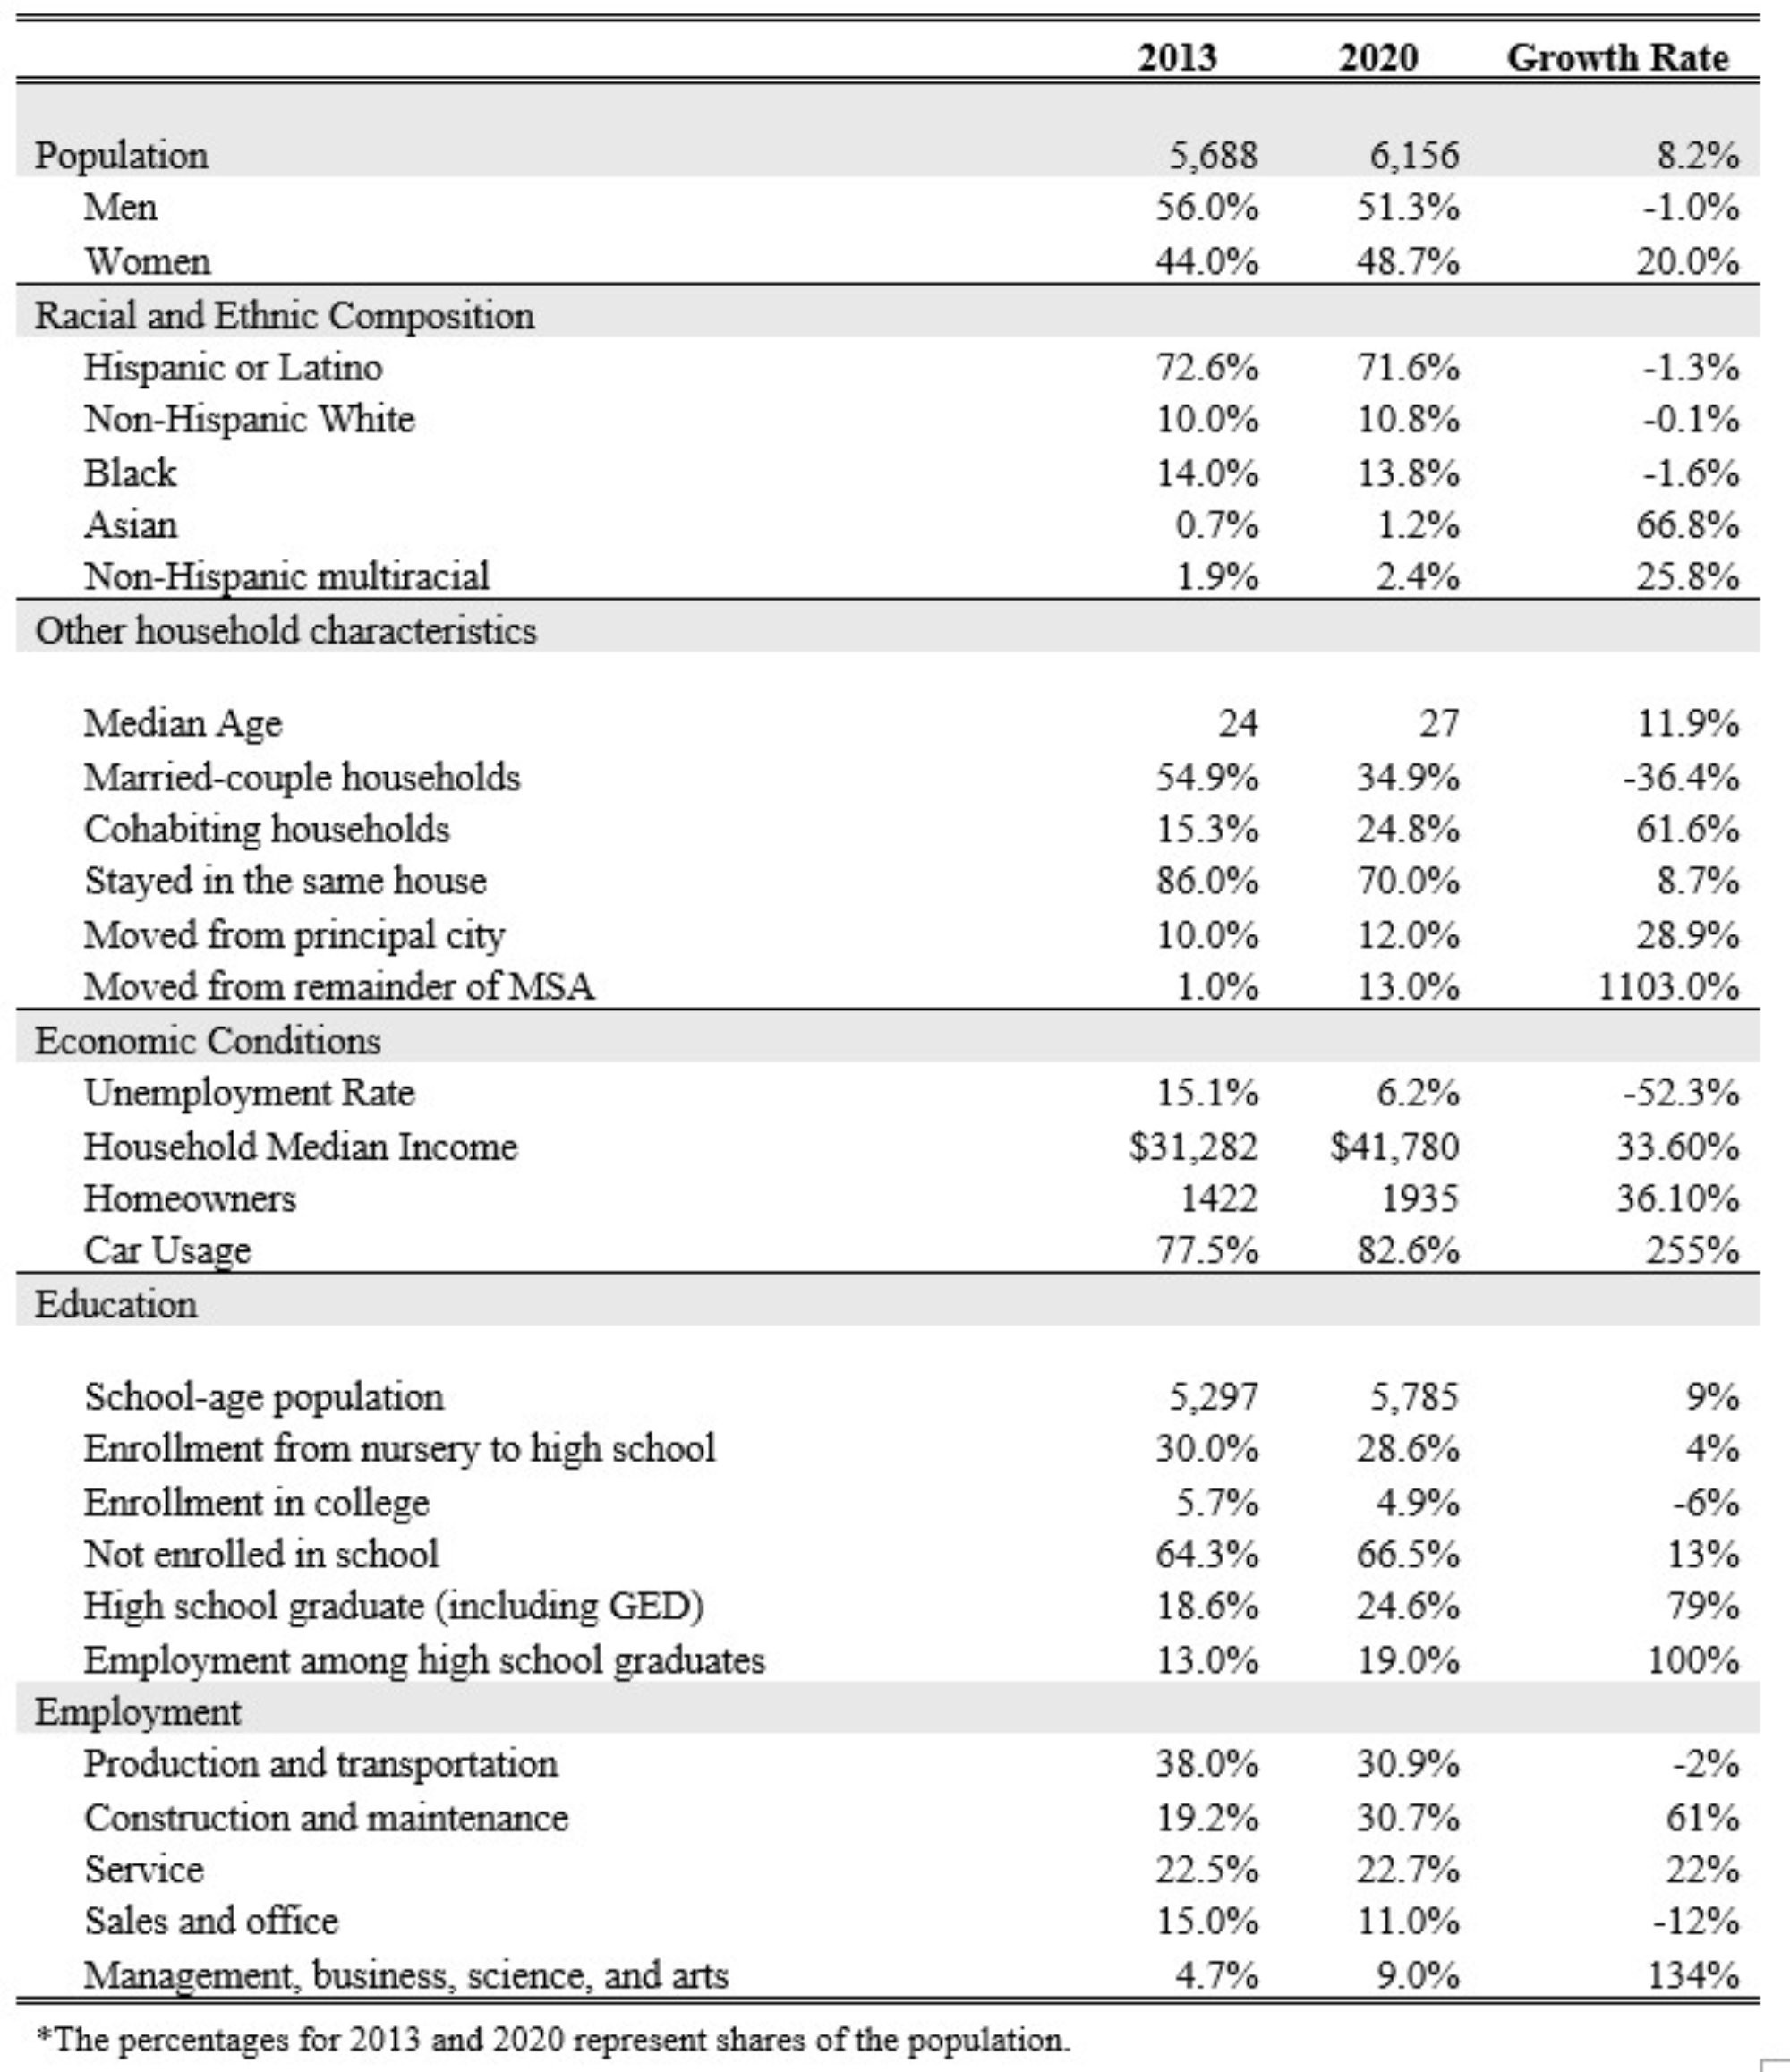
Description: Table 1 shows the demographic and socio-economic characteristics of the residents of the Grandville Corridor. Unless indicated otherwise, the numbers in the first two columns represent the population share of the different groups in the Grandville Corridor based on various socio-economic characteristics in 2013 and 2020, respectively. The third column represents the percent change of the data from 2013 to 2020.
Source: Authors’ calculation; source of basic information - US Census Bureau
The racial and ethnic composition of the area has also changed slightly. Although the Grandville Corridor remains predominantly Hispanic (a little over 70 percent of the population), their population declined slightly due mainly to white Hispanics, while the number of non-white Hispanics and other minorities rose in the area. Specifically, the group identifying as multiracial, whether they identify as Hispanic or not, has increased in the Corridor. Meanwhile, the median age in the area rose from 24 to 27 as seen across most racial groups. The multiracial individuals flocking into the area appear to be college-age individuals. Consistent with national trends, the share of married-couple households in the Grandville Corridor has declined in favor of cohabiting or single-headed households, with 1-3 person households remaining most typical.
Economic conditions have significantly improved in the Grandville Corridor since 2013. The unemployment rate in the area is down from 15 percent in 2013 to only 6 percent in 2020, which is even lower than the unemployment rate in the greater Grand Rapids area at 7.5 percent. Moreover, annual median income in the corridor went up by more than 30 percent to reach $42,000 in 2020. Alongside this, is the significant increase in the number of households rising above the poverty threshold. More people seem to be on track to achieving the American dream with homeownership and car usage soaring in 2020 from their 2013 levels. Nonetheless, it is crucial to note that median income in the Corridor is only about 63 percent of that in the greater Grand Rapids area at over $66,000, suggesting that households in the Corridor continue to be some of the most financially challenged in the city.
In terms of education, more school-age kids are able to go to school but non-enrollment, particularly in college, remains a major issue in the area. While the school age-population in the Corridor rose by about 9 percent, school enrollment for elementary and high school grew by only 4 percent. Meanwhile, college enrollment among the residents of the Corridor fell significantly, especially among women. Hispanic and white residents appear to be the biggest drivers of this decline. The track that many people seem to take is to complete high school or get a GED, then go to work. Production, construction, and transportation-related jobs remain the major occupation in the area. However, more are getting into white-collar jobs in business and education, as well as healthcare (especially women).
With respect to household mobility, a majority of people in the Grandville Corridor stay within the community, while more people are moving in from other areas of Grand Rapids or neighboring cities. Based on our discussion with the residents of the Grandville Corridor, younger immigrants or first-generation residents express being stuck in the middle of two cultures. Over 80 percent do not identity wholly with, or are identified with, either the culture of their parents on one hand, or “American Culture” on the other. They are in a classic liminal space between two worlds, not feeling fully accepted in either. Their bonding social capital, with family and friends, does provide emotional support, but it also feels constraining to them (there is pressure to “stay in the Corridor for everyone’s sake”) in ways that they fear will retard their success. Most thought of themselves as chasing the American Dream, grateful to their parents and neighbors, but with an eye on more affluent neighborhoods like East Grand Rapids. The statistic on household mobility seems to suggest that for many of the residents of the Grandville Corridor, the American Dream remains quite elusive.
Notes
[1] It may be noted that block group 2 under census tract 26 mainly refers to the Black Hills area of Grand Rapids, which is outside of the Grandville Corridor area.
References
DeWilde, M. (2016). Social capital, economic diversity, and civic well-being in Flint and Grand Rapids. Seidman Business Review, 22(1), https://www.gvsu.edu/seidman/seidman-business-review-59.htm
Haidt, J. (2013). The righteous mind: Why good people are divided by politics and religion. Vintage.
Putnam, R. (2001). Bowling alone. Simon & Schuster.