Lackluster Prospects for Michigan’s Exports
By Gerry Simons, Ph.D., Professor, Department of Economics
In its October 2023 update to its World Economic Outlook, the International Monetary Fund (IMF) wrote “The global economy is limping along, not sprinting…global growth will slow from 3.5% in 2022 to 3% this year and 2.9% next year” (International Monetary Fund, 2023, p. xiii), further noting that this is significantly below the recent historical average of 3.8%. In addition, this 2.9% growth prediction is 0.1% point below what it had predicted just three months earlier. The gloom in the IMF report continues with “Economic activity still falls short of its pre-pandemic path…forecasts for global growth over the medium term, at 3.1%, are at their lowest in decades, and prospects for countries to catch up to higher living standards are weak” (International Monetary Fund, 2023, p. xvi).
What might this predicted mediocre growth in the global economy mean for Michigan and West Michigan exports?
The International Trade Administration (ITA) in the U.S. Department of Commerce provides data on annual exports of goods from each state as a whole and from 380 metropolitan statistical areas (MSAs) around the country, including the Grand Rapids-Kentwood MSA (which covers Ionia, Kent, Montcalm, and Ottawa counties). For this Grand Rapids-Kentwood MSA, exports total approximately $580 million in 2022. This amounts to about 8.5% of the MSA’s GDP of approximately $69 billion.
Unfortunately, although the ITA’s database gives detailed destination information for each state’s exports, it does not indicate each MSA’s exports by specific destination country, but rather only by groups of countries. Figure 1 shows the destination for Michigan’s exports and for the Grand Rapids-Kentwood MSA’s exports by percentage for Canada and Mexico combined (labeled USMCA in the database; a reference to the United States–Mexico–Canada Agreement), Asia, and the European Union (EU). It should come as no surprise that Canada and Mexico together make up the largest export destination for both Michigan and the MSA, amounting to 63% of Michigan’s exports and 48% of the MSA’s exports. While Canada and Mexico are the U.S.’s largest and second-largest export markets respectively, together they account for only 33% of total exports nationally. Naturally, the auto industry explains the outsized role that these two countries play in Michigan’s export pattern. With the auto industry being a smaller part of the West Michigan economy than for the state, this would also explain why trade with Canada and Mexico have smaller export shares for the MSA than for Michigan as a whole.
Figure 1: Exports by Destination, 2022
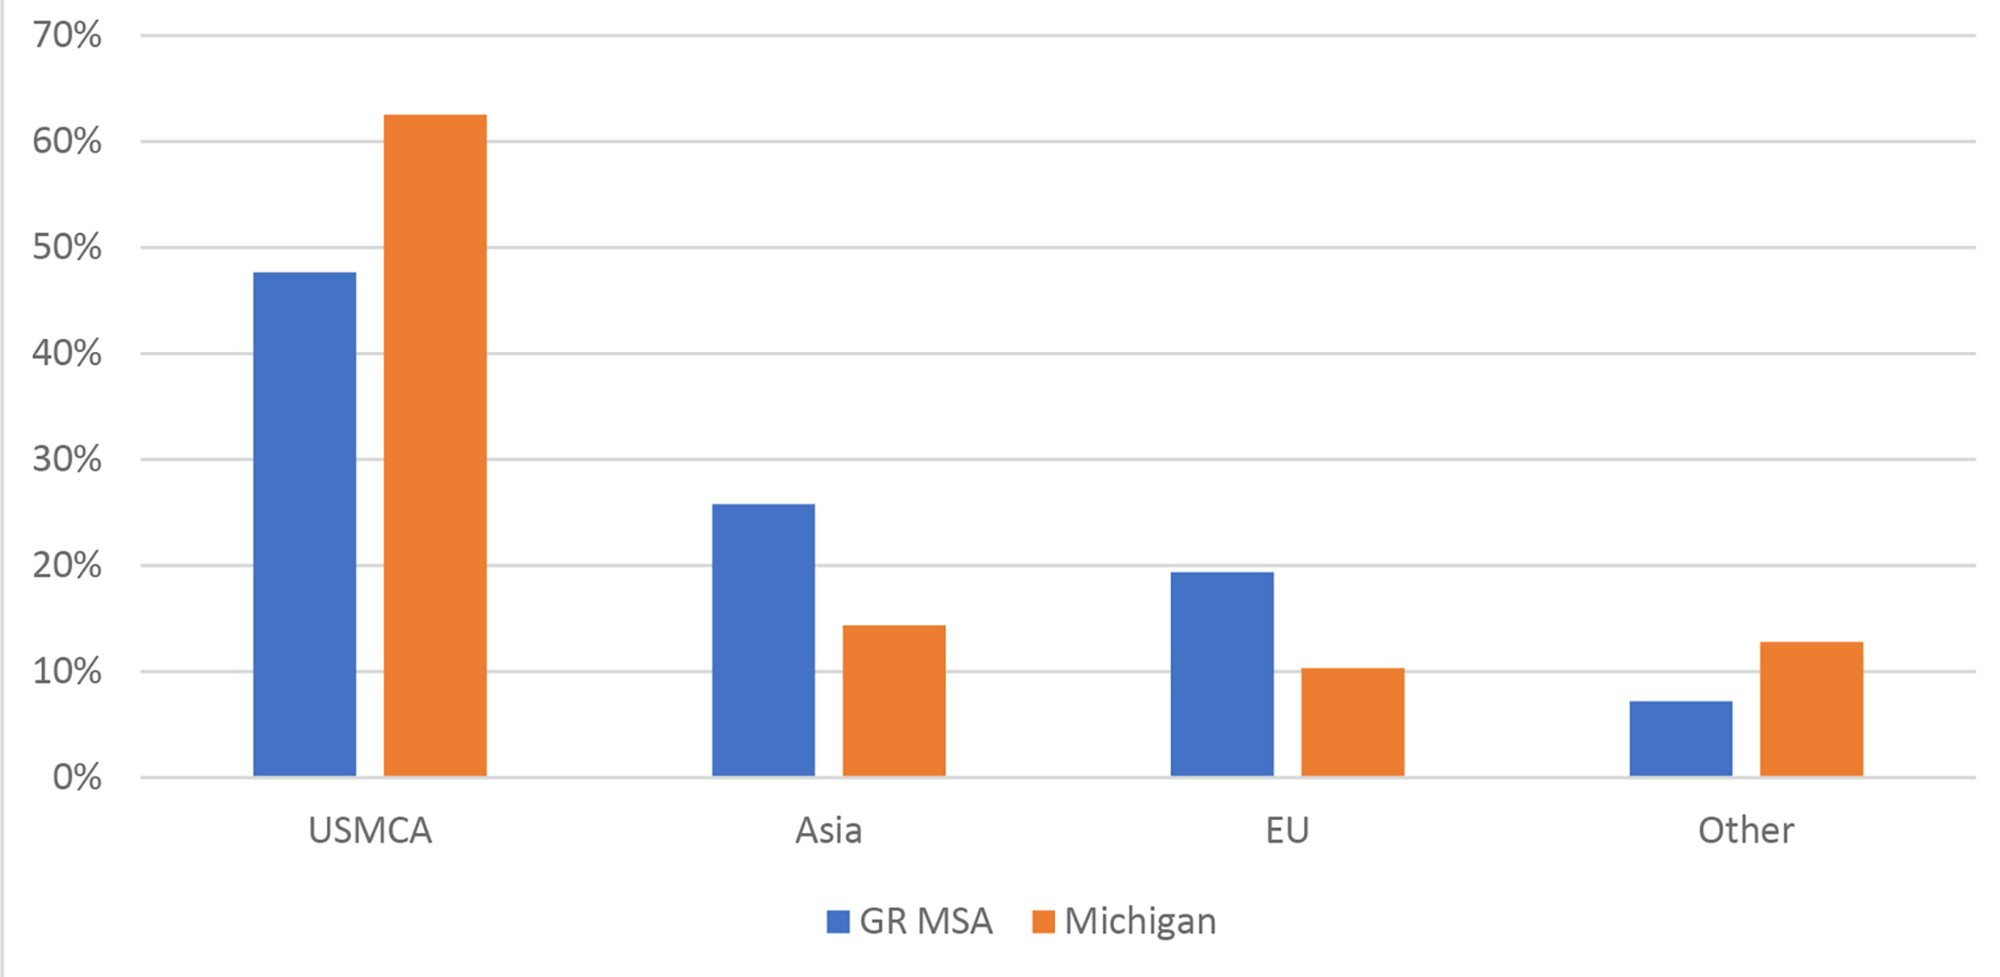
Image Description: The Exports by Destination graph shows that 48% of Grand Rapids MSA exports are to Canada and Mexico combined, 26% are to Asia, and 19% are to the E.U. For the state of Michigan as a whole, 63% of exports are to Canada and Mexico combined, 14% are to Asia, and 10% are to the E.U.
Source: International Trade Administration
The ITA database also groups each MSA’s exports by sector. The five largest sectors for exports from the Grand Rapids-Kentwood MSA are shown in Figure 2. These five sectors account for $3.4 billion worth of goods and makeup 59% of the MSA’s total exports. Nonmetallic mineral products (gravel, cement, etc.) is the largest sector, accounting for 18% of the MSA’s exports.
Figure 2: Grand Rapids-Kentwood MSA Top 5 Export Sectors, 2022
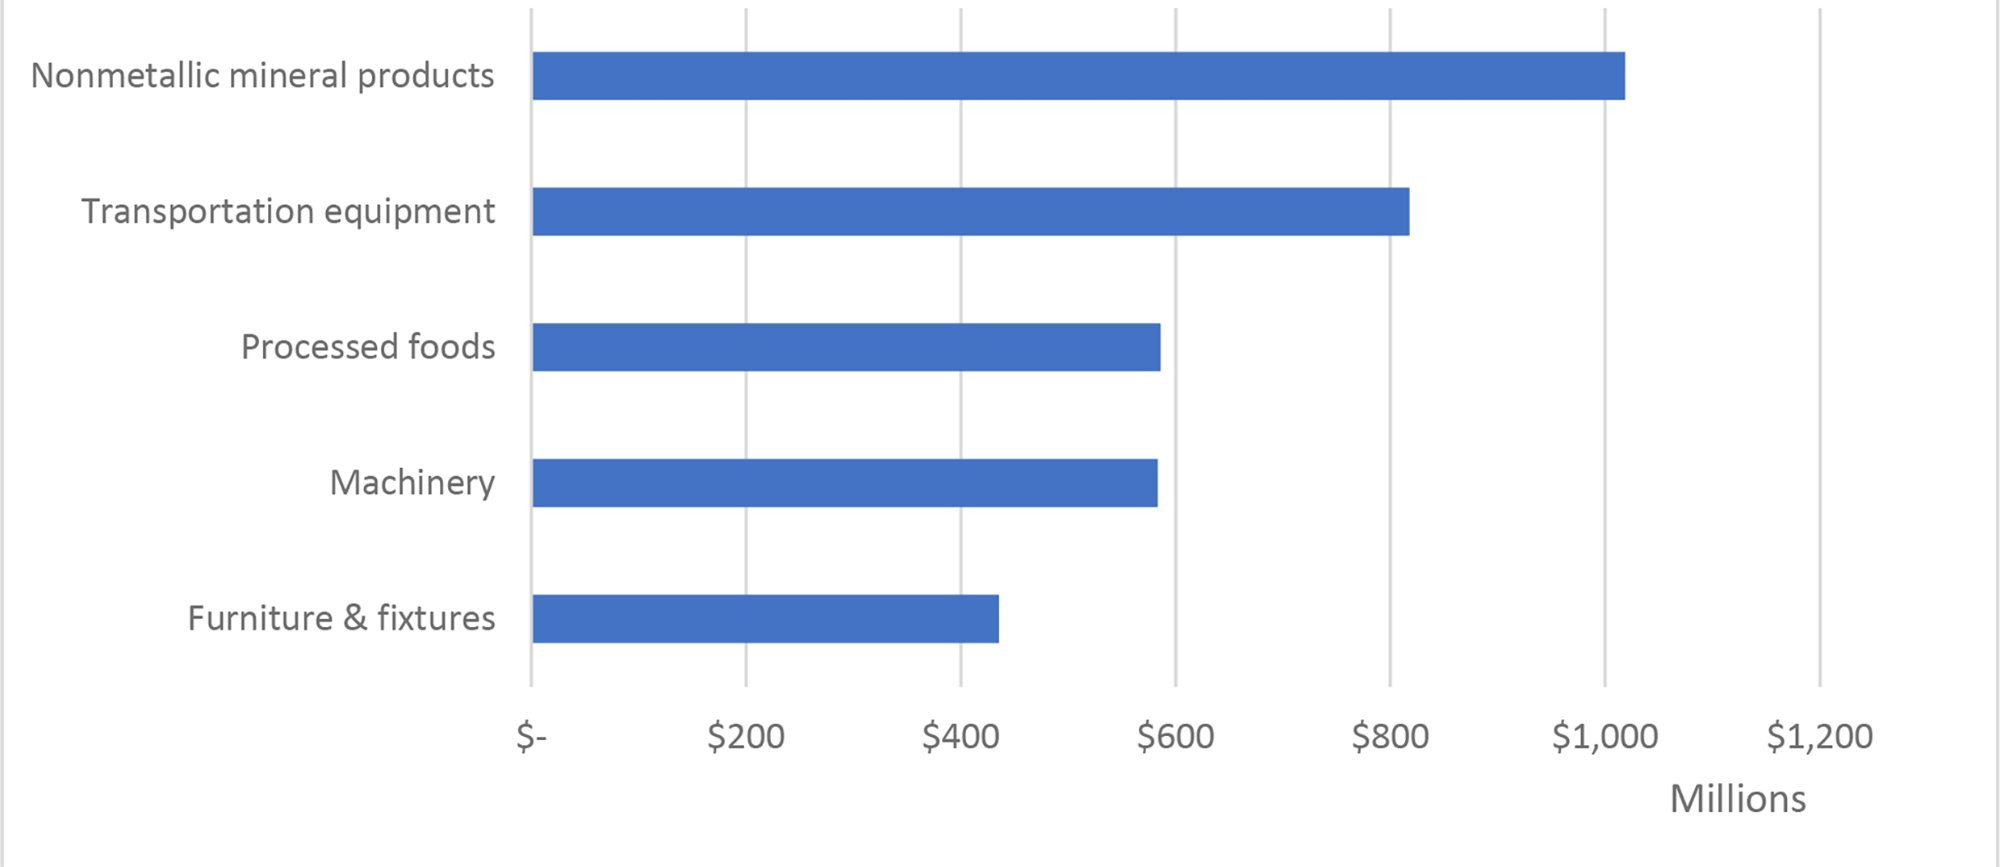
Image Description: The Grand Rapids-Kentwood MSA Top 5 Export Sectors 2022 graph shows exports of about $1 billion for nonmetallic mineral products, $818 million for transportation equipment, $586 million for processed food, $583 million for machinery, and $435 million for furniture and fixtures.
Source: International Trade Administration
Figure 3 shows the top five export sectors for Michigan. Unsurprisingly, transportation equipment is the largest sector, accounting for almost $28 billion, 45% of the state's total exports.
Figure 3: Michigan Top 5 Export Sectors, 2022
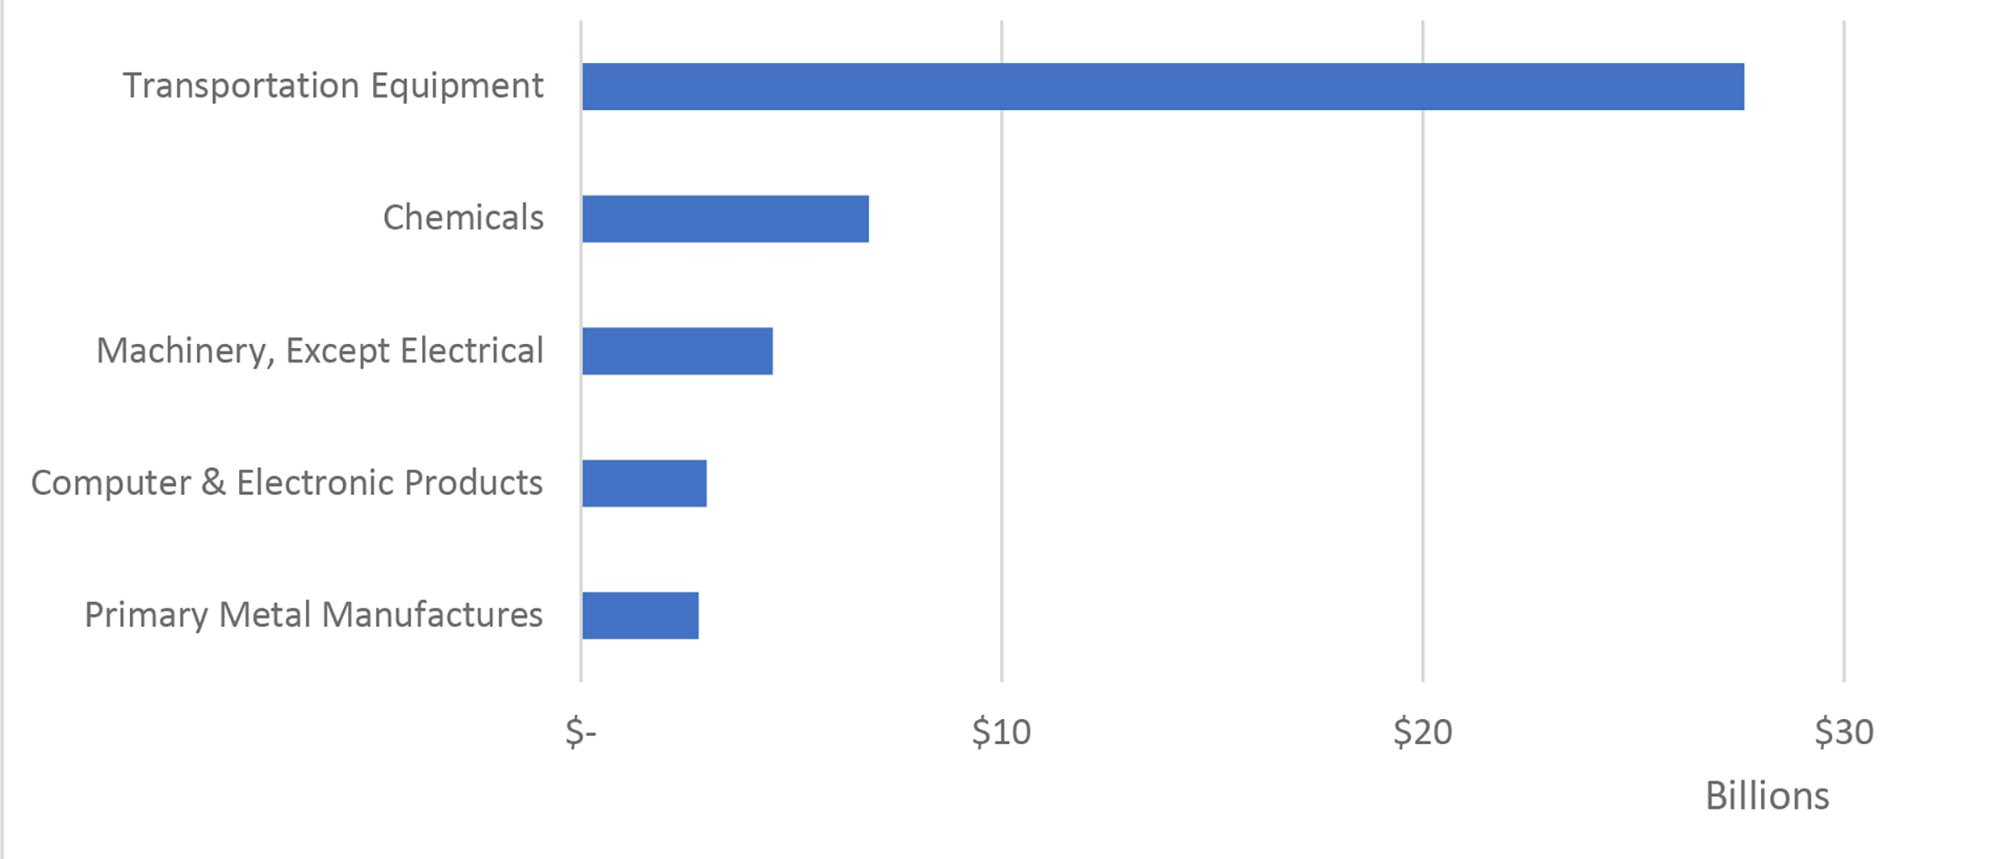
Image Description: The Michigan Top 5 Export Sectors 2022 graph shows exports of about $27.6 billion for transportation equipment, $6.9 billion for chemicals, $4.6 billion for machinery (except electrical), $3 billion for computer and electronic products, and $2.8 billion for primary metal manufactures.
Source: International Trade Administration
The regional export MSA data for West Michigan does not pair nicely with the country-specific information contained in the IMF World Economic Outlook, so to analyze the impact of the IMF’s forecasts we need to stay with state-wide data instead.
Table 1 shows Michigan’s top 10 export markets, which together accounted for 81% of the state’s $61.4 billion in exports in 2022.
Table 1: Michigan's Top 10 Export Markets, 2022
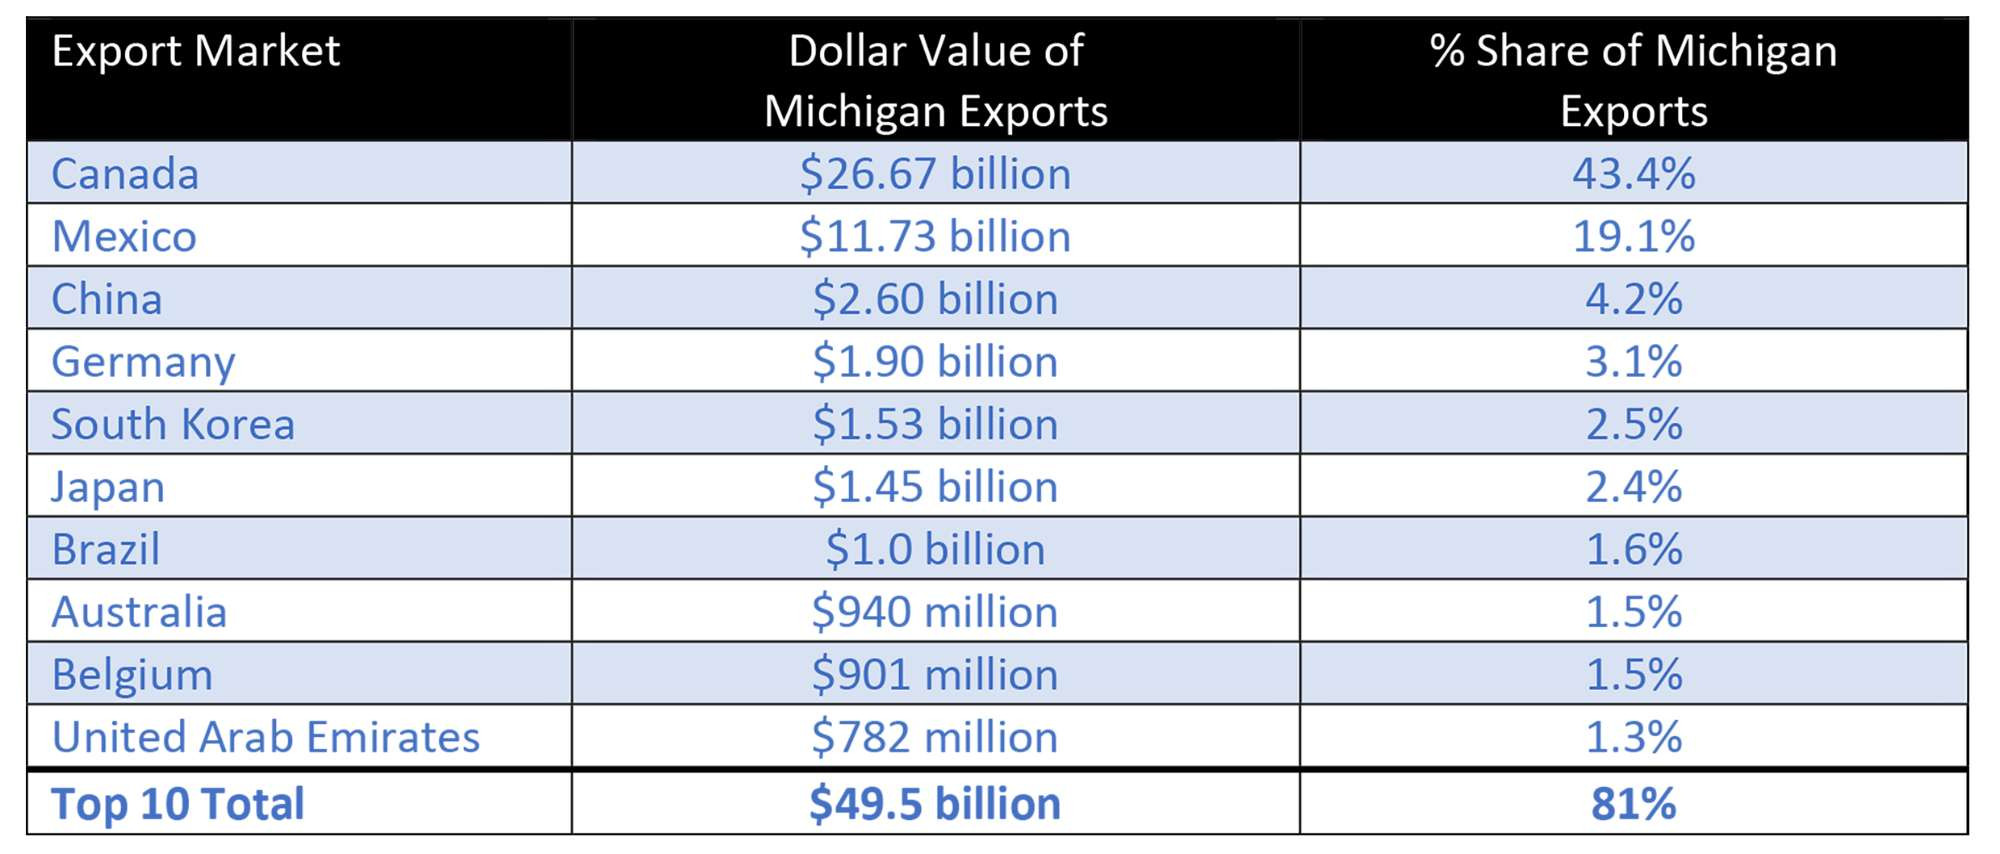
Table Description: Table 1 provides the dollar value of Michigan exports by country for the top 10 export markets in 2022 as well as the percent share of Michigan exports for each country.
Source: International Trade Administration.
Table 2 presents some of the IMF’s estimates for the countries listed in Table 1 from its October 2023 World Economic Outlook. So, for example, the IMF estimates that, for the two-year period of 2023-2024, the quantity of Canada’s imports will increase by 1.7% and inflation over that time will be 4.9%.
Table 2: IMF Estimates
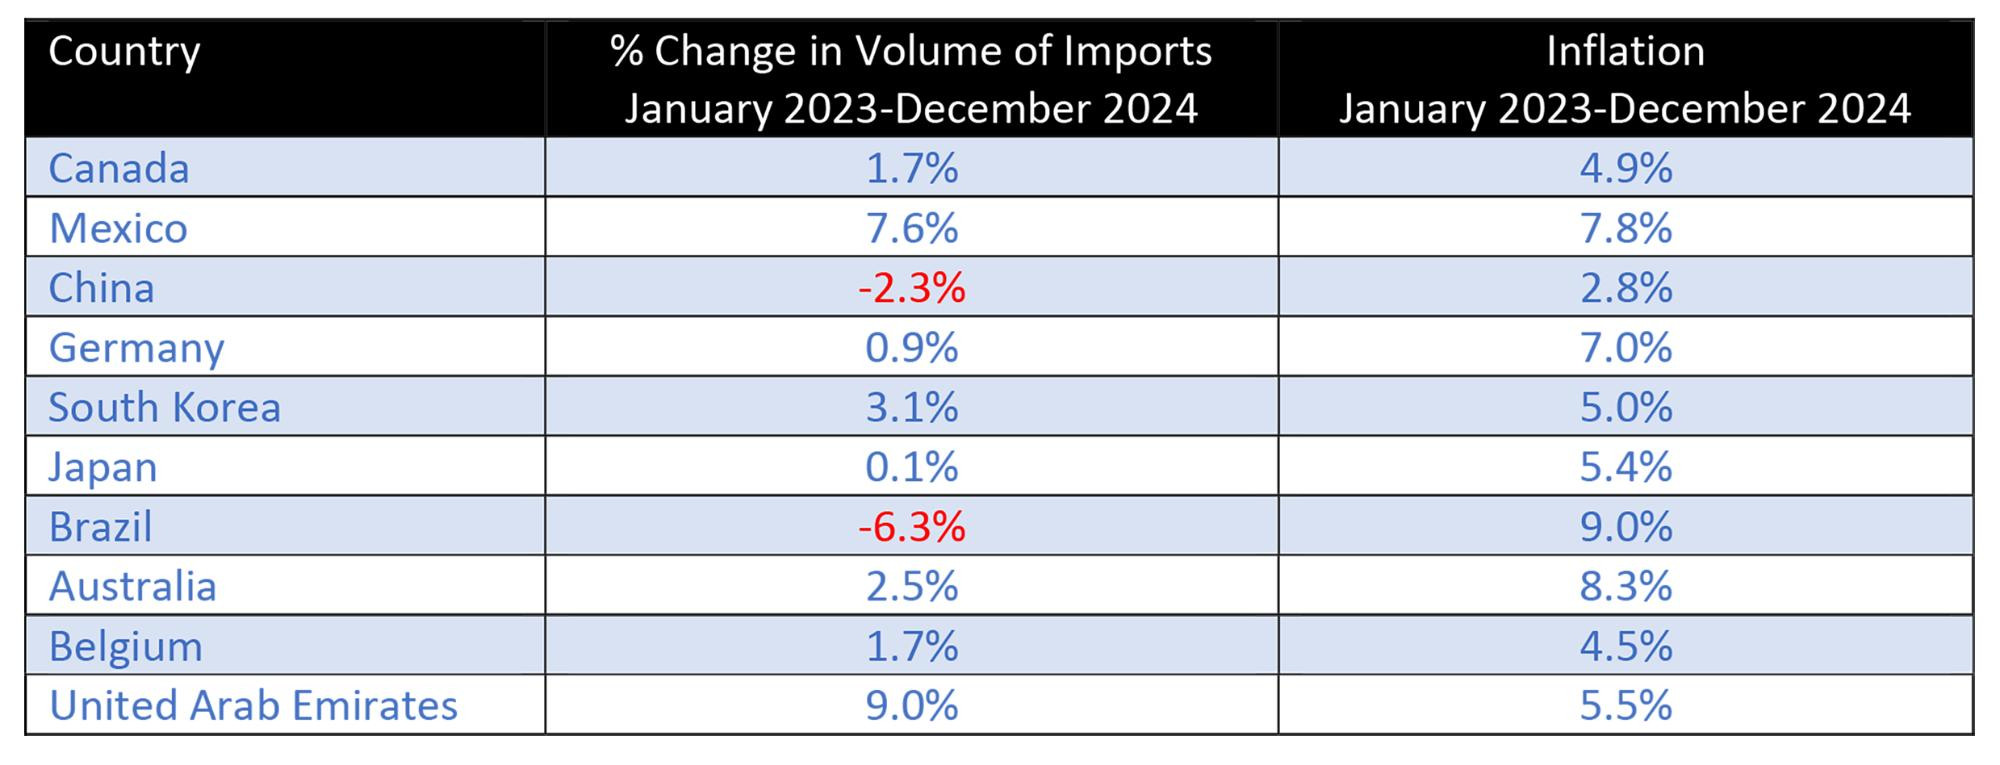
Table Description: Table 2 provides the estimated percent change in volume of exports for the two years of 2023-2024 for the countries shown in Table 1 as well as estimated inflation in each country over that same time period.
Source: International Monetary Fund (2023)
To extrapolate from the IMF estimates given in Table 2 to the impact on Michigan’s exports to these countries requires us to make an additional assumption – that not only are these estimates valid, but that they apply to the specific products that these countries import from Michigan. For example, we need to assume that the predicted 3.1% increase in South Korea’s overall imports implies that South Korea’s imports from Michigan will also increase by 3.1% in 2024. Of course, this exact duplication of the growth in imports is unlikely to be the case, but in the absence of more detailed predictions on specific import sectors, it at least gives us an idea of the possible impact.
Using the IMF estimates in Table 2 and applying them to the 2022 export data in Table 1, we can see what might happen to Michigan’s exports to its top 10 markets. As shown in Table 3, these estimates indicate that the dollar value of Michigan’s exports to Brazil will increase by $22 million from January 2023-December 2024, but that when adjusted for Brazil’s expected inflation of 9% as shown in Table 2, the “real” value of these exports represents a decrease of $62 million.
Table 3: Estimated Growth in Michigan’s Top 10 Export Markets, January 2023-December 2024
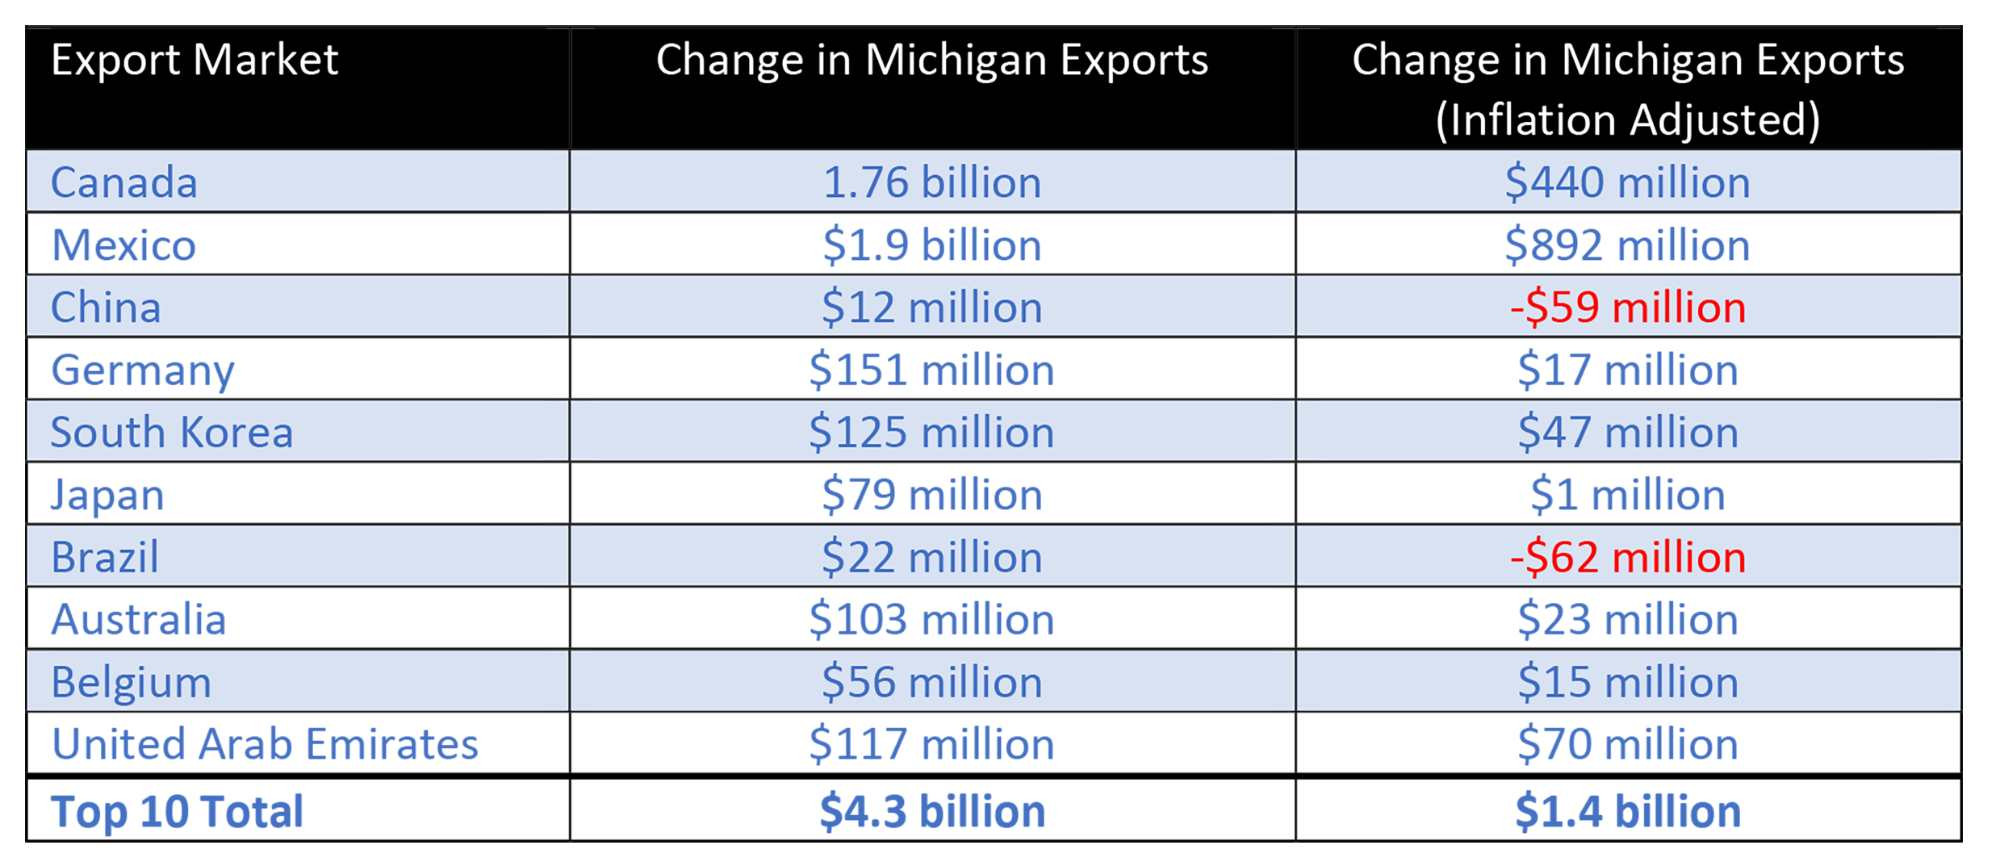
Table Description: Table 3 shows estimated growth from Jan 2023-Dec 2024 in Michigan exports to countries reflecting the top 10 export markets for the state as well as inflation-adjusted change estimates.
Source: International Monetary Fund (2023) and author’s calculations.
Using the IMF estimates means that the value of Michigan’s exports to these 10 markets combined will be 2.8% higher in inflation-adjusted terms compared to 2022, representing an increase in inflation-adjusted value of approximately $1.4 billion. Growth of 2.8% spread over two years is not particularly strong growth. Importantly though, most of this expected growth is coming from exports to Canada and Mexico. If we exclude these two markets, inflation-adjusted exports to the remaining eight countries in the top 10 list are expected to grow by only 0.47% from January 2023-December 2024. With Canada and Mexico making up a smaller share for West Michigan exports compared to the state’s exports, the generally gloomy predictions from the IMF do not bode well for those involved in international trade on the west side of the state.
References
International Monetary Fund. (2023). World Economic Outlook.
https://www.imf.org/en/Publications/WEO/Issues/2023/10/10/world-economic-outlook-october-2023

Gerry Simons, Ph.D., Professor, Department of Economics