Grand Rapids Housing Market – 2023 In Review
By Laudo M. Ogura, Ph.D., Associate Professor, Department of Economics
Paul Isely, Ph.D., Associate Dean, Seidman College of Business
In 2023, housing markets in the U.S. continued to face rising mortgage rates. At the national level, the high cost of financing has slowed down home sales by 20% in 2023 compared to 2022. Construction activity has also dropped from an annual rate of 1.6 million in 2022 to 1.4 million new private housing starts in 2023. Home prices, however, remained relatively stable at the national level. See Table 1 for details and data sources.
Table 1: Economic and Housing Market Conditions
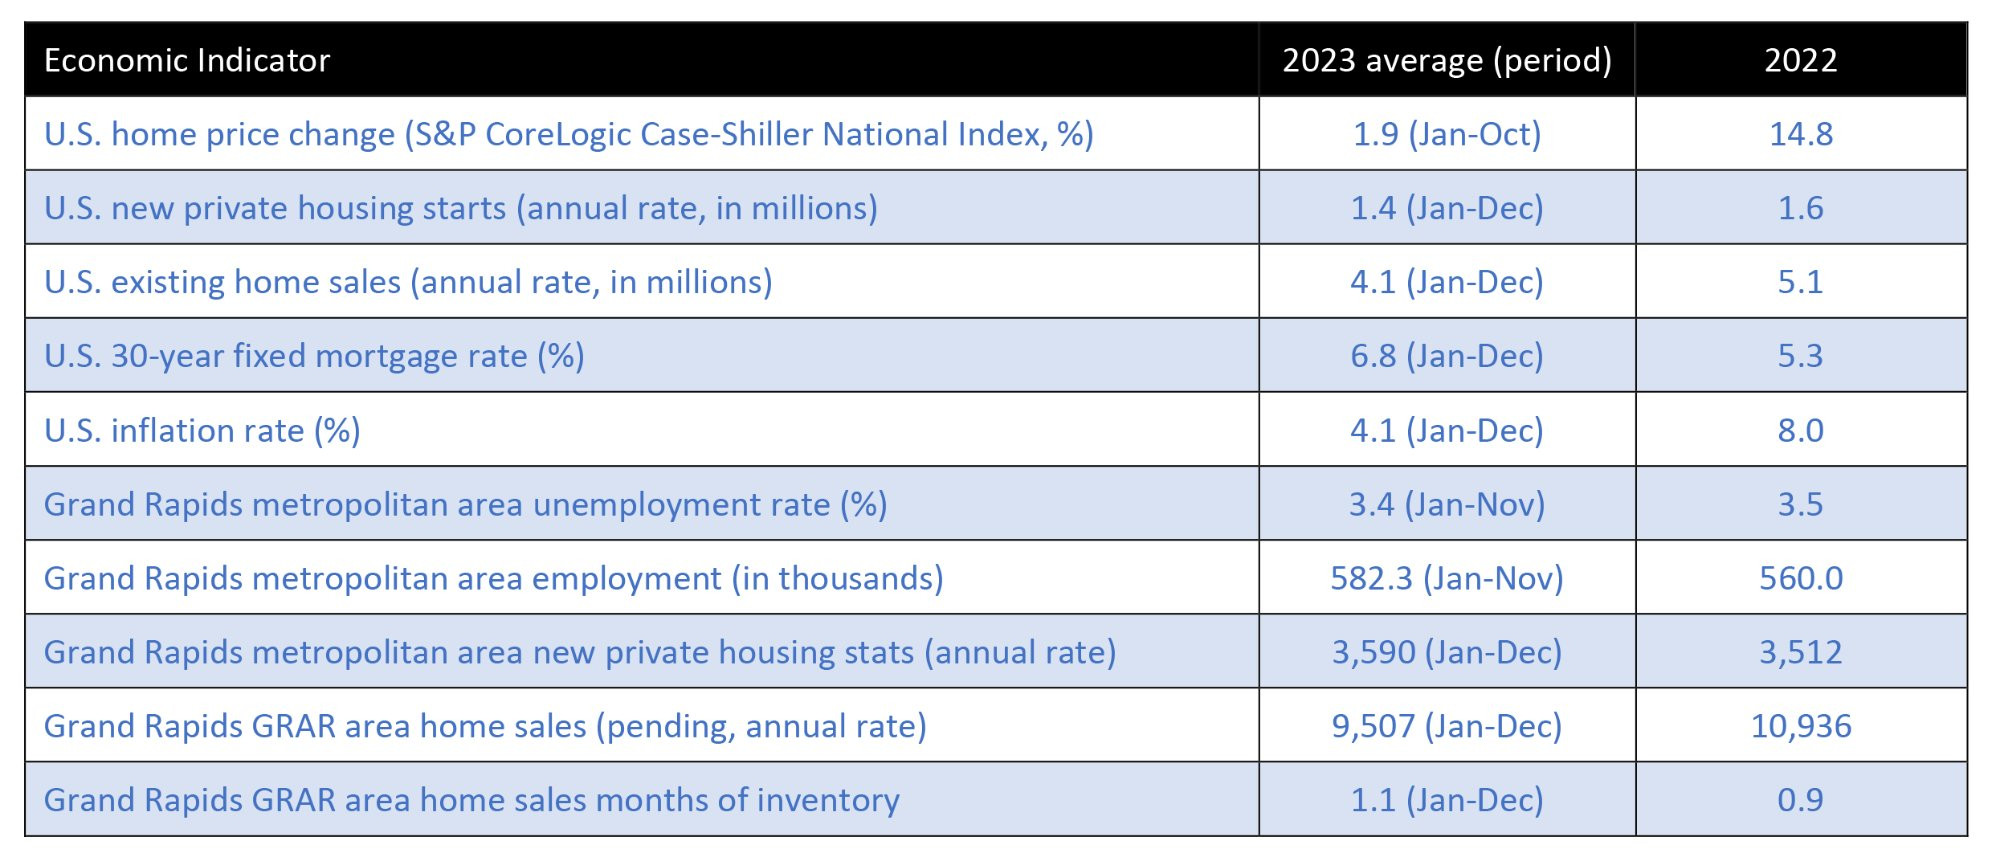
Notes: The Grand Rapids metropolitan area includes Kent, Ottawa, Barry, and Montcalm counties. The Grand Rapids Association of Realtors (GRAR) area includes Kent County, Ionia County, and parts of Ottawa, Barry, and Allegan counties.
Annual data represents the average rate for the year. For 2023, data may not have been available for the entire year (months available are noted in the table).
Table Description: The table shows how key economic and housing market indicators changed from 2022 to 2023. Despite inflation going down in the U.S. economy, mortgage rates have risen, leading to lower home sales and construction, and a smaller growth in home prices. In the Grand Rapids region, employment increased slightly, helping to keep the housing construction and the inventory of homes for sale little changed in 2023.
Sources: Greater Regional Alliance of Realtors (2024) and Federal Reserve Bank of St. Louis (2024).
For the Grand Rapids region, our price index estimations are presented in Figure 1. These estimates are based on the repeat-sales method, and the data is restricted to reflect typical non-distressed home sales (see Technical Notes at the end of the article for details). Our index for the City of Grand Rapids shows home prices rising by an average of 10% in 2023 following a 15% increase in 2022. In the northern and eastern municipalities of Kent County (East Grand Rapids, Grand Rapids Township, Cascade, and Plainfield), prices rose by 17% in 2023 following a 13% rise in the previous year1. The indexes are arbitrarily set to equal 100 in 2006 when local home prices peaked before the crash.
1 Note that the changes in housing prices estimated for 2022 were revised down compared to the numbers reported in last year’s version of this article as new data added allows for better accuracy – recent year estimates should be taken with caution due to the sensitivity of the estimates to data availability.
Figure 1: Housing Price Indexes (HPI) for the Grand Rapids Area
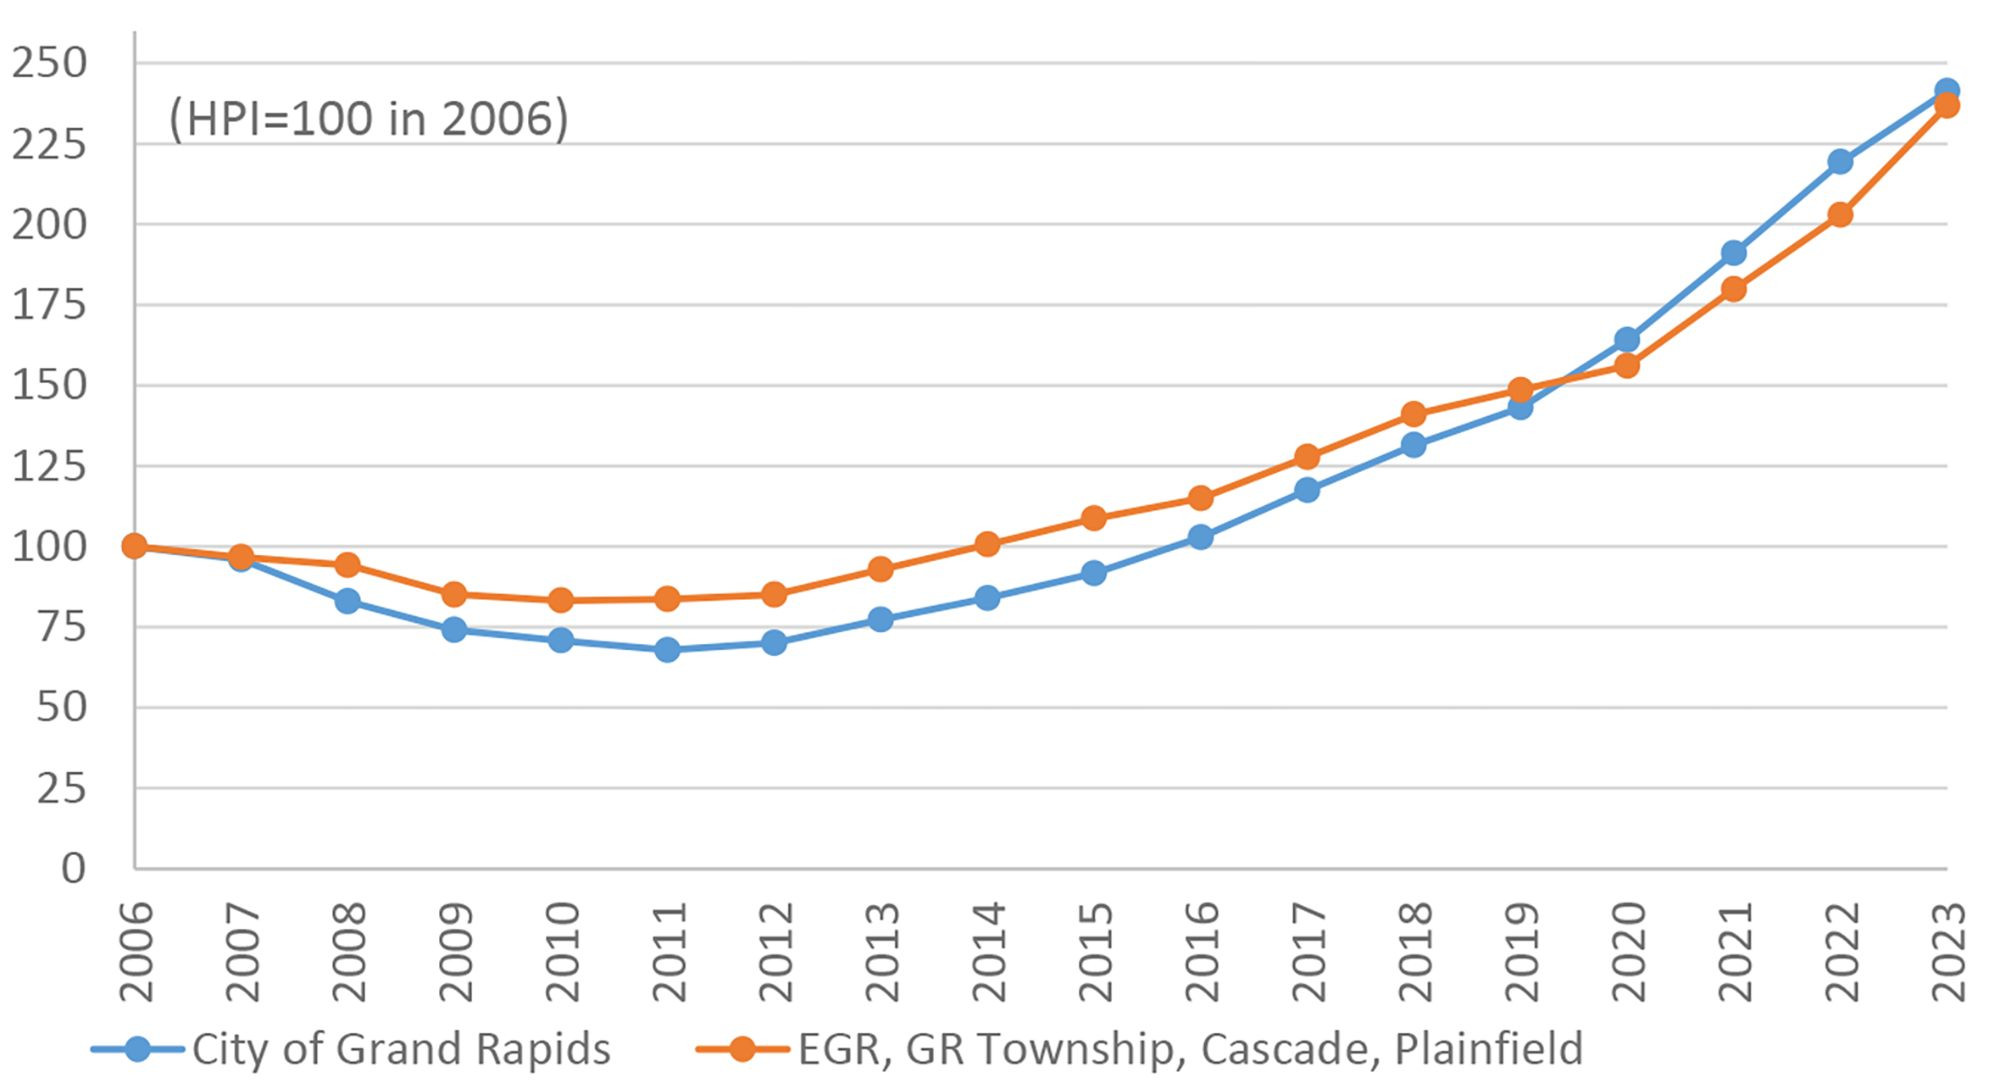
Notes: The municipalities included are the City of East Grand Rapids (EGR), Grand Rapids (GR) Township, Cascade Township, and Plainfield Charter Township. See Technical Notes at the end of the article for details.
Image Description: The figure shows repeat-sale Housing Price Indexes (HPI) for the City of Grand Rapids and northeastern suburban municipalities in the region. The indexes decreased from 2006 to 2011 but have been in an increasing trend since then. Compared to 2006, home prices have risen by about 140% in the region.
Source: Sales data retrieved from BS&A Software (2024).
As shown in Figure 1, home prices have risen by approximately 50% since 2020, reflecting the strong local demand for housing relative to a constrained supply. In the region, the unemployment rate has been stable in 2023, with employment growing by 3% compared to 2022 (see Table 1). In addition, the strong demand for homes in the region has other potential causes like high-income workers moving in from elsewhere and millennials continuing their transition to homeownership. On the supply side, building permits issued in the region remained stable in 2023, following a large increase in 2022. Local construction activity is still low compared to the early 2000s and in contrast to the recovery seen at the national level (see Figure 2). Existing homeowners are also less willing to trade homes now due to much higher interest rates on new mortgages. As a result, even with a slowdown in sales, the local inventory of homes was still at a very low 1.3 months’ supply in September 2023 (Greater Regional Alliance of Realtors, 2024).
Figure 2: New Housing Units Building Permits in the Grand Rapids Metro Area vs. Nation
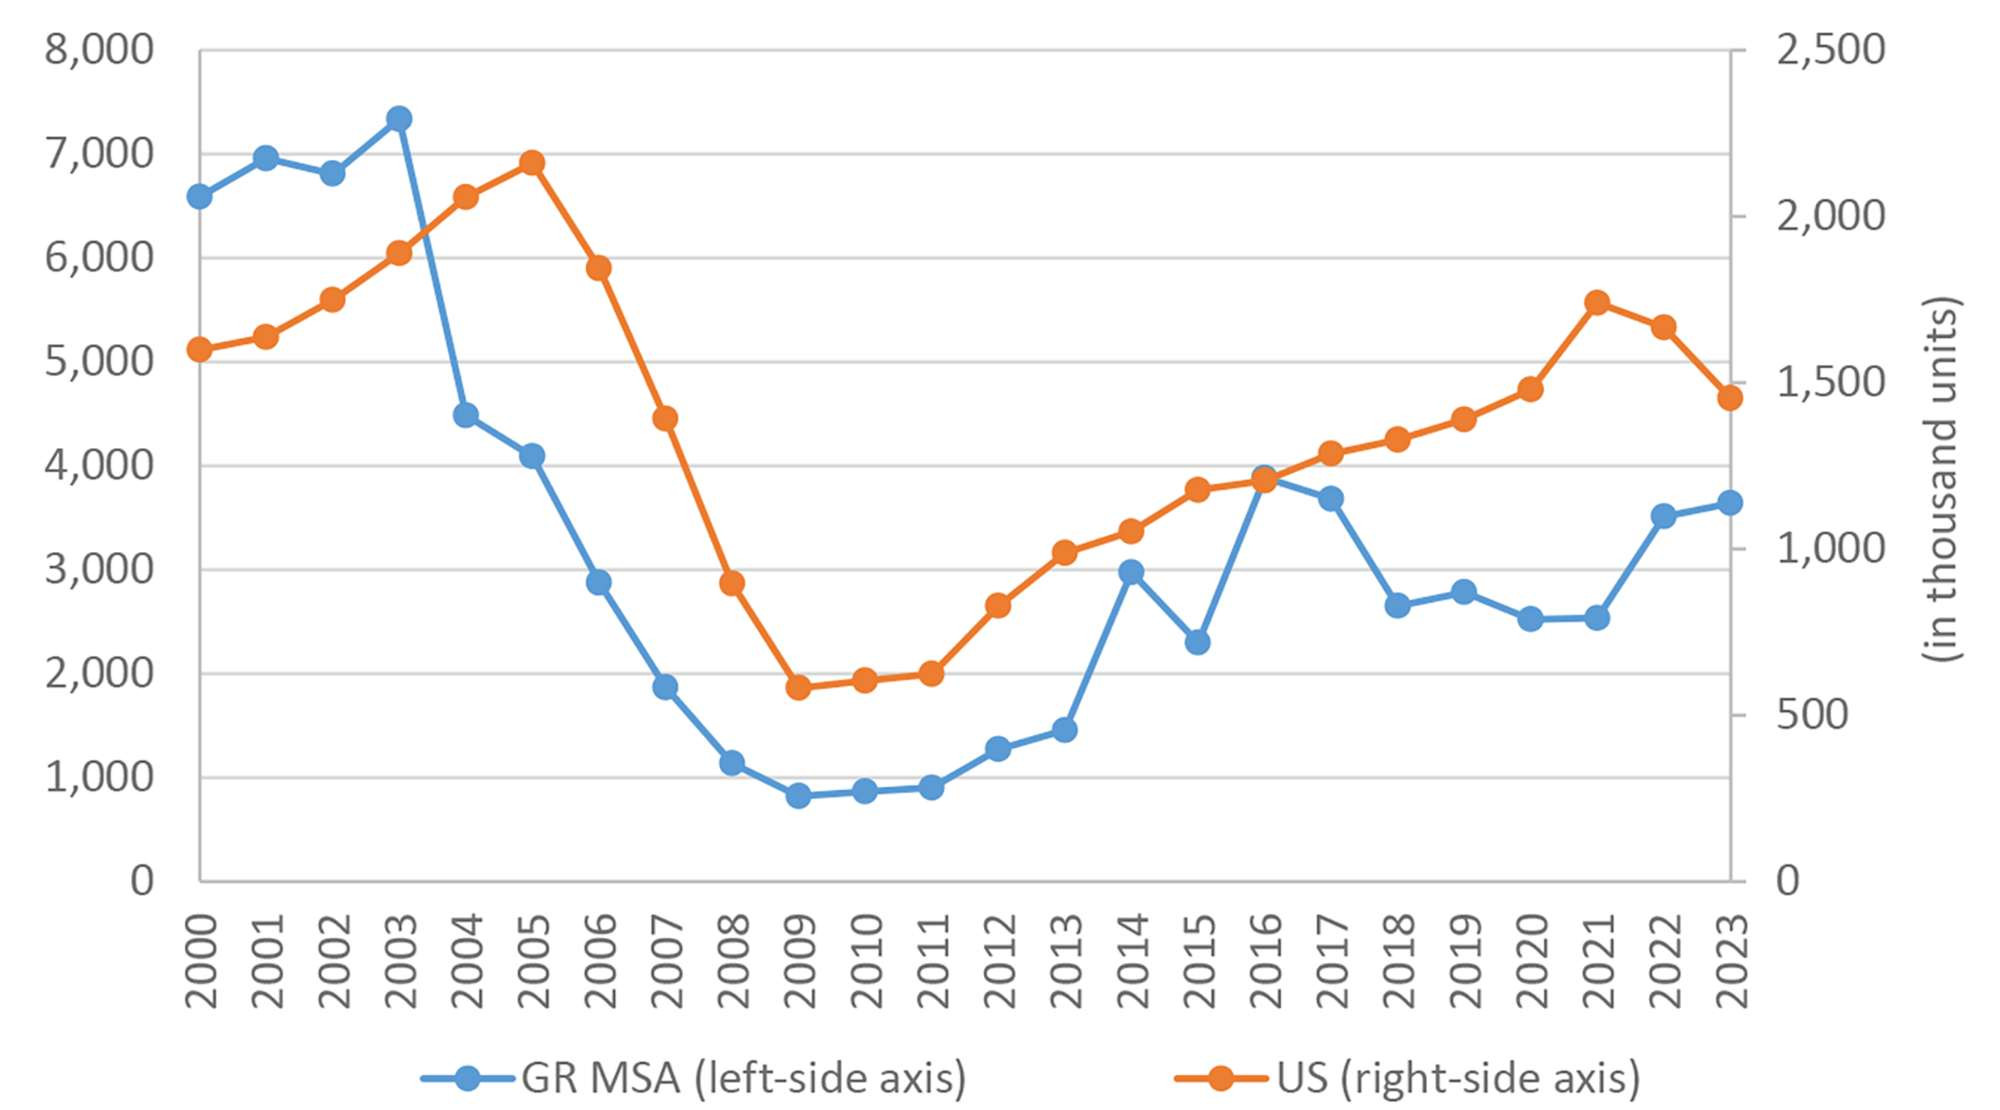
Notes: The Grand Rapids metropolitan area includes Kent, Ottawa, Barry, and Montcalm counties.
Image Description: This figure shows the changes in housing building permits in the U.S. and in the Grand Rapids region since 2000. Construction activity was booming during the first half of the 2000s, but decreased sharply in the second half. The recovery in building permit issuance started in 2012, but has not reached the same levels of the early 2000s. In the last couple of years, while construction activity has decreased in the nation, it has increased in the region, indicating that demand remains strong in the local market.
Source: Federal Reserve Bank of St. Louis (2024).
As prices remain high and the supply of homes for sale stays low, the number of houses sold has decreased in the region. The local association of real estate agents reports that pending home sales declined by 13.1% while home prices increased by 6.8% on average in 2023 compared to 2022 in the region (Greater Regional Alliance of Realtors, 2024). This smaller change in average prices compared to the changes estimated with our repeat-sale indexes indicates that the average quality of homes sold decreased in 2023, that is, the market demand shifted towards less expensive homes as a reaction to higher financing costs.
The strength of the local market is influenced by the size of the millennial cohort in the Grand Rapids area. This can be seen in the increasing proportion of adults in their 30s in Grand Rapids area which is different than is occurring nationwide (see Figure 3). The S&P CoreLogic Case-Schiller National Home Price Index dropped during the second half of 2022 and was roughly flat from the middle of 2022 to the end of 2023 (Federal Reserve Bank of St. Louis, 2024). However, during that same stretch, Grand Rapids area home prices continued to grow and building permits increased even in the face of rising interest rates. In addition, the Zillow Observed Rent Index (ZORI) for Grand Rapids also continued to rise even though many cities began to show decreases – the national index has been stable in recent months (Zillow Group, 2024). Anecdotally, local real estate professionals have heard of many young families unable to buy single-family housing in this market, choosing instead to move into a higher-quality rental instead. This is consistent with the cohort entering prime homebuying years putting pressure on housing prices and rents.
Figure 3: Percentage of 30-39 years old people among adults in Kent County-MI vs. Nation
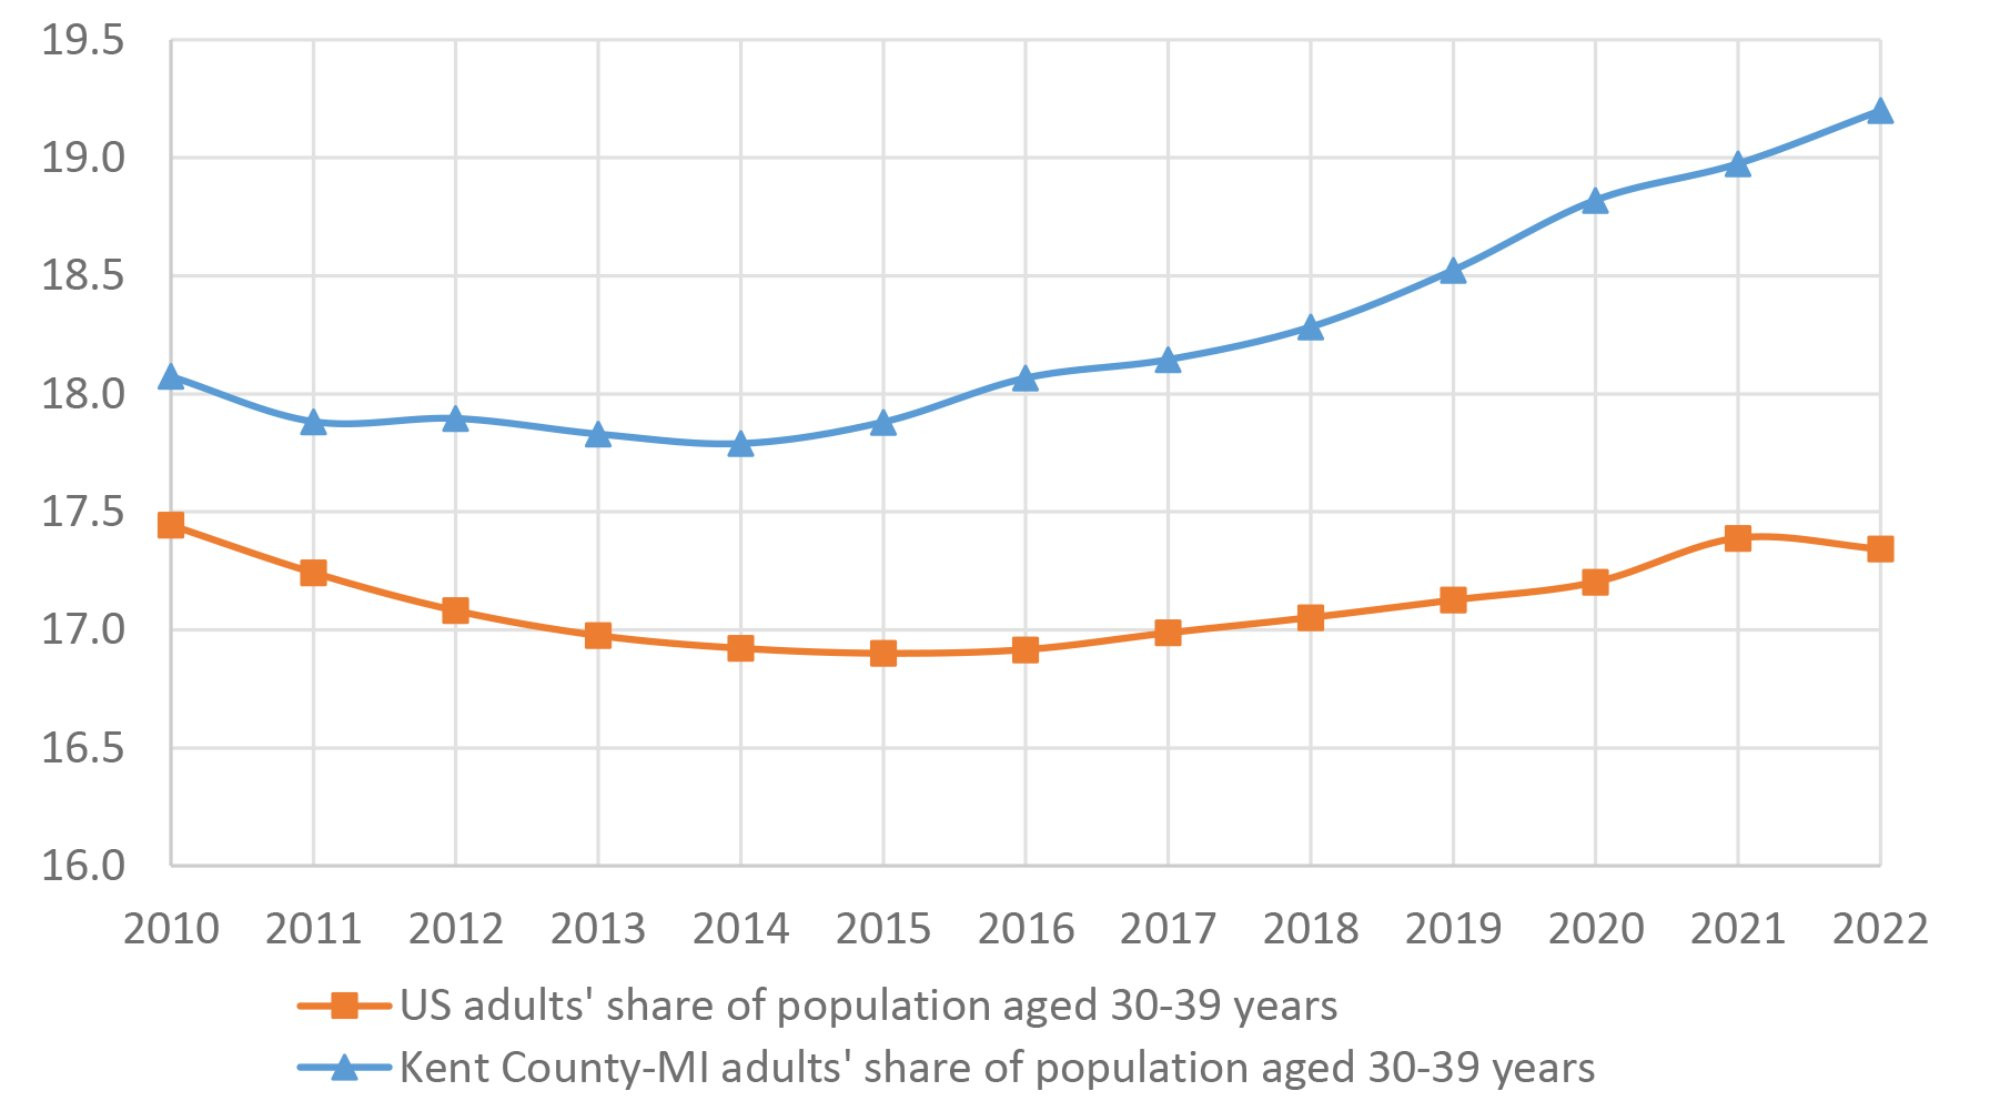
Image Description: The figure shows that the percentage of adults in the age range of 30-39 years has grown from 18% to more than 19% in Kent County-MI in recent years. In contrast, at the national level, that proportion has grown more slowly, staying around 17% in the same period.
Source: U.S. Census Bureau (2024).
Conclusion
In 2023, home prices have continued to rise in the region reflecting a strong demand for housing together with a low supply of homes for sale. However, high mortgage rates have slowed down the rate of home sales and kept construction activity stable in comparison to 2022. These changes at the local level contrast with national level trends, where home prices have stayed stable and construction activity has dropped. As the national economy continues to avoid a recession, local housing market conditions are likely to stay unchanged in 2024.
Technical Notes
The housing price indexes shown in Figure 1 are estimated using the repeat-sales method, which compares prices of the same houses as they are resold over time. The method controls for variation in the quality of the different houses sold in each period, excluding houses that were not resold in the period of study. A possible flaw is that it disregards the impact of improvements or deterioration of each house and/or neighborhood. Nonetheless, the method is widely used to measure average price changes in a broad housing market.
For our study, sales data from January 2000 through December 2023 were used. The indexes were set at 100 in 2006 so that they can be interpreted as the amount of money needed to buy a house for every $100 that was needed to purchase the same house in 2006. To better measure the changes in market conditions for typical homes, we excluded:
- parcels sold for less than $30,000 or that never reached a sale price of at least $50,000,
- parcels with prices that reached more than $1,000,000,
- parcels transferred from or to a government, nonprofit, or financial institution (typically non-market transactions), and
- parcels that had large variations in prices (possibly due to development or redevelopment).
References
BS&A Software. (2024). Property Sale Search Data. Retrieved from https://bsaonline.com/MunicipalDirectory, January 8, 2024.
Federal Reserve Bank of St. Louis. (2024). FRED Economic Data [Data files: CPIAUCSL, CSUSHPISA, EXHOSLUSM495S, GRAN326BPPRIVSA, GRAN326URN, HOUST, LAUMT262434000000005, MORTGAGE30US, PERMIT]. Retrieved from https://fred.stlouisfed.org, January 25, 2024.
Greater Regional Alliance of Realtors. (2024). Comparative Activity Report December 2023. Retrieved from https://www.grar.com/monthly-market-update, January 25, 2024.
U.S. Census Bureau. (2024). American Community Survey 5-year data, 2010-2022. Retrieved from Manson, S., Schroeder, J., Van Riper, D., Knowles, K., Kugler, T., Roberts, F., and Ruggles, S. (2023), IPUMS National Historical Geographic Information System: Version 18.0 [dataset]. Minneapolis, MN: IPUMS. http://doi.org/10.18128/D050.V18.0
Zillow Group. (2024). Zillow Observed Rent Index (ZORI). Retrieved from https://www.zillow.com/research/data/, January 25, 2024.