Trends in the West Michigan Labor Market
By Gerry Simons, Ph.D., Professor, Department of Economics
Labor shortages and associated wage increases have grabbed many of the business media headlines nationally and locally in recent months. With media reports, and what we personally hear from business associates (so-called “anecdotal evidence”), we must be careful with our conclusions as the data might not reflect what is happening overall. To get a more complete picture we can turn to government data.1 So, what do the data suggest has been happening in the West Michigan labor market?
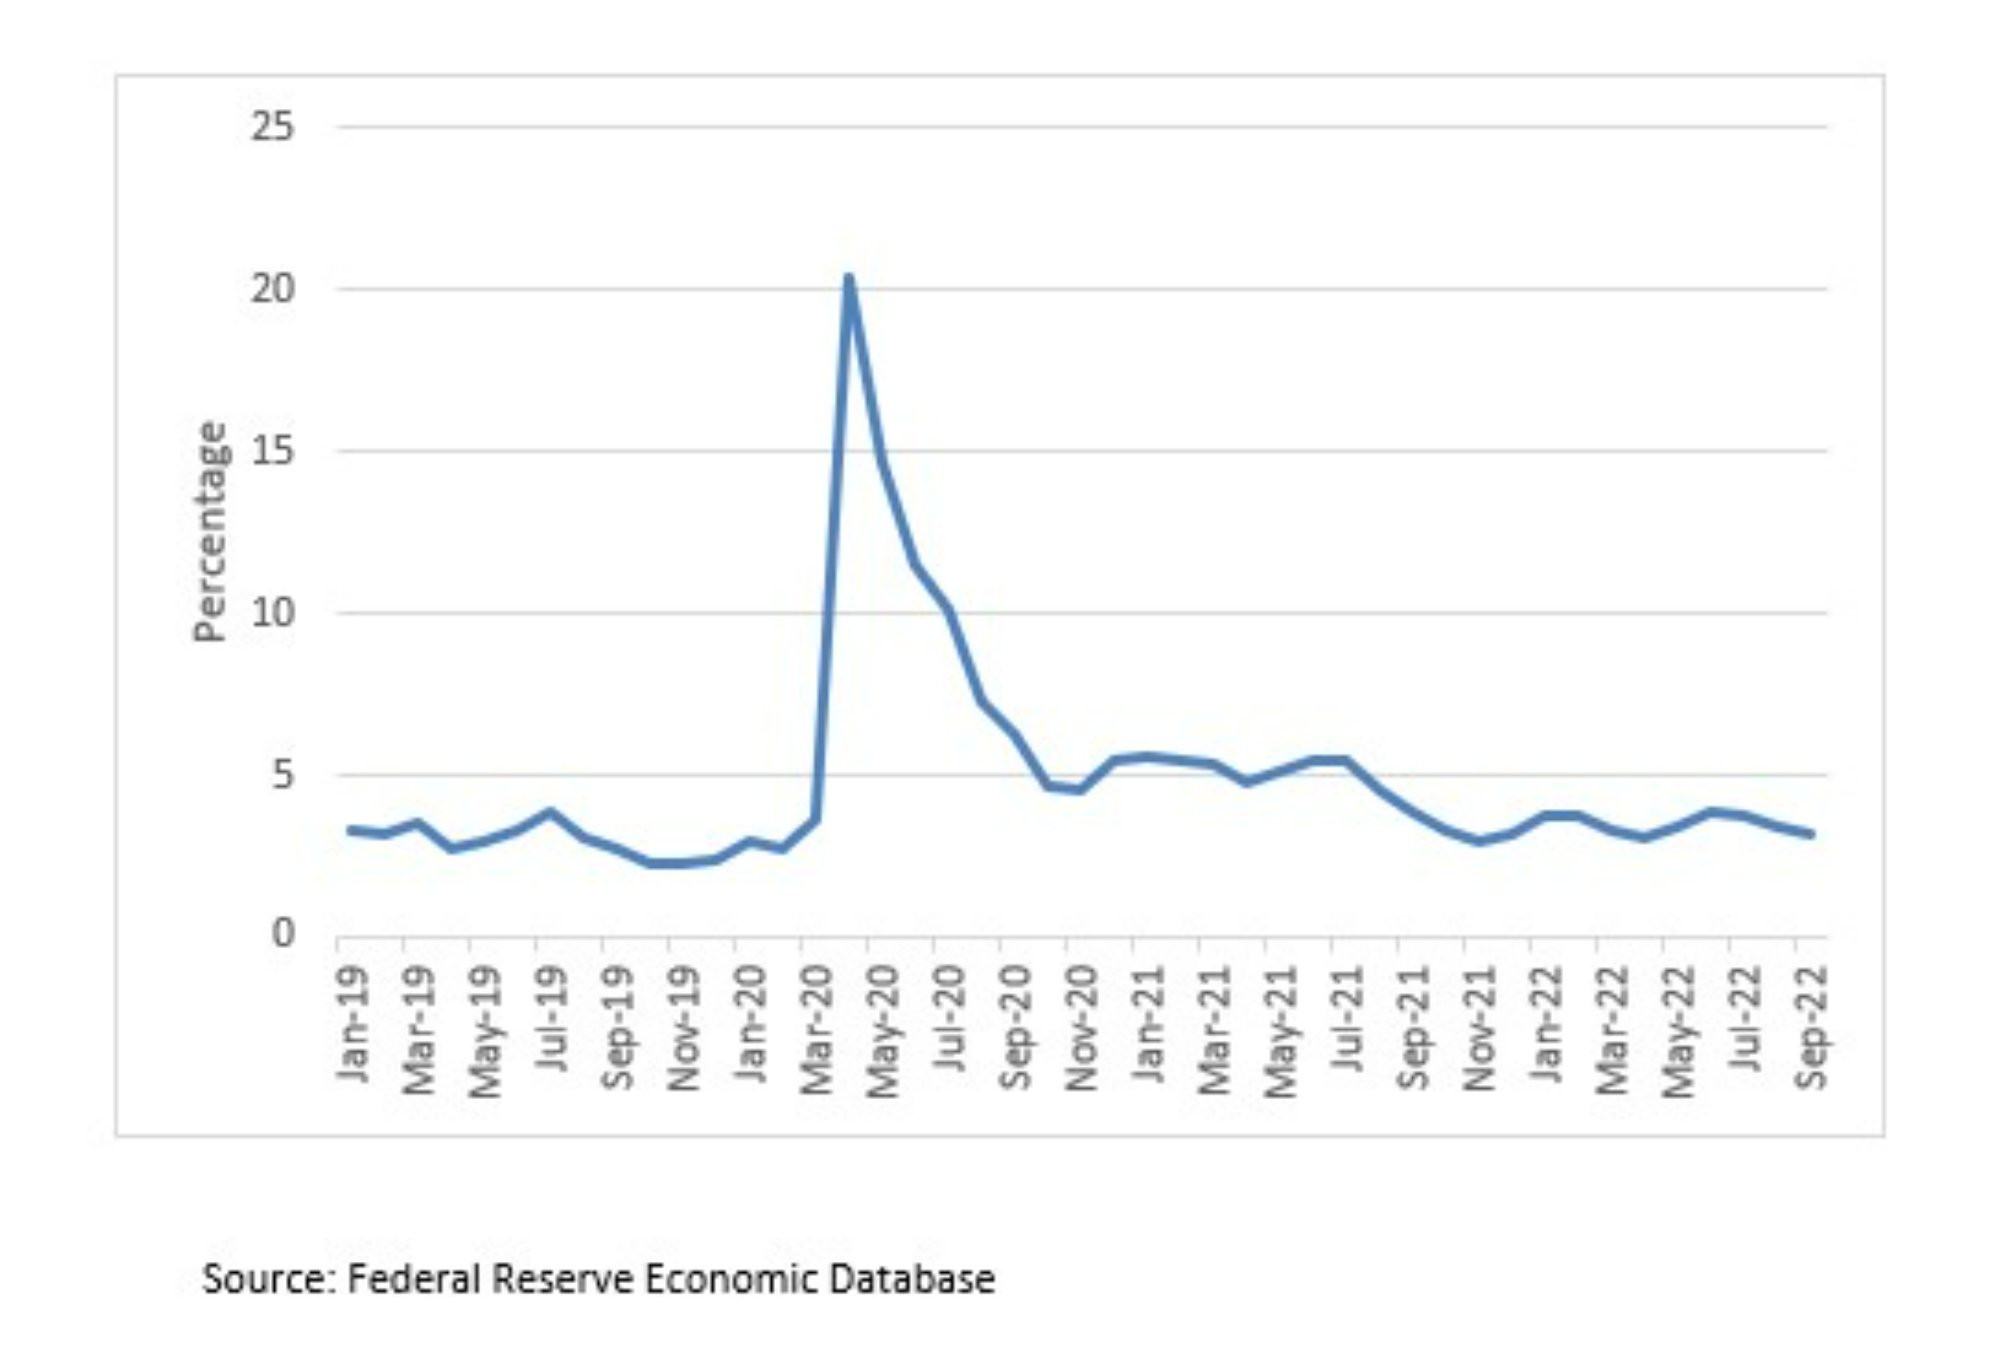
Figure 1 shows the unemployment rate for the Grand Rapids-Wyoming Metropolitan Statistical Area (MSA).2 After peaking in April 2020 at 20.3%, the unemployment rate has declined somewhat consistently, reaching 3.2% in September 2022 – relatively low, but still higher than the unemployment rate for September 2019 of 2.7%.
Figure 1 - Unemployment Rate, Grand Rapids - Wyoming MSA
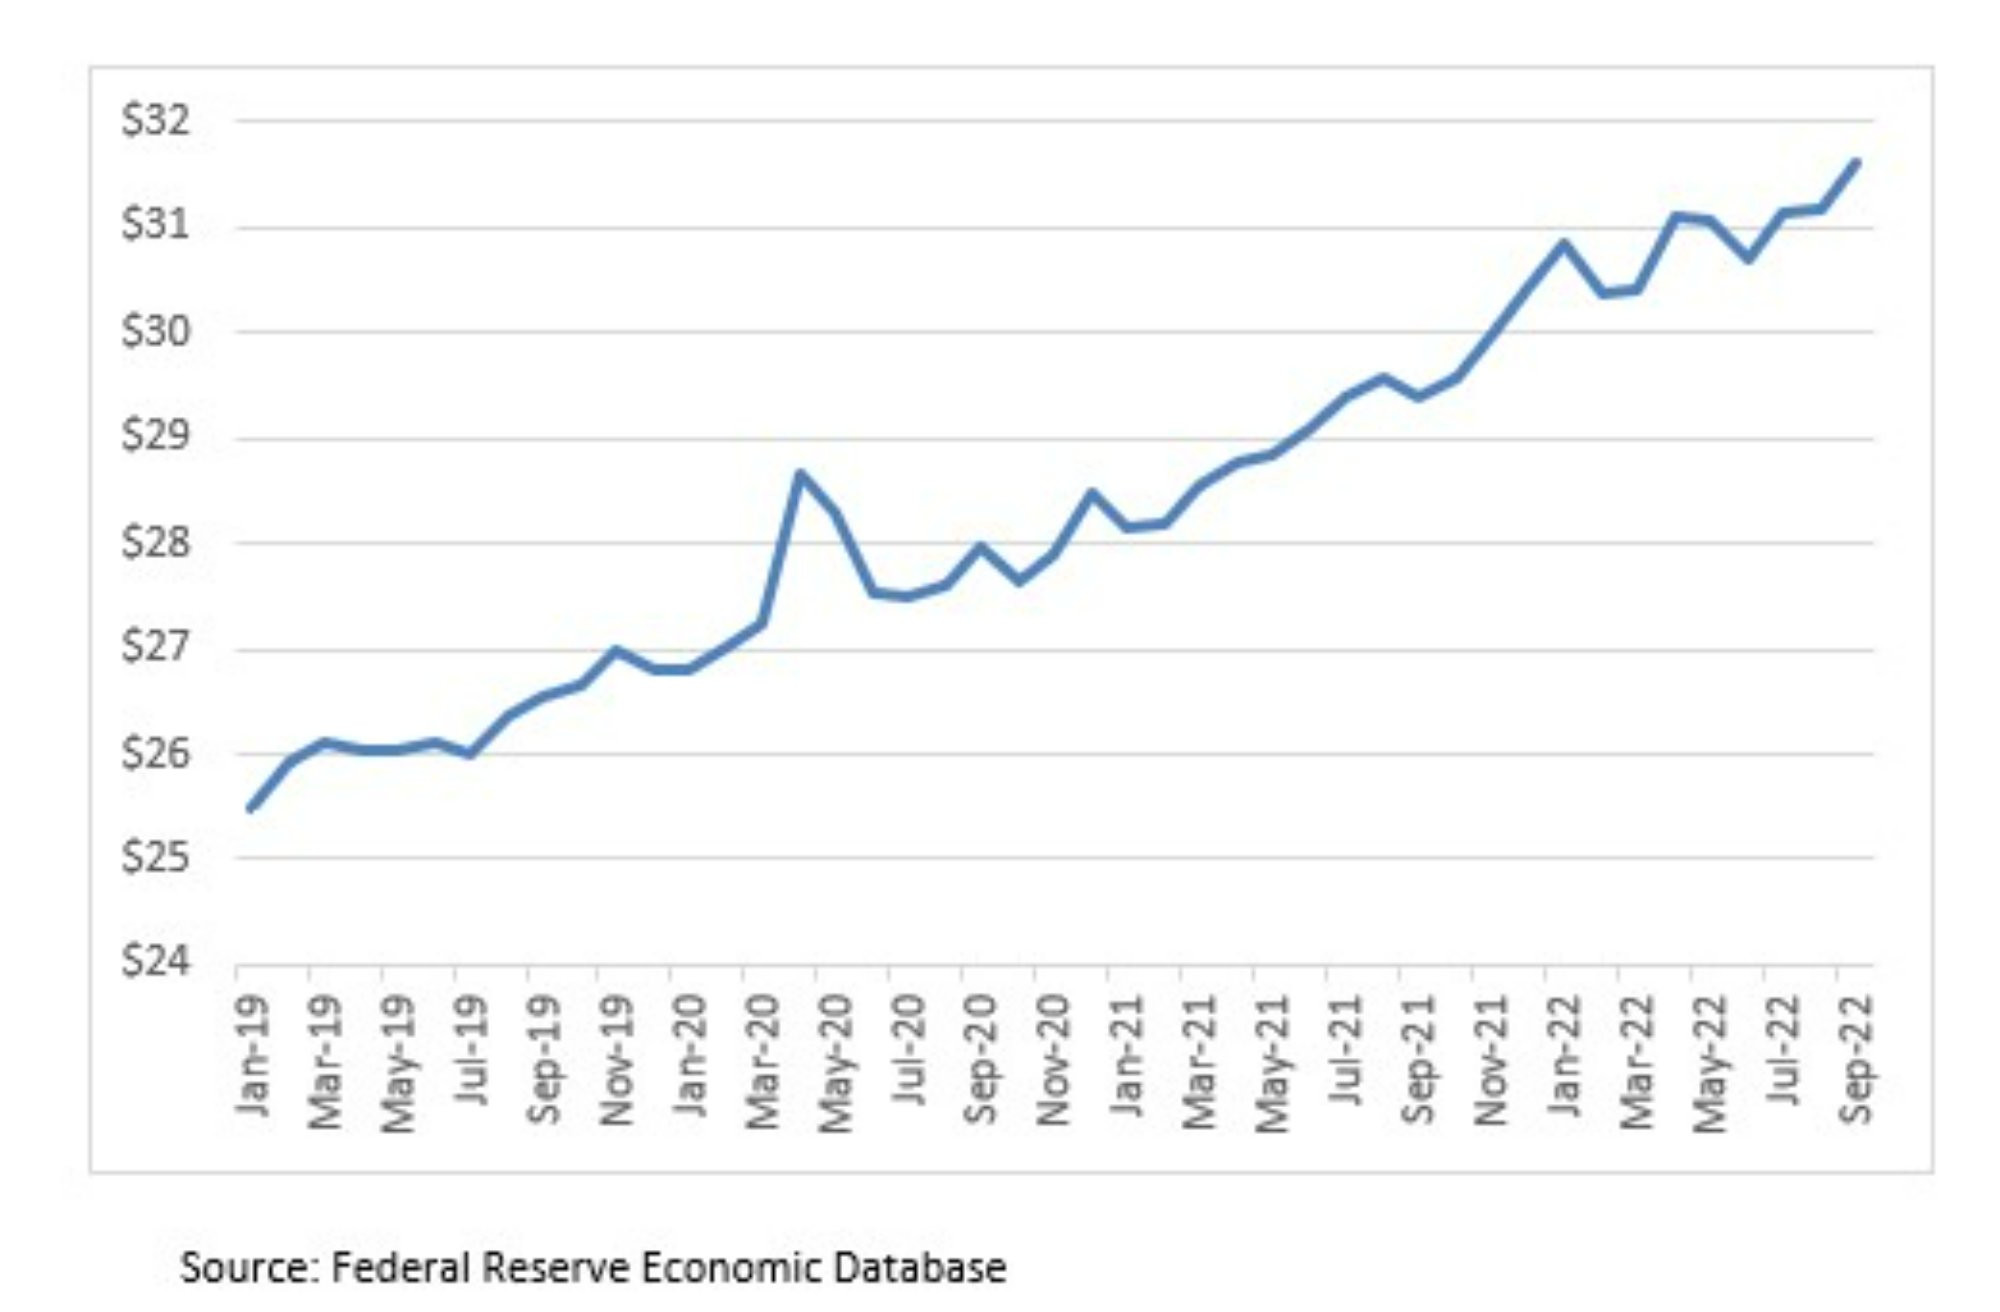
As the unemployment rate falls and finding new workers becomes more difficult, we would expect to see pay increasing. Figure 2 shows the average hourly earnings3 of private sector employees in the Grand Rapids-Wyoming MSA. Clearly, hourly earnings have increased since the end of the COVID-19 recession, but hourly earnings were already increasing before the pandemic. From September 2019 to September 2022, average earnings increased by almost 19% – from $26.56 an hour to $31.59 an hour.
Figure 2 - Average Hourly Earnings, Private Sector Employees, Grand Rapids-Wyoming MSA
So why the apparent disconnect between the information contained in Figures 1 and 2? Also, if the unemployment rate now is comparable to that from before the pandemic, how can we reconcile that with the observations from businesses that it is much harder now to find new employees? Two things are distorting our interpretation of the data here:
- What the statistics actually show
- The impact of inflation.
While the relatively low unemployment rate is good news, what does it mean in terms of the number of people looking for work? The monthly unemployment level – the number of unemployed people in the Grand Rapids-Wyoming MSA – was 15,668 in September 2019. This peaked during the COVID shutdowns at 109,616 in April 2020, and was 18,741 in September 2022. So, there were 3073 more people unemployed in the MSA in September 2022 than in September 2019. This would seem to imply that it would be easier for employers to find new workers as more people are now available for work. However, to get a clearer picture of the situation in the labor market we need to recognize that these statistics measure only those people who are “officially” unemployed – that is those without a job who are actively looking for employment – and do not count those without a job who choose not to look for work.
An additional statistic that economists use when looking at the labor market is the Labor Force Participation Rate (LFPR), which measures the percentage of working-age people who are either employed or actively seeking employment – therefore omitting those who choose not to work.4 Figure 3 shows the monthly LFPR for Michigan dating back to pre-COVID days.
Figure 3 - Labor Force Participation Rate, Michigan
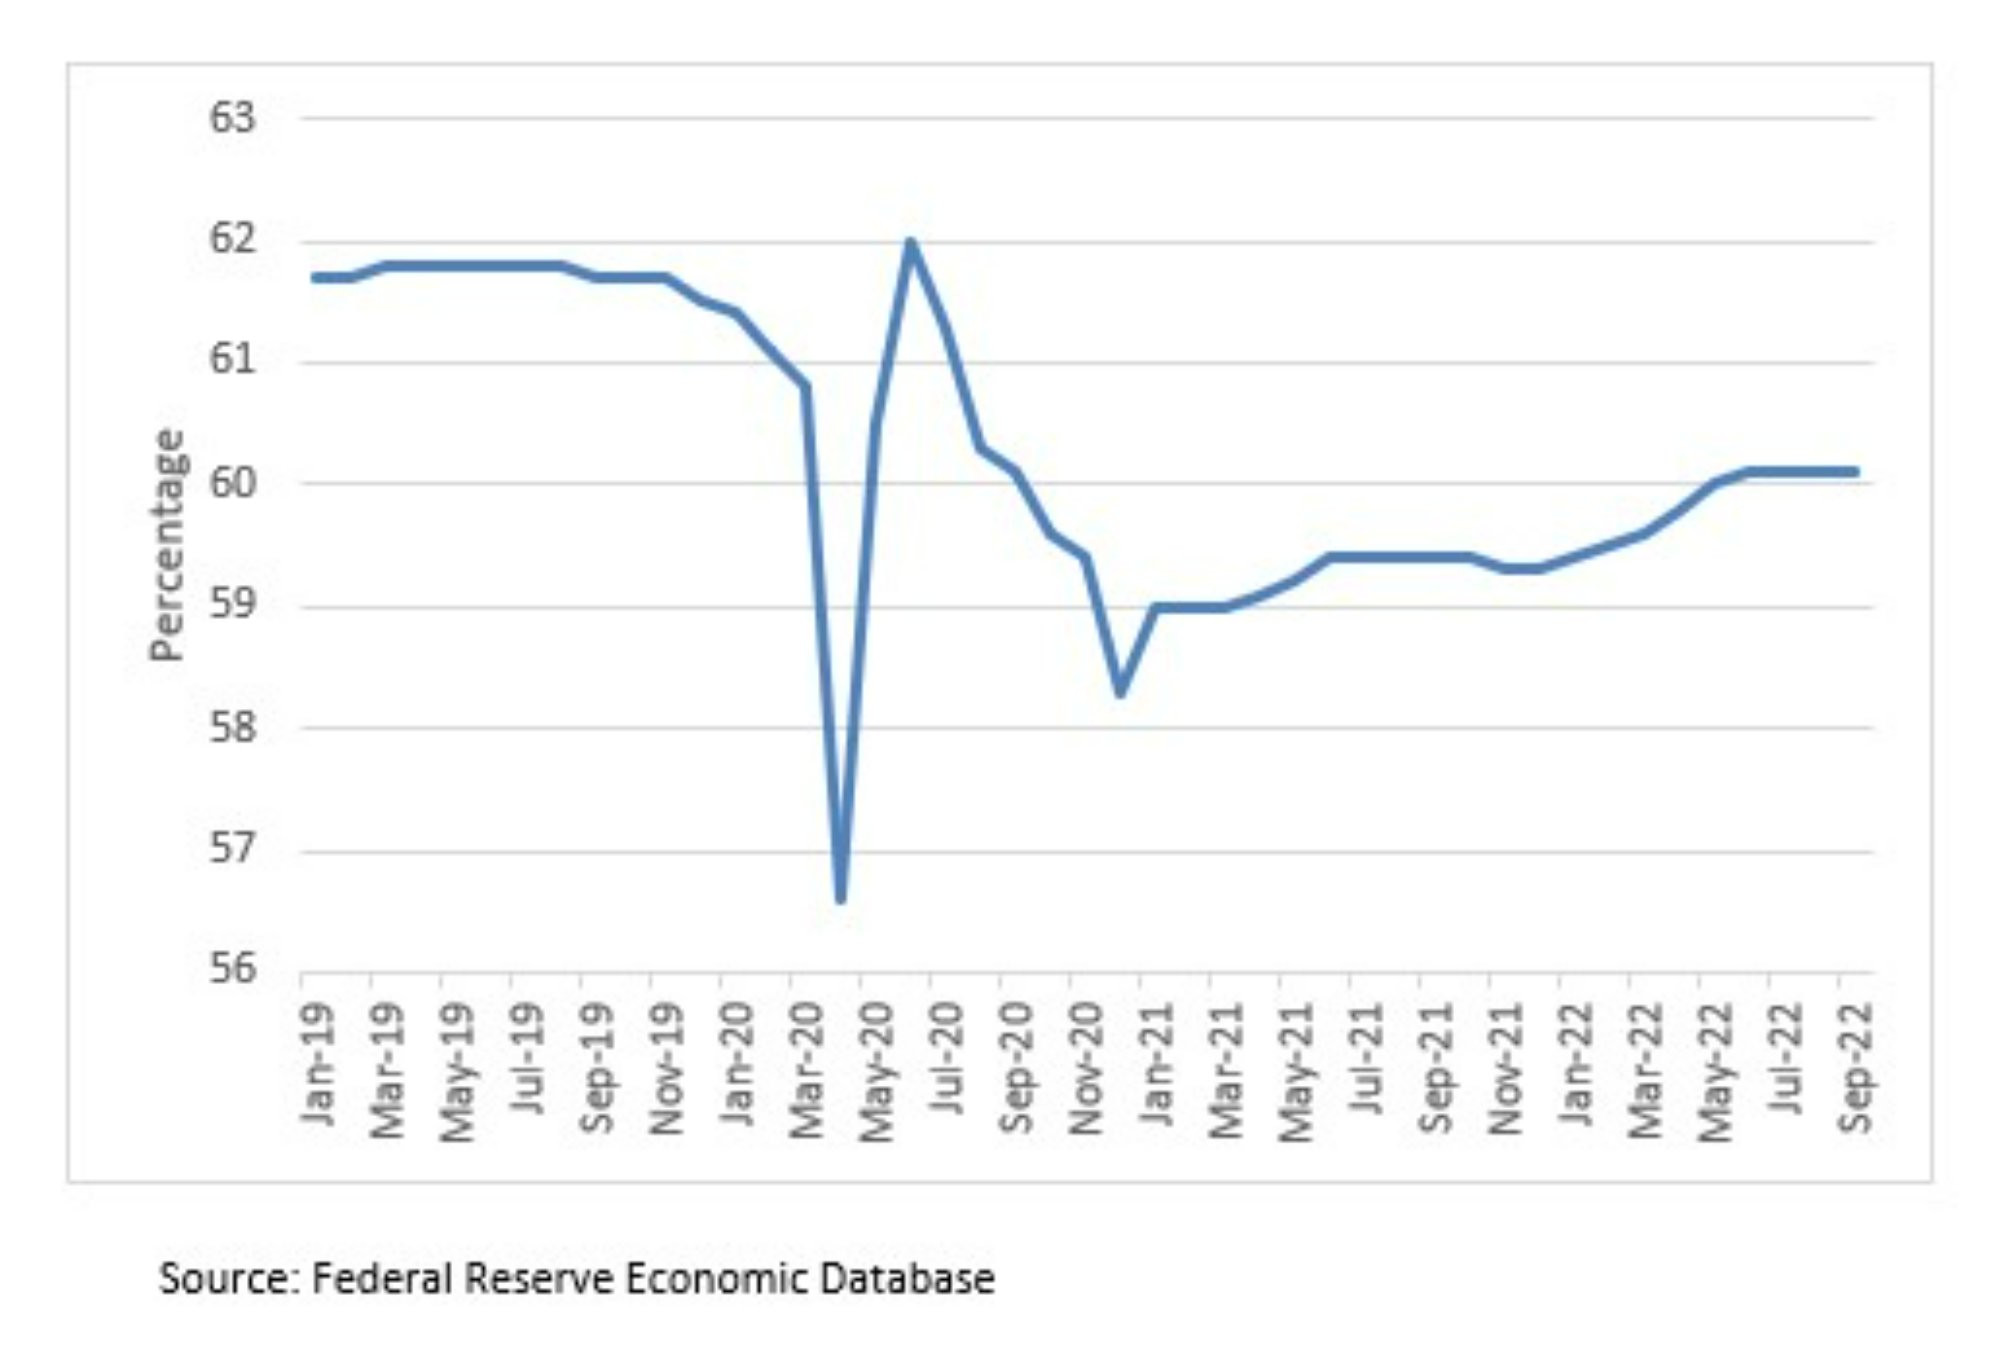
The monthly LFPR for Michigan was 61.8% in September 2019, meaning that 38.2% of working-age people in the state chose not to work. The LFPR fell to 56.6% in April 2020, then recovered later that summer before falling steadily through the beginning of 2021. Since 2021 the LFPR has increased slowly, reaching 60.1% in September 2022. So, the percentage of the working-age population in Michigan that is choosing not to work is higher in late 2022 than before the pandemic in 2019. The overall number of working-age people has also changed during this time. Unfortunately, we only have annual, not monthly, data for the LFPR in West Michigan, so no measurement is yet available for 2022. However, the LFPR for the Grand Rapids-Wyoming MSA has usually been four to six percentage points higher than for Michigan as a whole. From this we can estimate that in the Grand Rapids-Wyoming MSA there were approximately 23,000 more working-age people choosing not to work in September 2022 than in September 2019. Some of these 23,000 are older people who would have retired regardless of the pandemic. However, the notable change in the LFPR itself indicates that a significant number are likely those who are choosing not to work at this time due to other reasons.5 It is this reduction in the availability of workers which is exacerbating the labor shortage, beyond what is evident from the low unemployment rate.
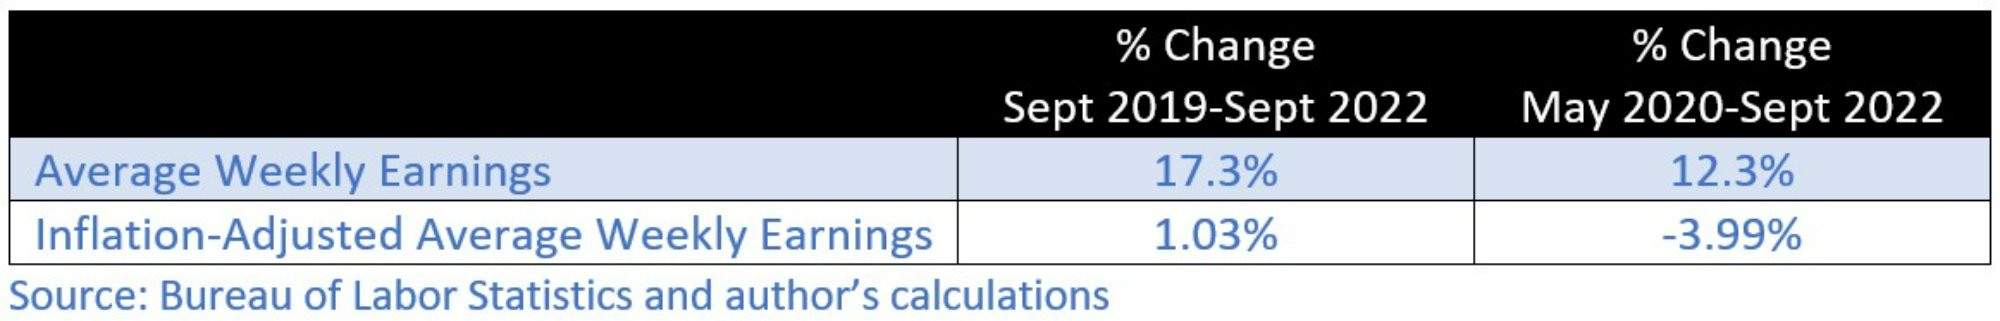
Now back to earnings. Because the average hourly earnings data shown in Figure 2 do not reflect changes over time in the number of hours worked, a better measure of workers’ pay is average weekly earnings. As can be seen in Table 1, data from the BLS show that average weekly earnings in the Grand Rapids-Wyoming MSA increased by 17% from September 2019-September 2022, with a 12% increase from May 2020-September 2022. However, when adjusted for inflation, average weekly earnings increased by only 1% from September 2019-September 2022 and decreased by 4% from May 2020-September 2022. So, although businesses have responded to the tighter labor market by raising pay, inflation has eaten away at most, if not all, of those gains.
Table 1: Changes in Average Weekly Earnings, Grand Rapids-Wyoming MSA
With stagnating inflation-adjusted earnings and declines in the LFPR, what are the implications for West Michigan businesses?
- Employers need to be creative with improving worker conditions and compensation. For some, higher pay might suffice – though there would need to be significant increases in inflation-adjusted earnings for some, not simply an increase in dollar amounts. However, people left the labor force for different reasons, and making the job market attractive again for those individuals involves dimensions other than just money such as, the ability to work remotely, flexible schedules, health and retirement benefits, etc. To successfully attract and retain workers, many businesses will need to make employment more attractive across multiple categories.
- The tight labor market will continue to make it difficult to hire “ideal” employees. Levels of skill and experience that were easy to find pre-pandemic, may not be readily available now. Therefore, employers should anticipate having to invest more in worker training.
- Employers should expect higher employee turnover rates. The balance of power in the labor market has shifted, and employers must recognize that workers may be more willing to quit than in the past.6
- Employers should recognize that the LFPR will not return to its pre-pandemic level in the near future. Some of the people who left the workforce due to the pandemic aren’t coming back. Others might come back only if employment conditions improve substantially. Employers might also want to broaden their recruitment efforts to include those they overlooked in the past, including retirees and individuals who were previously incarcerated.
Technical Notes
[1] All the data presented here are from the U.S. Federal Reserve Bank’s Federal Reserve Economic Database and the database of the Bureau of Labor Statistics (BLS; part of the U.S. Department of Labor). Both databases are freely available online at fred.stlouisfed.org and bls.gov
[2] In 2018, the Office of Management and Budget changed the definition of the Grand Rapids-Wyoming MSA (from Barry, Kent, Montcalm, and Ottawa counties to Ionia, Kent, Montcalm, and Ottawa counties) and renamed it the Grand Rapids-Kentwood MSA. However, the BLS continues to use the earlier definition to make historical comparisons easier.
[3] “Average hourly earnings” differs from hourly wage rates in that it includes overtime and other premium pay amounts that are added to an employee’s base contracted wage. Earnings reported here do not include benefits or payroll taxes paid by the employer.
[4] People in this category include retirees, full-time college students, stay-at-home parents, etc. As such, the LFPR is affected by factors including the evolving age distribution of the population and the economy’s business cycle, among others.
[5] Federal Reserve Bank economist Miguel Faria-e-Castro (2021) estimated that the number of retirees in the U.S. between March 2020 and July 2021 was approximately 2.4 million more than if the COVID-19 pandemic had never happened. Indeed.com economist Nick Bunker (2022) estimated that 3.2% (1.5 million) of workers who were retired in March 2021 “unretired” and were back in employment by March 2022.
[6] With the U.S. Federal Reserve Bank’s aggressive stance on combating inflation, there are understandable concerns about the U.S. tipping into a recession. If that happens, workers are likely to be less willing to quit.
References
Bunker, N. (2022, April 14). 'Unretirements' continue to rise as more workers return to work. Indeed Hiring Lab.
https://www.hiringlab.org/2022/04/14/unretirements-rise/
Castro, M. (2021). The COVID Retirement Boom. Economic Synopses, 25.
https://doi.org/10.20955/es.2021.25

Gerry Simons, Ph.D., Professor, Department of Economics