How Housing Affordability Affects the Local Economy in Kent and Ottawa County-MI
By Laudo M. Ogura, Ph.D., Associate Professor, Department of Economics
Christian Glupker, M.B.A., Clinical Affiliate Faculty, Department of Economics
In recent years, rising housing prices and rents have made it more difficult for low-income households to afford housing. Last year, we studied the impact of housing affordability on the Grand Rapids regional economy (Ogura and Glupker, 2021).1 In this article, we summarize our findings and provide an update on recent housing costs and income trends.
For our study, we focused on households earning less than the United Way’s ALICE (Asset Limited, Income Constrained, Employed) Survival Budget (United Way, 2019). This budget reflects the minimum pre-tax income needed to live and work in each region. For Kent and Ottawa Counties, it was about $4,700 per month for a family of four with two children.
Low-income households were considered “housing burdened” if they were renters or mortgagors and housing costs exceeded 30% of income (the burden is the difference between housing expenditures and 30% of income). Table 1 shows that about half of low-income households in the region were housing burdened, but that share was above 70% among renters and mortgagors.
Table 1: Housing-burdened share of low-income households
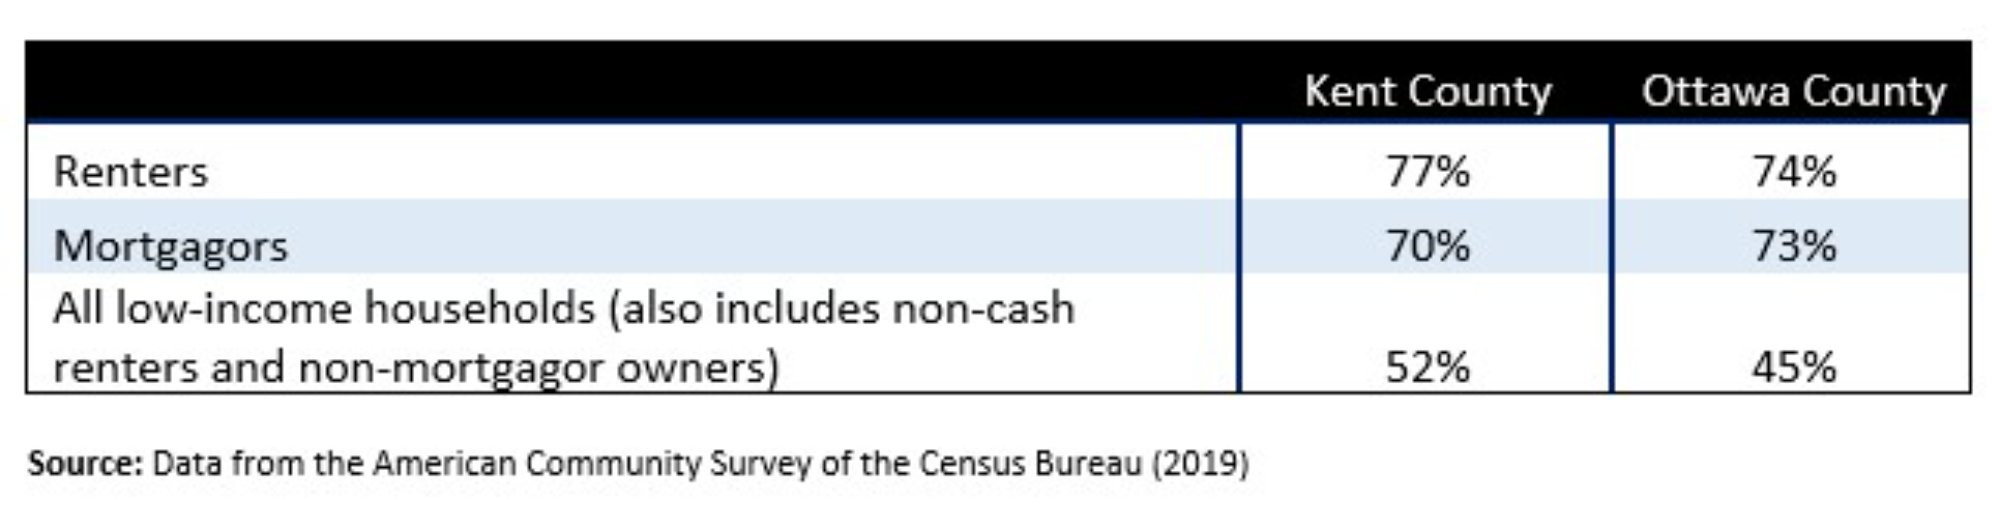
The average housing burden varied from about $4,000 to $11,000 per year per burdened household, depending on the type and size of household, renter vs. mortgagor status, and county (values based on 2019 data). In Kent County, the average burden was $5,974, with 35,832 housing burdened low-income households, for a total burden of $214 million. In Ottawa County, the average was $6,726, with 11,317 burdened households, for a total burden of $76 million.
For policy targeting purposes, it is important to note that not all the households classified as housing burdened may need assistance. While about 40% of them have children, and therefore, there might be an impact on meeting their needs, others may not have much need for additional disposable income in the first place as they may not be in school, have good health, or have education and health care costs covered by financial aid or insurance, respectively.
Economic Impacts of Making Housing More Affordable
To estimate how households would spend additional disposable income coming from a reduction in housing burden, we assumed that those households were underspending on other items.2 However, a reduction in the housing burden of low-income households would be at least partially offset by a decline in income of other locals (taxpayers, landlords, home sellers, and/or housing agents, depending on what strategies are adopted to reduce the burden). All in all, the intervention strategy must also consider the possibility of detrimental effects on the housing stock if investors’ profits are reduced. Nonetheless, the fact that low-income households have a greater propensity to consume means that there is a potentially positive net economic impact of a housing burden reduction even if it implies income redistribution within the region.
Table 2 presents the potential increase in spending by low-income households from a $1 million (M) reduction in housing burden, with a focus on essential items (food, health, and education).3
Table 2: Economic benefit per $1M reduction in housing burden
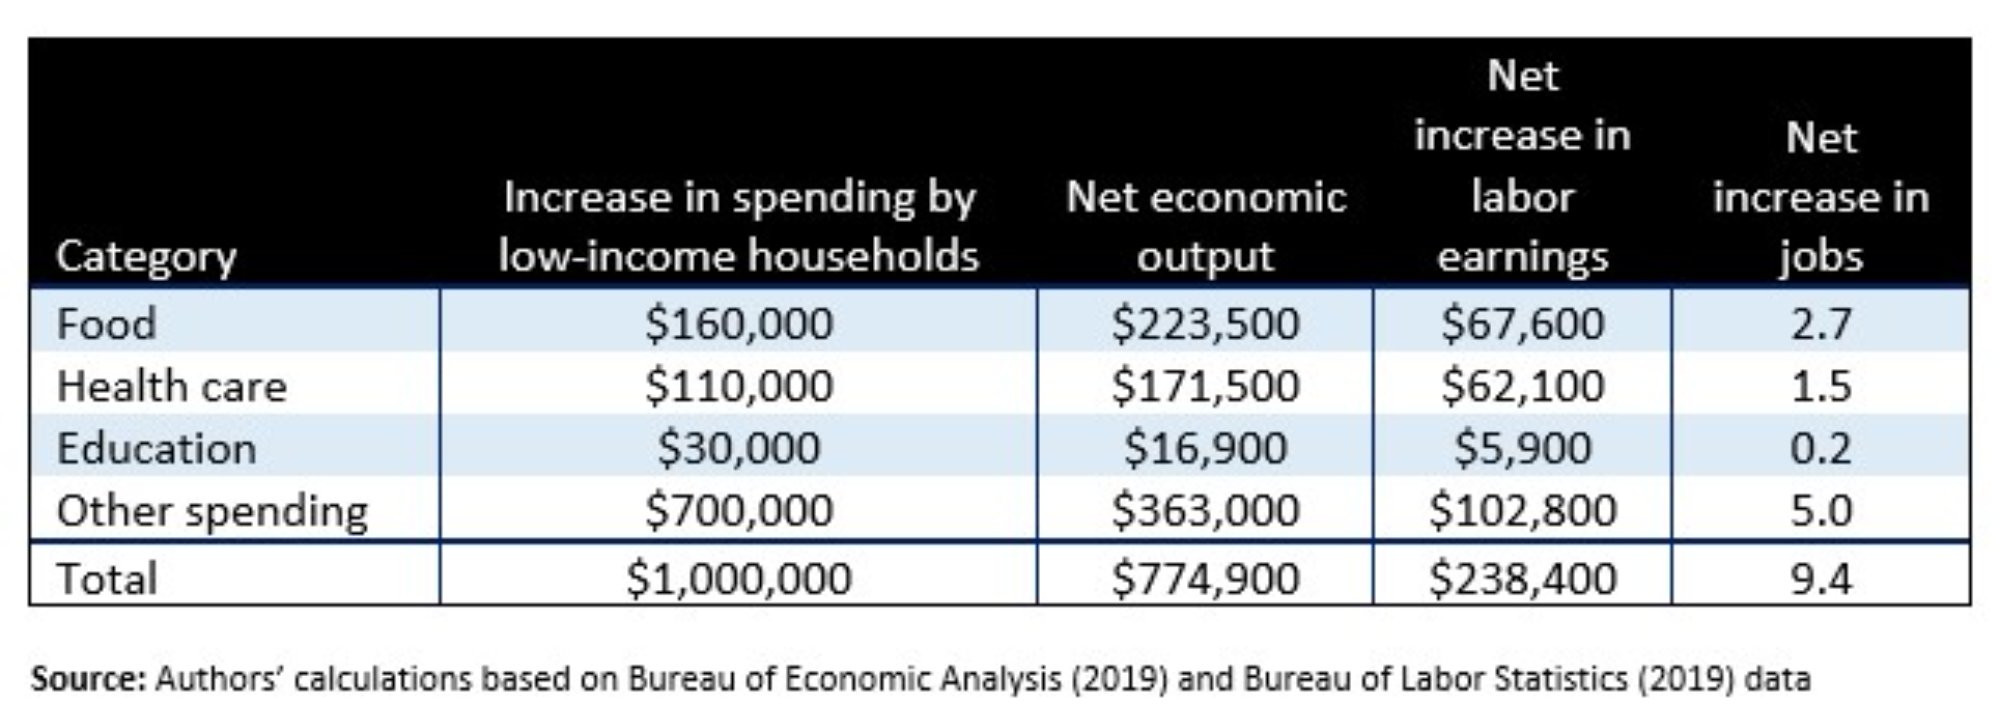
The table also shows the impact on local economic output, earnings, and jobs.4 For instance, in Kent County, if the total housing burden of $214M were removed, low-income households would spend $34.3M more on food, $23.5M more on health care, $6.4M more on education, and $150M more on other items. The net economic benefit would be $165.8M in economic output, $51M in labor earnings, and approximately 2,000 jobs. In Ottawa County, if the total housing burden of $76M were eliminated, low-income households would spend $12.2M more on food, $8.4M more on health care, $2.3M more on education, and $53.2M more on other items. The net economic benefit would be $59M in economic output, $18.1M in labor earnings, and 716 jobs. Note, again, that these values must be taken with caution as the actual impact depends on what strategies are adopted and who is affected by them.
Further Considerations
The benefits of affordable housing go well beyond additional spending, economic output, and jobs. Housing affordability impacts the nutrition, health, and education of households.
In 2020, 11% of the Kent County population and 9% of the Ottawa County population were food insecure, that is, had limited access to adequate food (Feeding America, 2022). A reduced housing burden would lessen food insecurity, helping to cut the need for food aid programs.
Regarding health care, in Kent County, the uninsured share in 2020 was 16% in the group of 18 to 64 years old people with incomes below 200% of the poverty line. The corresponding share in Ottawa County was 14% (Census Bureau, 2020). Reduced housing burden would likely lead to higher healthcare spending and a positive impact on mental and physical health in the long run (the literature on this topic is discussed in detail in our full report; Ogura and Glupker, 2021).
Housing affordability may also help families to move to better neighborhoods where their children are more likely to succeed in their school education (Mueller and Tighe, 2007).
Housing costs and household income changes since 2019
The analysis presented above was based on 2019 data. Since then, earnings for low-skilled workers have gone up, but rents and home purchase costs have risen even more.
In the U.S., retail trade workers’ earnings rose by 16% from 2019 to August 2022 while manufacturing production workers’ earnings rose by 12% (Bureau of Labor Statistics, 2022). Even if wage growth in the Grand Rapids region has been slightly higher than in the rest of the nation, it is still not on par with the growth in housing costs.
According to Zillow (2022), in that same period, rents in the region rose by 25% while bottom-tier homes had a 42% increase in value. Mortgage costs also have risen substantially from an average of a 3.9% rate in 2019 to a 7.1% rate in late October 2022 (Freddie-Mac, 2022).
In conclusion, housing affordability factors have changed in negative ways recently, making it pressing to better understand who is affected and how so that specific strategies can be designed to address the issue. On the demand side, there is limited assistance available to low-income households while, on the supply side, efforts to expand housing availability require government, developers, and community partners to work together to find solutions that work for all.
Technical Notes
[1] This study was commissioned by Housing Next, an agency of the Greater Ottawa County United Way.
[2] In practice, low-income households may not spend the entire additional disposable income as some will save a portion or will cut their dependency on savings, loans, or assistance from others. However, economic studies show that low-income households have a very high propensity to consume so our estimates can be taken as the upper bound in the discussion of economic impacts.
[3] This estimation uses 2019 data from the Consumer Expenditure Survey (Bureau of Labor Statistics, 2019). Spending on education does not include student loan payments.
[4] The economic impact is calculated using RIMS (Regional Input-Output Modeling System) multipliers, estimated by the Bureau of Economic Analysis (2019). We assumed that the burden was redistributed from low-income households to others in the region.
References
Bureau of Economic Analysis. (2021). Regional Input-Output Modeling System (RIMS II).
Bureau of Labor Statistics. (2019). Consumer Expenditure Survey 2019. Retrieved from https://www.bls.gov/cex
Bureau of Labor Statistics. (2022). Average hourly earnings [CES4200000003, CES3000000008] and average weekly earnings [SMU26243400500000011, CES0500000011]. Retrieved from Federal Reserve Bank of St. Louis, https://fred.stlouisfed.org, October 5, 2022.
Census Bureau. (2019). American community survey 1-year, 2019. Retrieved from IPUMS USA, University of Minnesota, www.ipums.org
Census Bureau. (2020). Small Area Health Insurance Estimates (SAHIE). Retrieved from https://www.census.gov/data-tools/demo/sahie/#/
Feeding America. (2022). Food insecurity among overall (all ages) population in the United States, 2020 Data. Retrieved from https://map.feedingamerica.org/
Freddie Mac. (2022). 30-year fixed rate mortgage average [MORTGAGE30US]. Retrieved from Federal Reserve Bank of St. Louis, https://fred.stlouisfed.org, October 31, 2022.
Mueller, E.J., and Tighe, J.R. (2007). Making the case for affordable housing: Connecting housing with health and education outcomes. Journal of Planning Literature 21(4):371-385.
Ogura, L. and Glupker, C. (2021). The economic impact of affordable housing stock in Kent and Ottawa County, Michigan. Housing Next -- Greater Ottawa County United Way. Available at https://scholarworks.gvsu.edu/eco_otherpubs/9
United Way. (2019). ALICE Michigan 2019 county profiles – household survival budget. Available at https://www.unitedforalice.org/county-profiles/michigan
Zillow. (2022). Zillow Home Value Index (ZHVI) and Zillow Observed Rent Index (ZORI). Retrieved from https://www.zillow.com/research/data/, October 5, 2022.