Grand Rapids Housing Market – 2022 In Review
By Laudo M. Ogura, Ph.D., Associate Professor, Department of Economics
Paul Isely, Ph.D., Associate Dean, Seidman College of Business
In 2022, housing markets in the U.S. faced rising interest rates. Inflation peaked at 9% year-over-year in June, due to continuing COVID driven supply-chain issues, stimulus spending, and disruptions caused by the war in Ukraine. In response, the Federal Reserve restricted credit, resulting in the 30-year fixed mortgage interest rate rising from 3.1% in late 2021 to 6.4% in late 2022. This large change in mortgage rates can significantly reduce home affordability. For instance, with rates rising from 3.1% to 6.4%, the mortgage payment on a $300,000 loan increases from about $15,400 to $22,500 per year, while the minimum annual income threshold is up by about $25,000, assuming a 28% housing expense-to-income ratio.
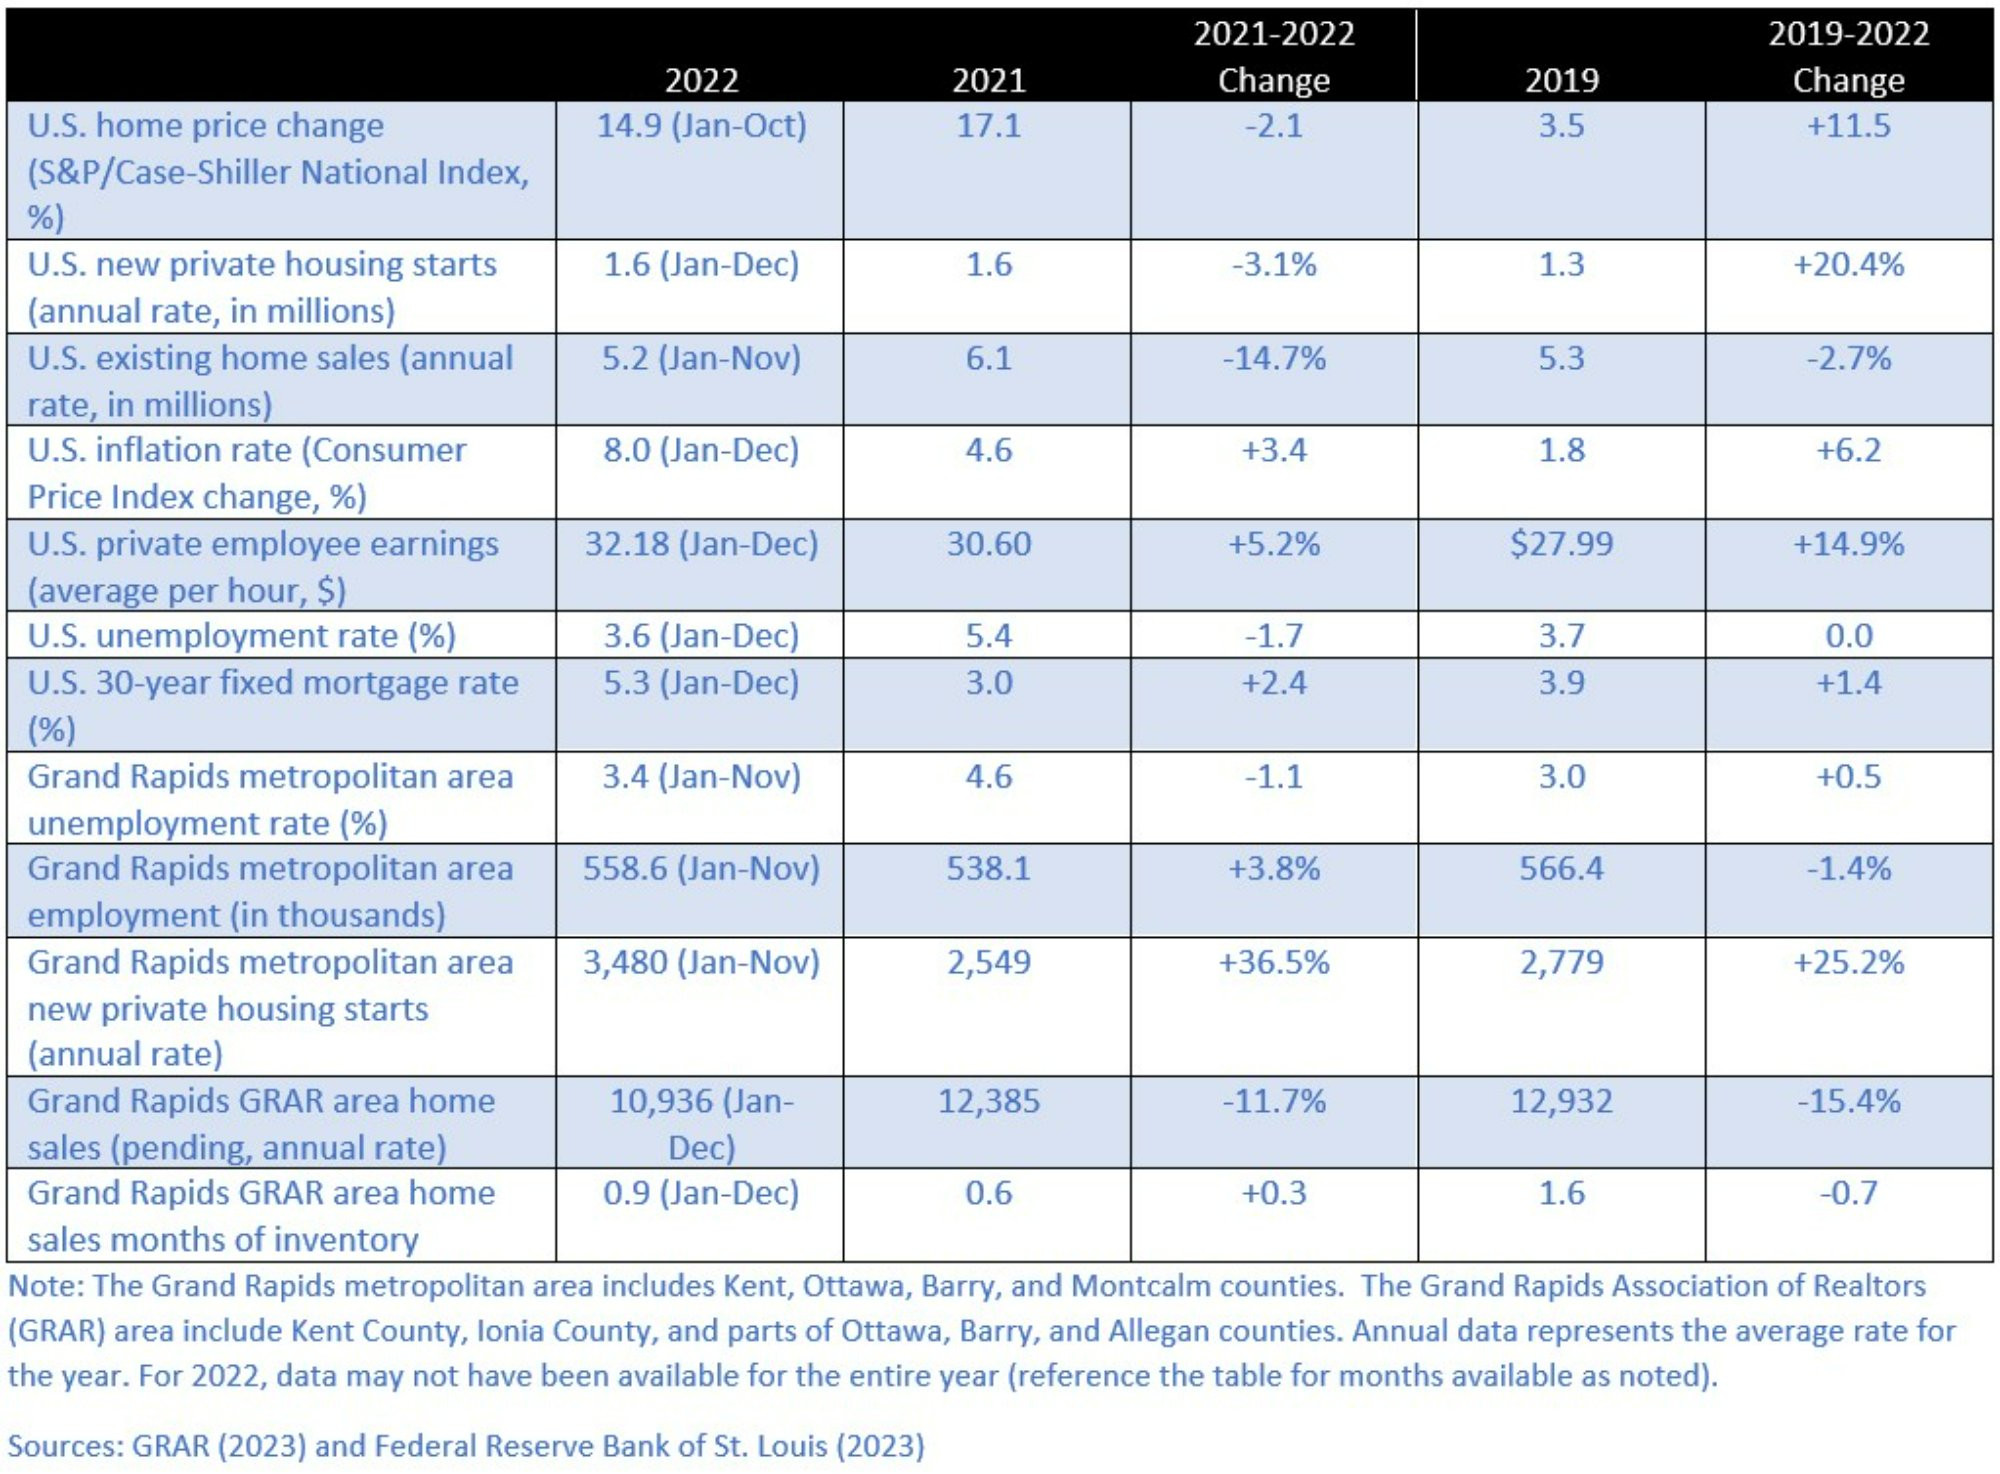
Table 1 summarizes the housing market conditions in the U.S. and in the Grand Rapids region in 2022 compared to 2021 and 2019, the year before the COVID pandemic started. Nationally, home prices went up by 14.9% in 2022 (based on data through October) compared to 2021. However, the impact of rising mortgage rates has been felt on existing home sales, which declined by 14.7% in 2022 (based on data through November) compared to 2021. Construction activity also decreased in 2022, by 3.1%, compared to the previous year.
Table 1 - Economic and Housing Market Conditions
For the Grand Rapids region, our price index estimations are presented in Figure 1. These estimates are based on the repeat-sales method, and the data is restricted to reflect typical non-distressed home sales (see Technical Notes at the end of the article for details). Our index for the City of Grand Rapids indicates that home prices rose by an average of 16% in 2022 following a 17% rise in 2021. In the northern and eastern municipalities of Kent County that we tracked (East Grand Rapids, Grand Rapids Township, Cascade, and Plainfield), prices rose by 23% in 2022 following an 11% rise in 2021. The indexes utilize an arbitrary value of 100 in 2006, when local home prices peaked before the crash. Hence, home prices in the region have more than doubled since 2006 as the indexes have reached values above 200 in 2022.
Figure 1 - Housing Price Indexes (HPI) for the Grand Rapids Areas
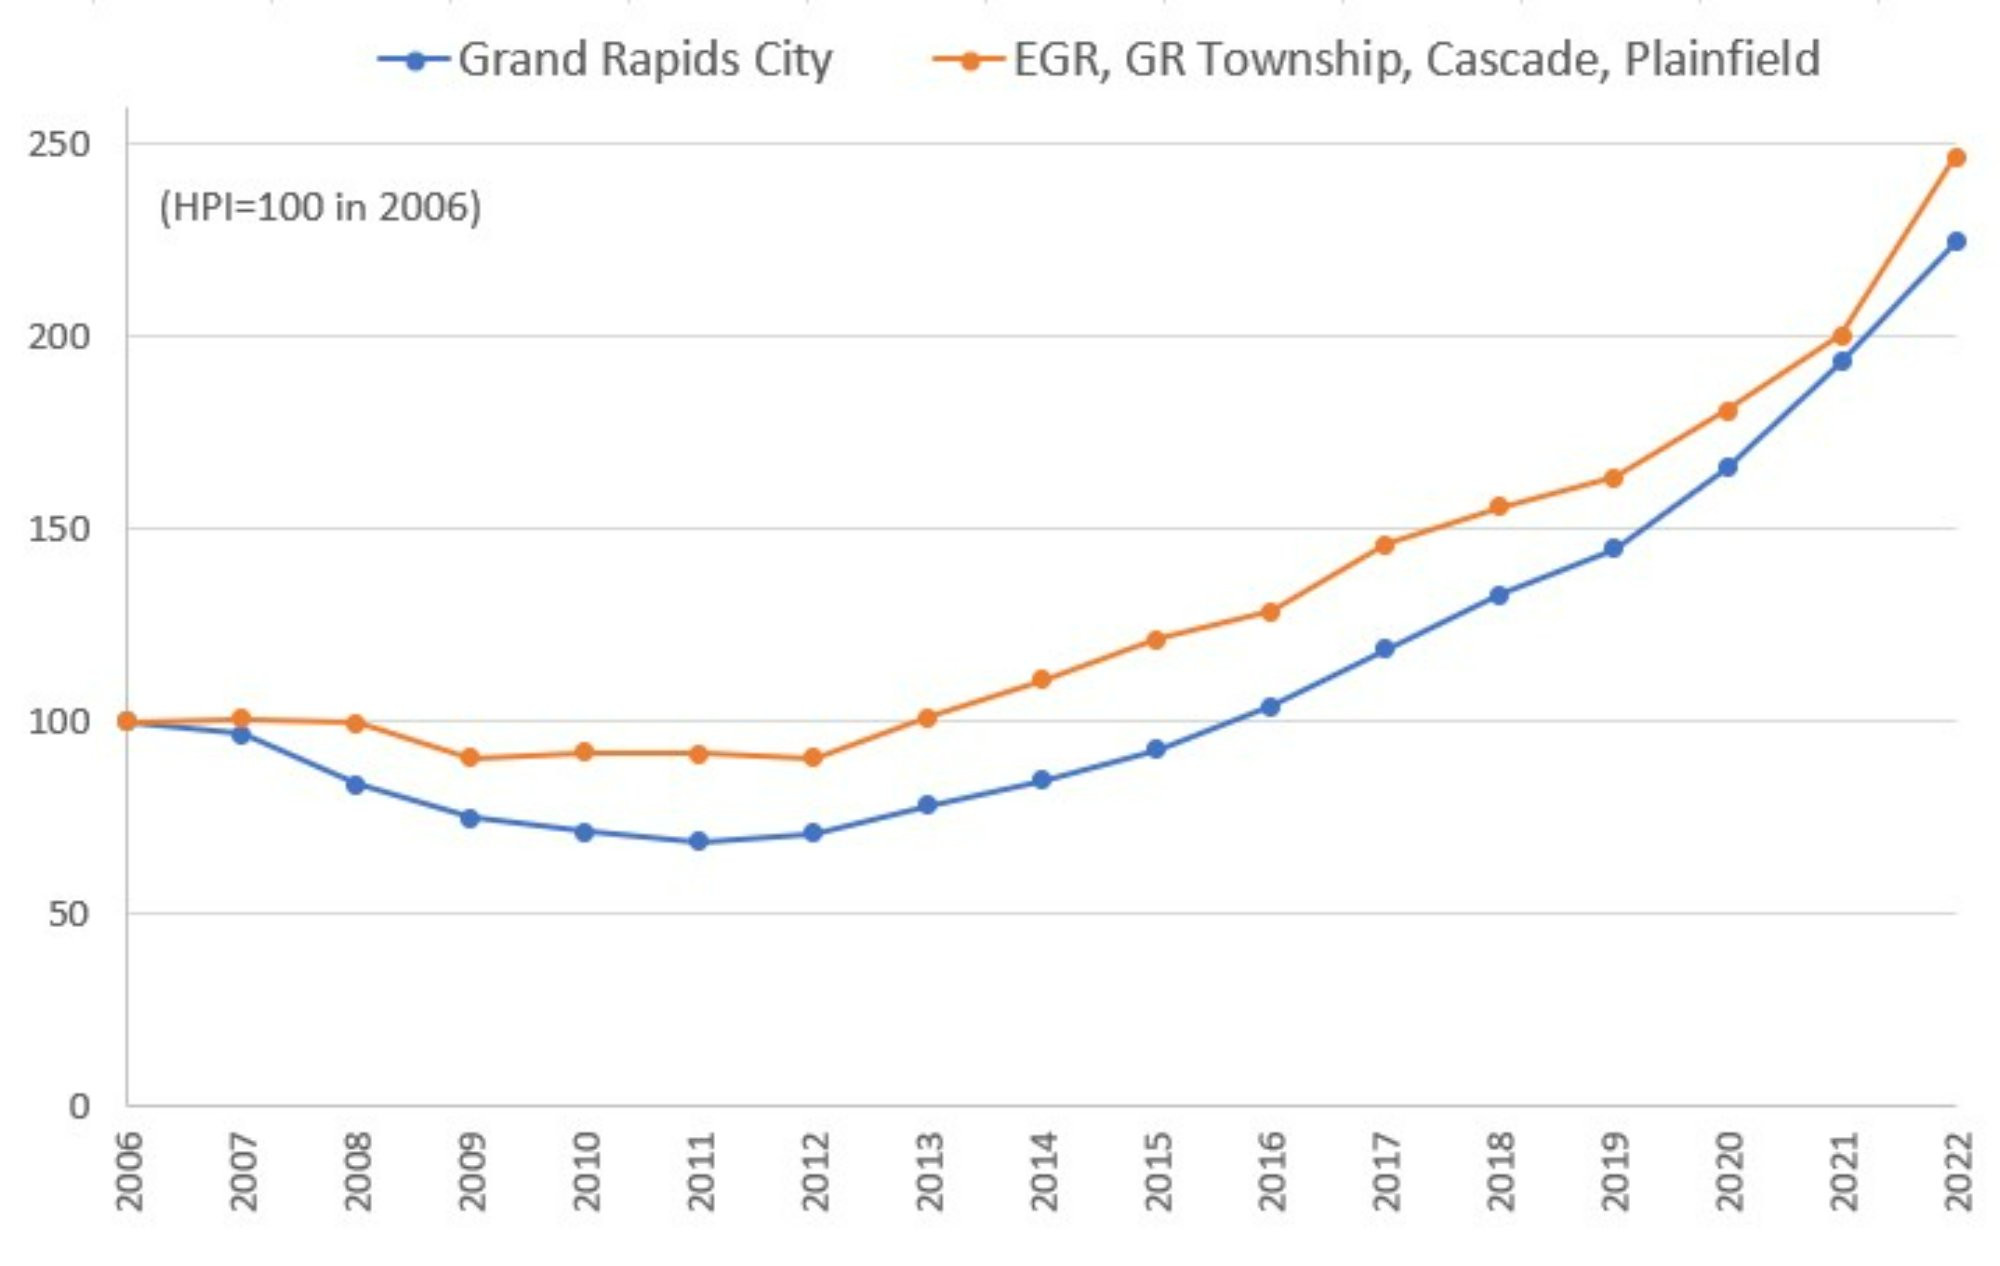
Note: The municipalities included are City of East Grand Rapids (EGR), Grand Rapids (GR) Township, Cascade Township, and Plainfield Charter Township. See Technical Notes at the end of the article for details.
Source: Sales data retrieved from BS&A Software (2023)
The large price growth in recent years reflects the strong local demand for housing relative to a constrained supply of homes for sale. On the demand side, the regional economy has further recovered from pandemic disruptions, with the unemployment rate and employment count approaching 2019 values (see Table 1). The strong demand for homes in the region has other potential causes like high-income workers moving in from other regions, millennials transitioning to homeownership, and the attractiveness of housing for investment purpose as prices continued to rise.
On the supply side, building permits picked up in the region in 2022, but construction activity has only partially recovered from the severe housing crash a decade ago (see Figure 2). The rate of construction in the last 10 years has barely matched the population growth rate in the region. Much of the new construction has been multi-family units, so the supply of single-family homes remains constrained. As a result, even with a slowdown in sales during 2022, the local inventory of homes for sale was still at a very low, 1.4 months’ supply in December 2022 (GRAR, 2023).
Figure 2 - Housing Units Building Permits in the Grand Rapids Metro Area vs. Nation
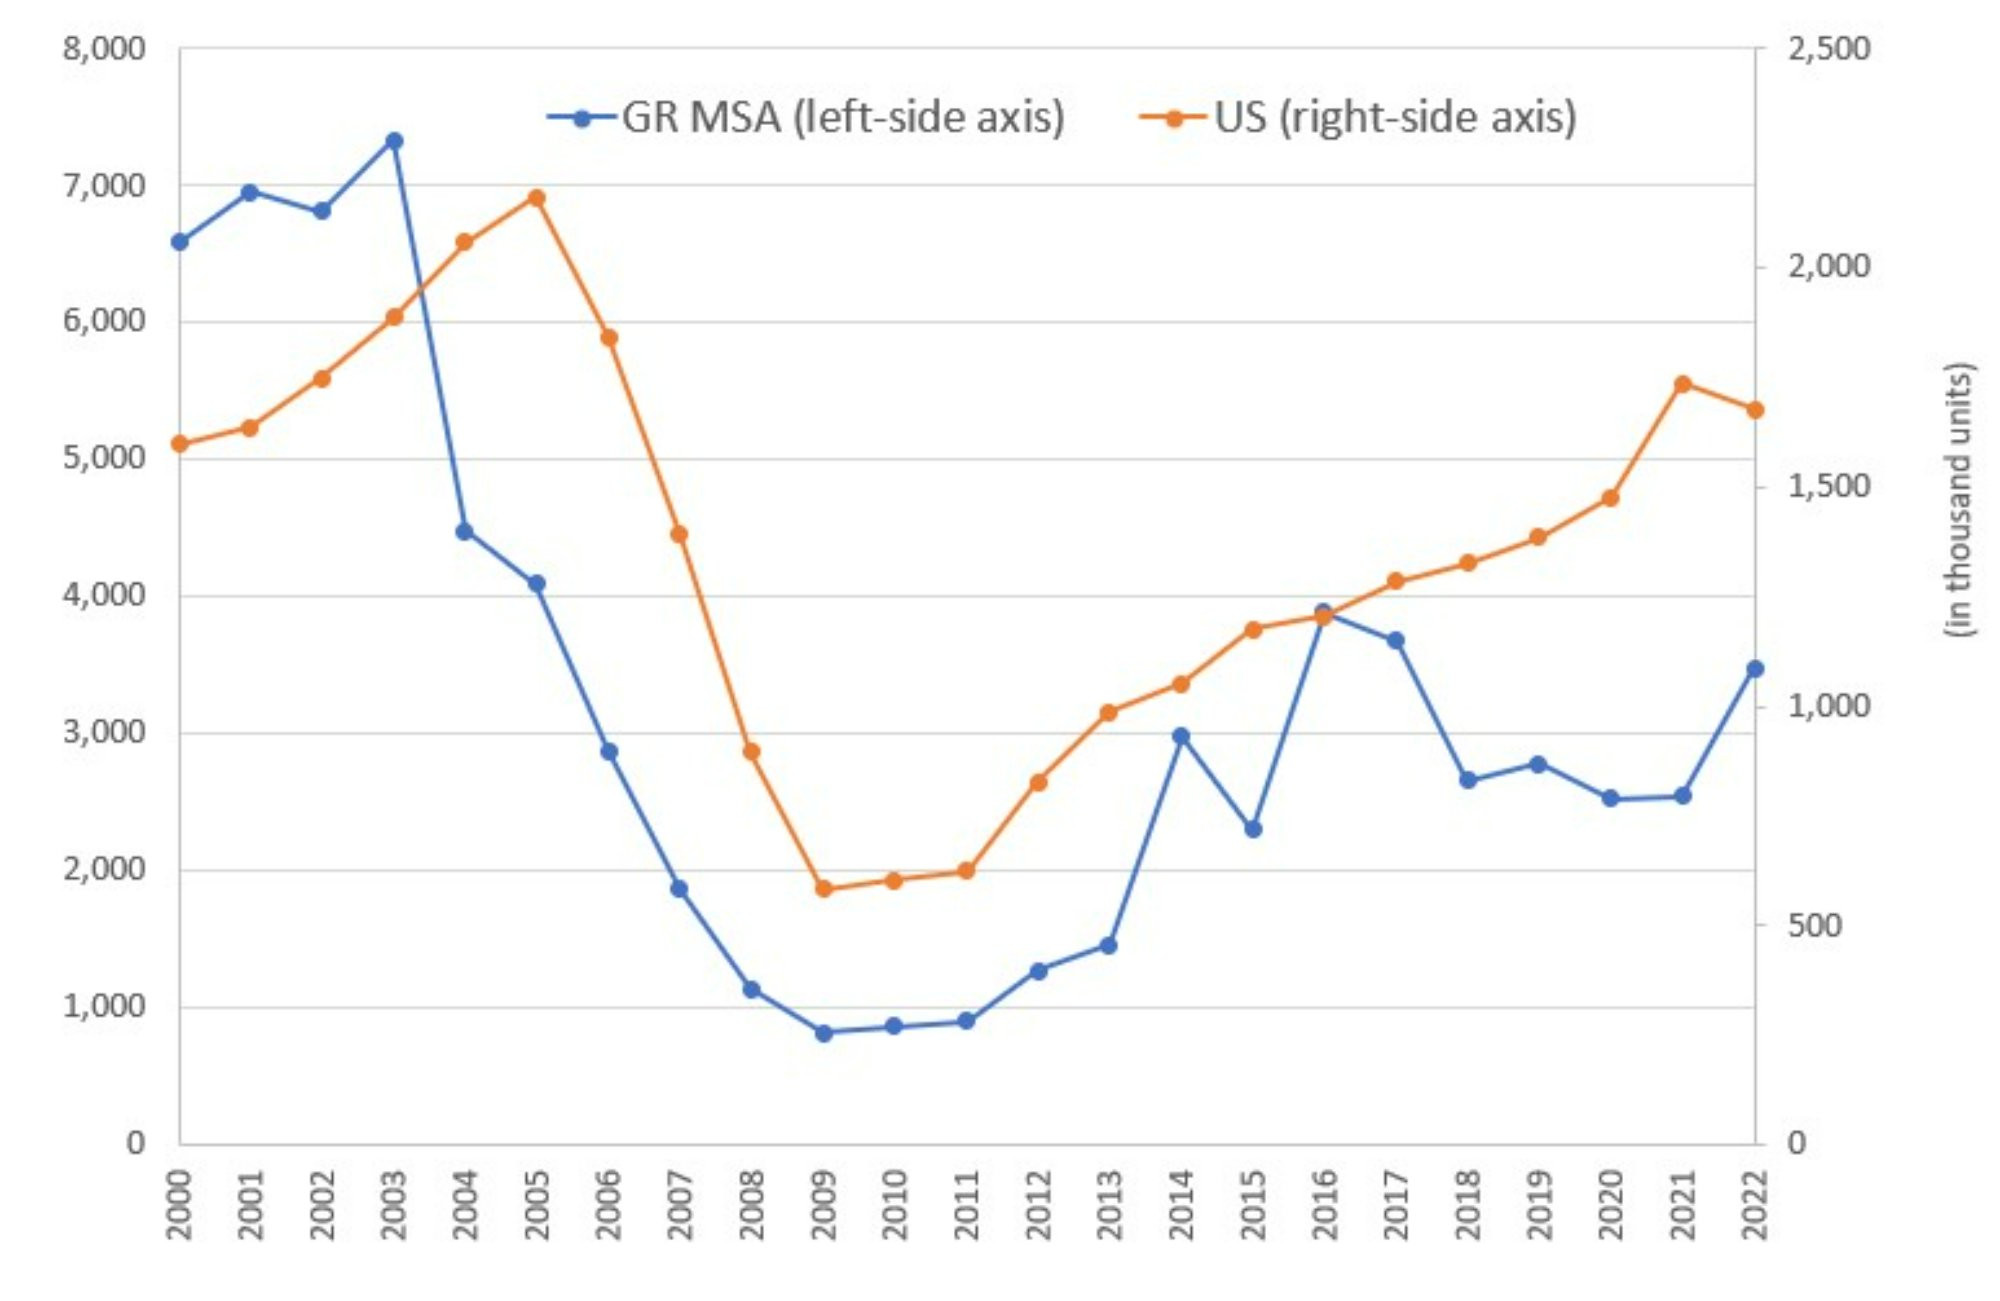
Note: the Grand Rapids metropolitan area includes Kent, Ottawa, Barry, and Montcalm counties.
For 2022, values are the annual rates based on seasonally adjusted data until November.
Source: Federal reserve Bank of St. Louis (2023)
The effects of rising mortgage rates on the local housing market can be seen in the sales data. The Grand Rapids Association of Realtors reported that sales in 2022 were 11.7% lower than in 2021 (GRAR, 2023). Regarding prices, our quarterly estimated indexes show slight decreases in the 3rd quarter of 2022 (Figure 3). In the 4th quarter, the index continued to drop for the City of Grand Rapids, but it recovered for the northern and eastern municipalities, indicating that competition remains strong in those areas as the inventory of homes for sale remains low.
Figure 3: Quarterly Housing Price Index (HPI) for Grand Rapids Areas (2019-2022)
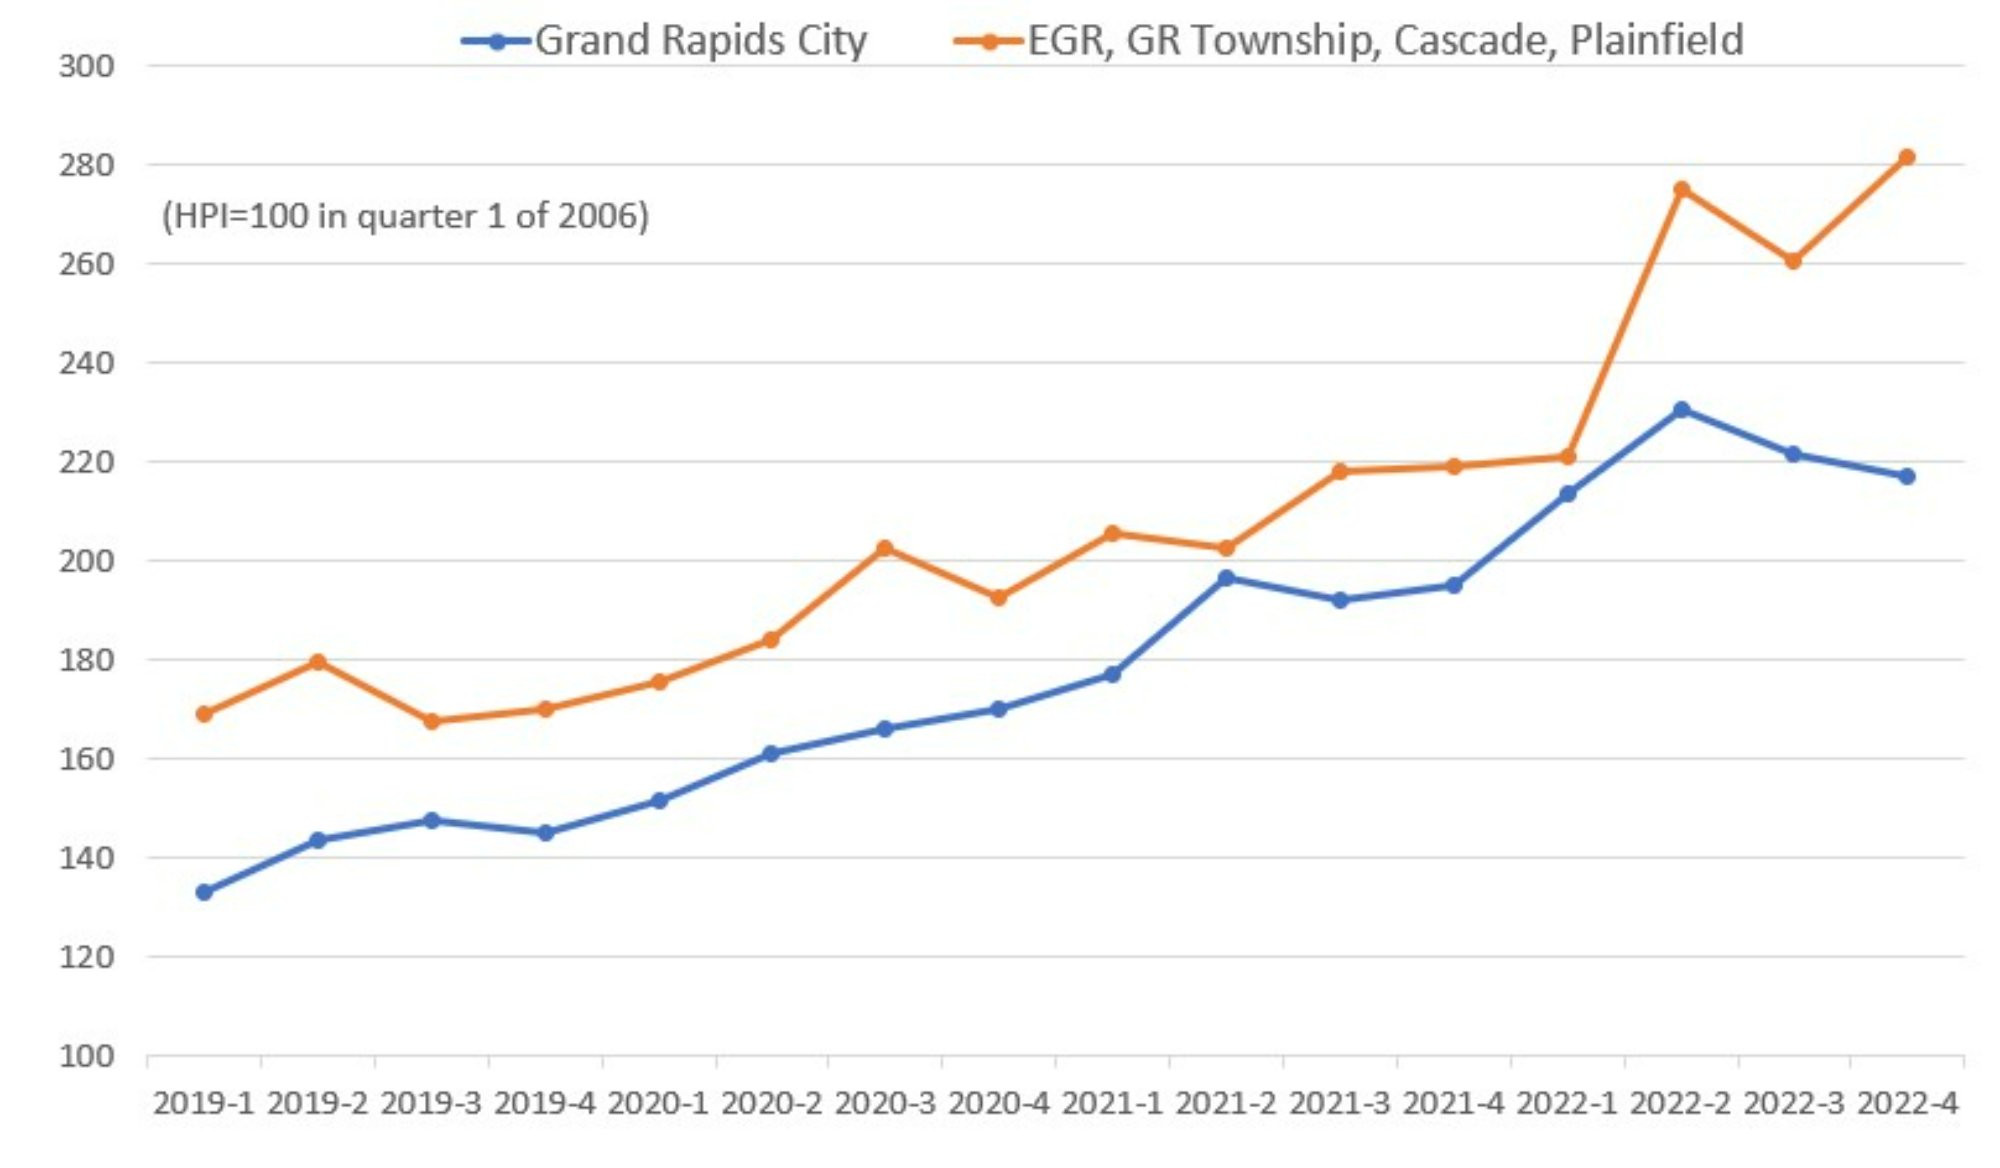
Note: The municipalities included are City of East Grand Rapids (EGR), Grand Rapids (GR) Township, Cascade Township, and Plainfield Charter Township (see Technical Notes at the end of the article for details).
Source: Sales data retrieved from BS&A Software (2023)
One notable issue is that median home prices, both in Grand Rapids and in the nation, have been dropping during the second half of the year. However, while the national S&P/Case-Shiller repeat-sales index shows decreasing home prices recently (by 2.0% from June to October), our local indexes still show growth in some areas. This dichotomy is indicative of strong demand in the region that is shifting to homes that are smaller or have fewer amenities, whereas nationally the overall demand has weakened enough to cause prices to decline.
Conclusions
In 2022, home prices grew even faster than in previous years in the region, reflecting a strong demand for housing together with a persistent low supply of homes for sale despite higher construction activity in the past year. In recent months, rising mortgage rates have slowed down the rate of home sales, but prices seem to be holding. This indicates that home prices may not go down much in the next year given the strength of local demand factors. These local factors contrast with the national scenario, where construction has slowed down in 2022 and prices have decreased recently.
Technical Notes
The housing price indexes shown in Figures 1 and 3 are estimated using the repeat-sales method which compares prices of the same houses as they are resold over time. Data from January 2000 to September 2022 were used. The indexes were set at 100 in 2006, so that they can be interpreted as the amount of money needed to buy a house for every $100 that was needed to buy the same house in 2006. The repeat-sales method is a way to control for variation in the quality of the different houses sold in each period. The method excludes houses that were not resold during the period of analysis but also disregards the impact of improvements or deterioration of each house and/or neighborhood. Nonetheless, it is widely used to measure average price changes in a broad housing market.
In order to better measure the changes in market conditions for typical homes, we excluded:
- parcels sold for less than $30,000 or that never reached a sale price of at least $50,000
- parcels with prices that reached more than $1,000,000
- parcels transferred from or to a government, nonprofit, or financial institution (typically non-market transactions), and
- parcels that had large variation in prices (usually the case when they were developed or redeveloped).
For Figure 3, it should also be noted that there is a relatively small number of repeat-sales per quarter, making estimates less accurate.
Last, it is worth noting that the repeat-sales method may bias price changes upward if houses that are repeatedly sold have significant quality improvements between sales (some deterioration is expected over time, but quality can still rise due to improvements like basement and kitchen remodeling, flooring upgrades, etc.). This might have been the case during the last decade in the market areas covered in this study. For comparison, median sales prices have grown less than our indexes in these areas.
References
BS&A Software (2023). Property Sale Search Data. Retrieved from
https://bsaonline.com/MunicipalDirectory, January 8, 2023.
Federal Reserve Bank of St. Louis (2023). FRED Economic Data [Data files: CES0500000003, CPIAUCSL, CSUSHPISA, EXHOSLUSM495S, GRAN326BPPRIVSA, GRAN326LFN, GRAN326URN, HOUST, LAUMT262434000000005, MORTGAGE30US, PERMIT, and UNRATE]. Retrieved from
https://fred.stlouisfed.org, January 19, 2023.
GRAR - Greater Regional Alliance of Realtors (2023). Comparative Activity Report December 2022. Retrieved from
https://www.grar.com/monthly-market-update, January 11, 2023.