Digital Assessment Study for Kent County
By Christopher John Cruz, Ph.D., Assistant Professor,
Department of Economics
Paul Isely, Ph.D., Associate Dean, Seidman College of Business
Note: This is an abridged version of the full report.
Introduction
The COVID-19 pandemic has exposed many racial and socioeconomic disparities and divides with respect to access to digital technology across the globe. As people were forced to stay home at the height of the pandemic, the importance of access to and adoption of digital technology became more critical in activities related to remote working and learning, telehealth appointments and online ordering. But even in the wealthiest country in the world, the divide between those who have access to digital technology and those who don’t, remains quite stark. Estimates from the Federal Communications Commission (n.d.) show that nearly 30 million Americans cannot reap the benefits of the digital age because of accessibility issues. While 97 percent of Americans in urban areas have access to high-speed fixed service, that number falls to 65 percent in rural areas. Worse, on tribal lands, barely 60 percent have access. Globally, the digital divide appears to be prevalent. Research from the Pew Research Center shows that younger people, those with higher incomes, and those in wealthier countries are more likely to be digital technology users (Schumacher & Kent, 2020).
In Grand Rapids and Kent County more broadly, we have very limited information on residents’ access and adoption of technology. In response, the Seidman College of Business, in partnership with the City of Grand Rapids and with the support of Mr. Fred Keller and 5/3 Bank, conducted a study to better understand the challenges and issues faced by residents of Kent County in accessing high-speed internet and digital technology. The ultimate goal of the study was to provide actionable recommendations to policymakers to address gaps in residents’ access to digital technology.
Survey Findings
The survey-based research aimed to gather information mainly from students, the elderly, and other vulnerable communities in Kent County. Survey data was collected using traditional paper surveys as well as online surveys via Qualtrics. It may be noted that the traditional paper surveys are particularly important to reach residents who have no internet access especially given the topic of this study.
Table 1 shows the basic demographic characteristics of the survey sample. Combining both paper and online surveys, the sample reached more than 2,400 respondents. The sample is predominantly white and non-Hispanic. Blacks account for almost 11 percent of the sample, followed by Hispanics at 5 percent, and Asians at 1 percent. More than a quarter of respondents claim to be mixed race. Meanwhile, the majority of the sample obtained at least a four-year college degree (62 percent) while more than a quarter claim to have taken some college courses. With respect to age, the majority of respondents come from the Millennial and Gen X generations, while Baby Boomers account for roughly 30 percent of the sample.
TABLE 1 - Survey Sample by Race and Ethnicity, Age, Education Level, and Gender
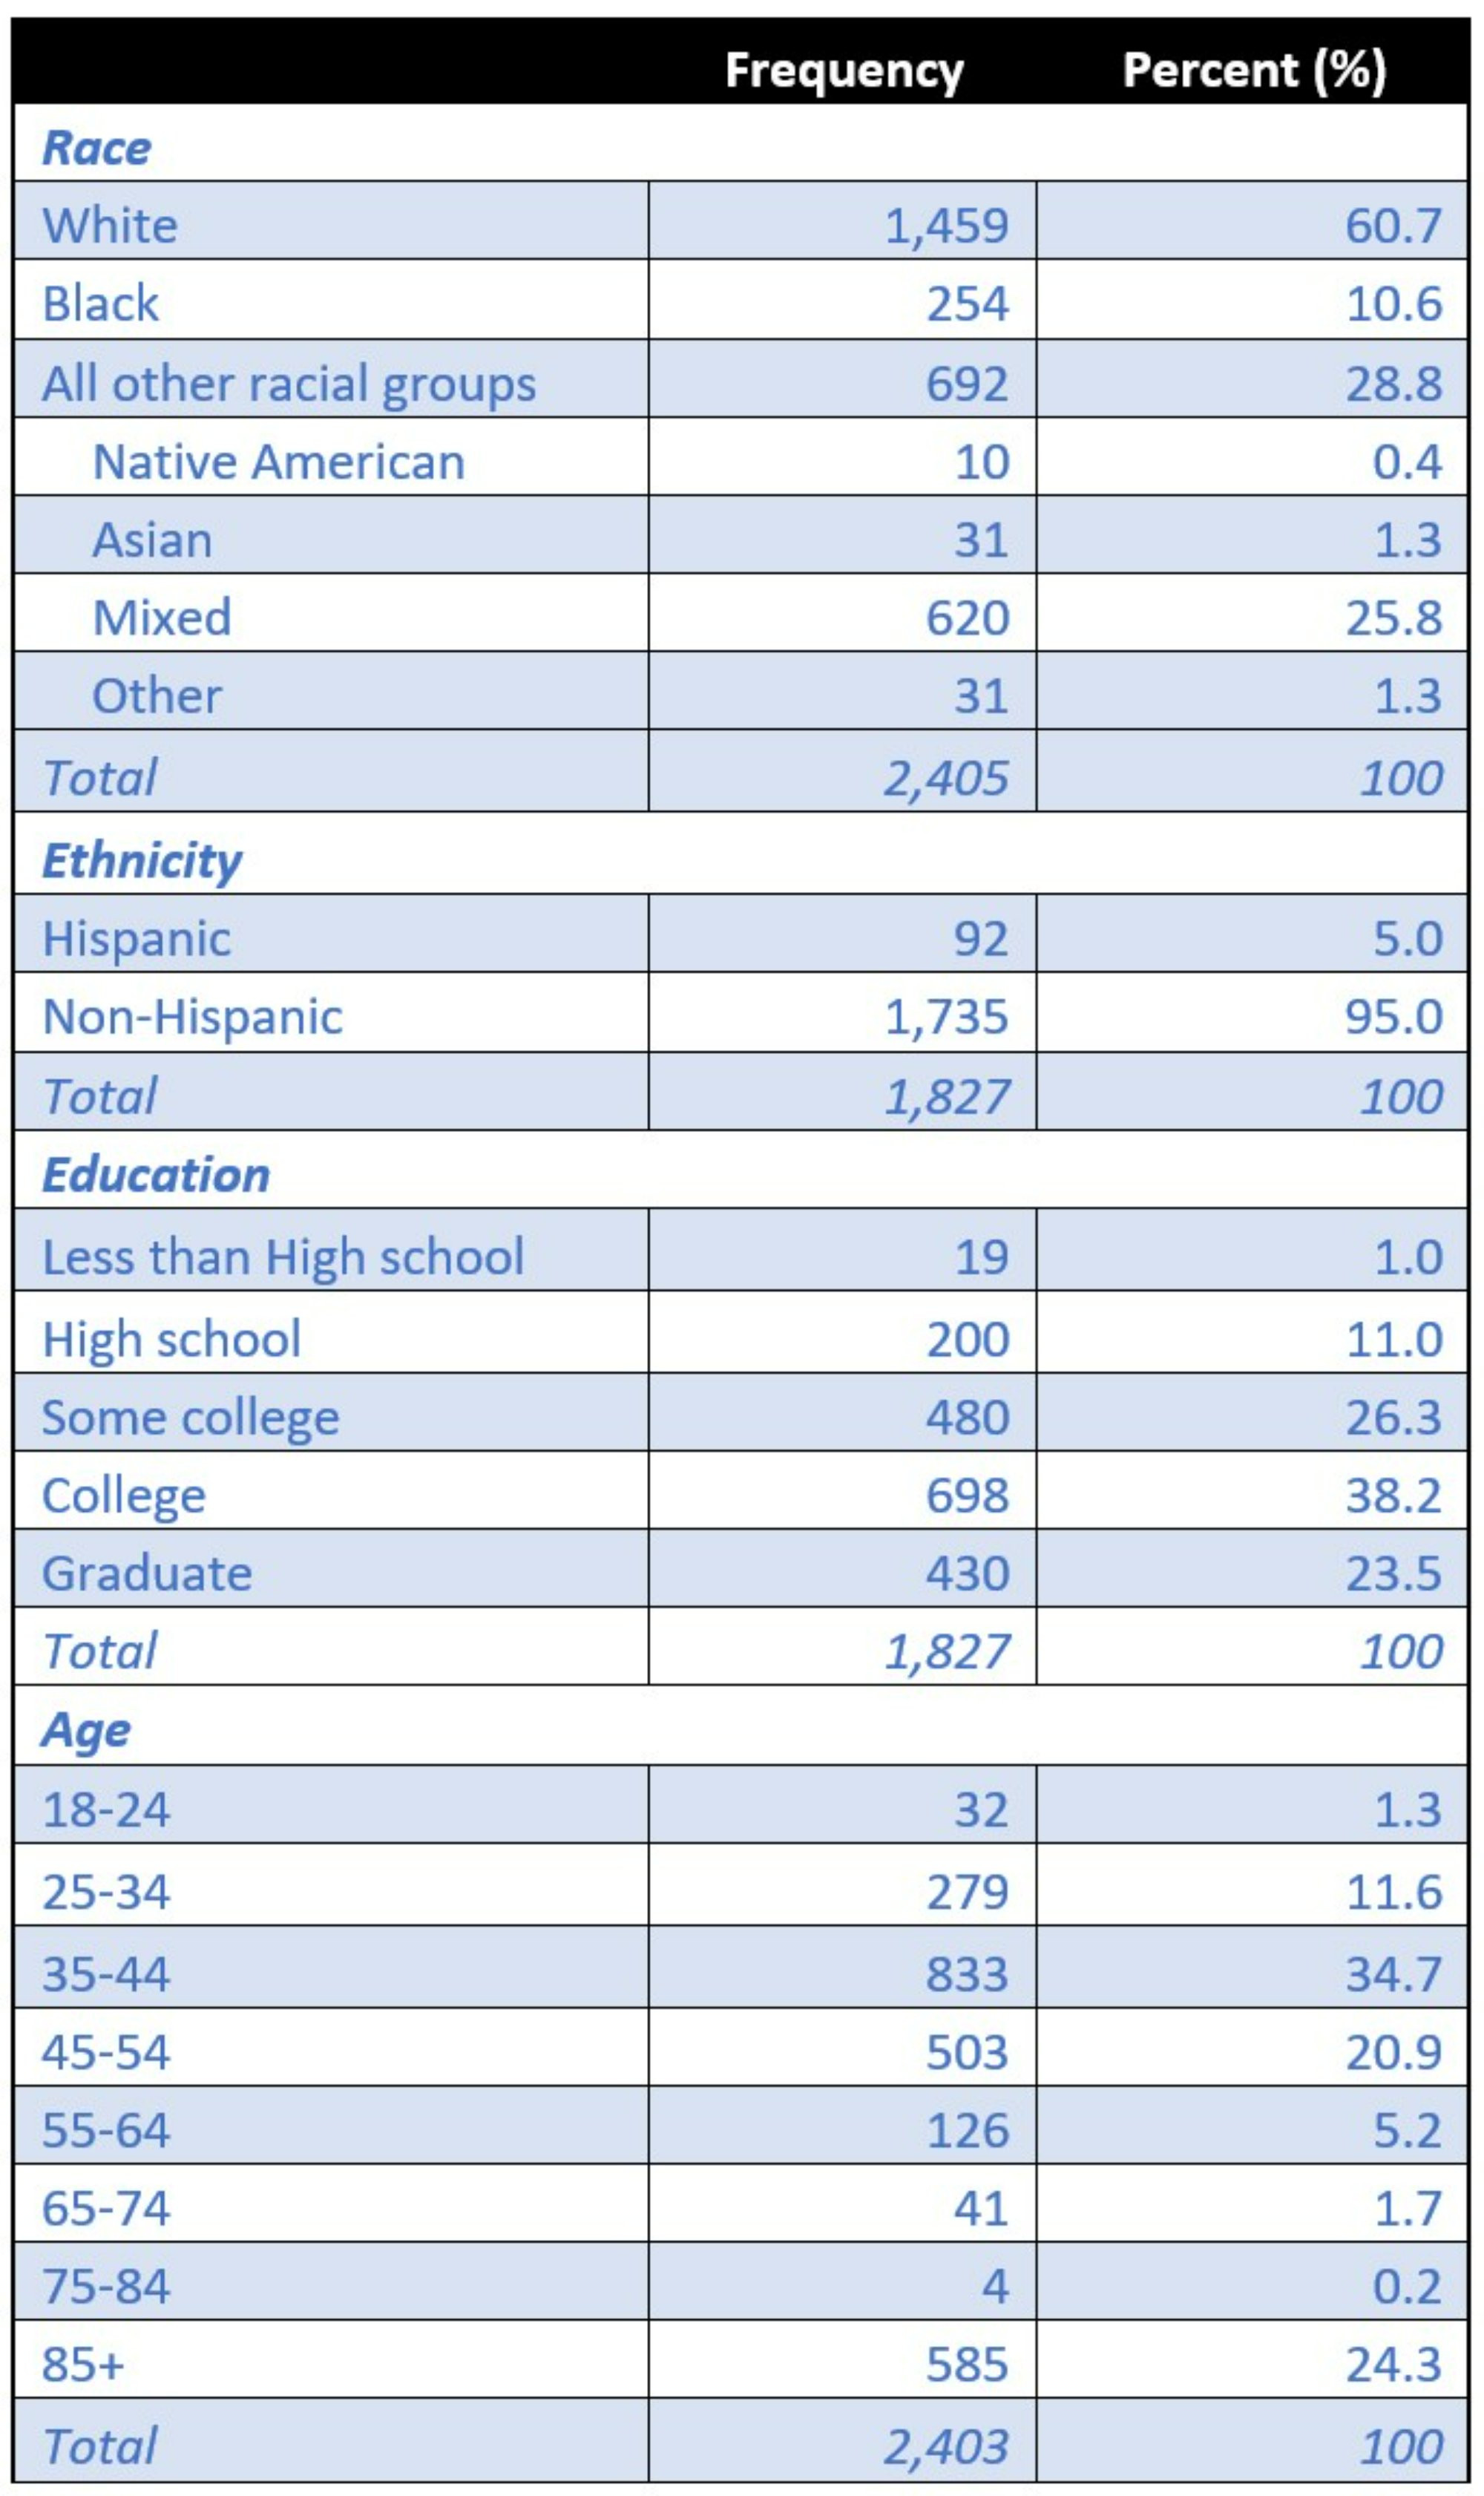
The median income level of respondents in the sample ranges from $75,000 to $100,000 annually. This range is higher than the latest median income estimates of the U.S. Census for Kent County and Grand Rapids, which stood at $65,722 and $51,333, respectively. Thus, the survey sample appears to be somewhat skewed towards higher-income households. In general, the implication of this skew is that challenges faced by lower-income household with respect to digital access and use may be understated.
The key findings of the study are as follows:
- An overwhelming majority of the sample has broadband access (84 percent), but even those who do not (10 percent) appear to have access to the internet using their mobile phones. The majority of the sample owns more than one laptop or tablet and has substantial experience using the internet or computers.
- Home broadband and mobile data are the most important options that people use to access the internet daily. Those who have no home broadband rely mainly on their mobile data to access the internet, with less than 10 percent also relying on either their friends or public internet access points (e.g., parks, public libraries, retail places). These public locations are more important to minority respondents, particularly Hispanics.
- Workplaces and schools are also key locations where respondents access the internet whether or not they have broadband at home. Among those who have smartphones, the majority have unlimited data plans and about 12 percent use pre-paid data, while 2 percent have no data service.
- While the majority of the sample has “good” internet, about a quarter have less-than-ideal internet speeds especially in the case of multi-person, multiple device households engaged in activities like streaming and online classes/meetings.
- Although a majority of respondents are satisfied with their internet, about 20 percent are not, possibly due to low internet speeds and cost considerations. In particular, a sizeable fraction of respondents indicate that they are currently paying more than the amount they are willing to pay if given the choice. In this case, they may have interpreted the idea of “willingness to pay” to refer to the internet cost that is appropriate for their specific economic situation or for the quality of internet service they are getting. In any case, those earning less than $100,000 annually are willing to pay at most $51-75 per month for home internet, while those earning more are willing to pay $76-100 per month.
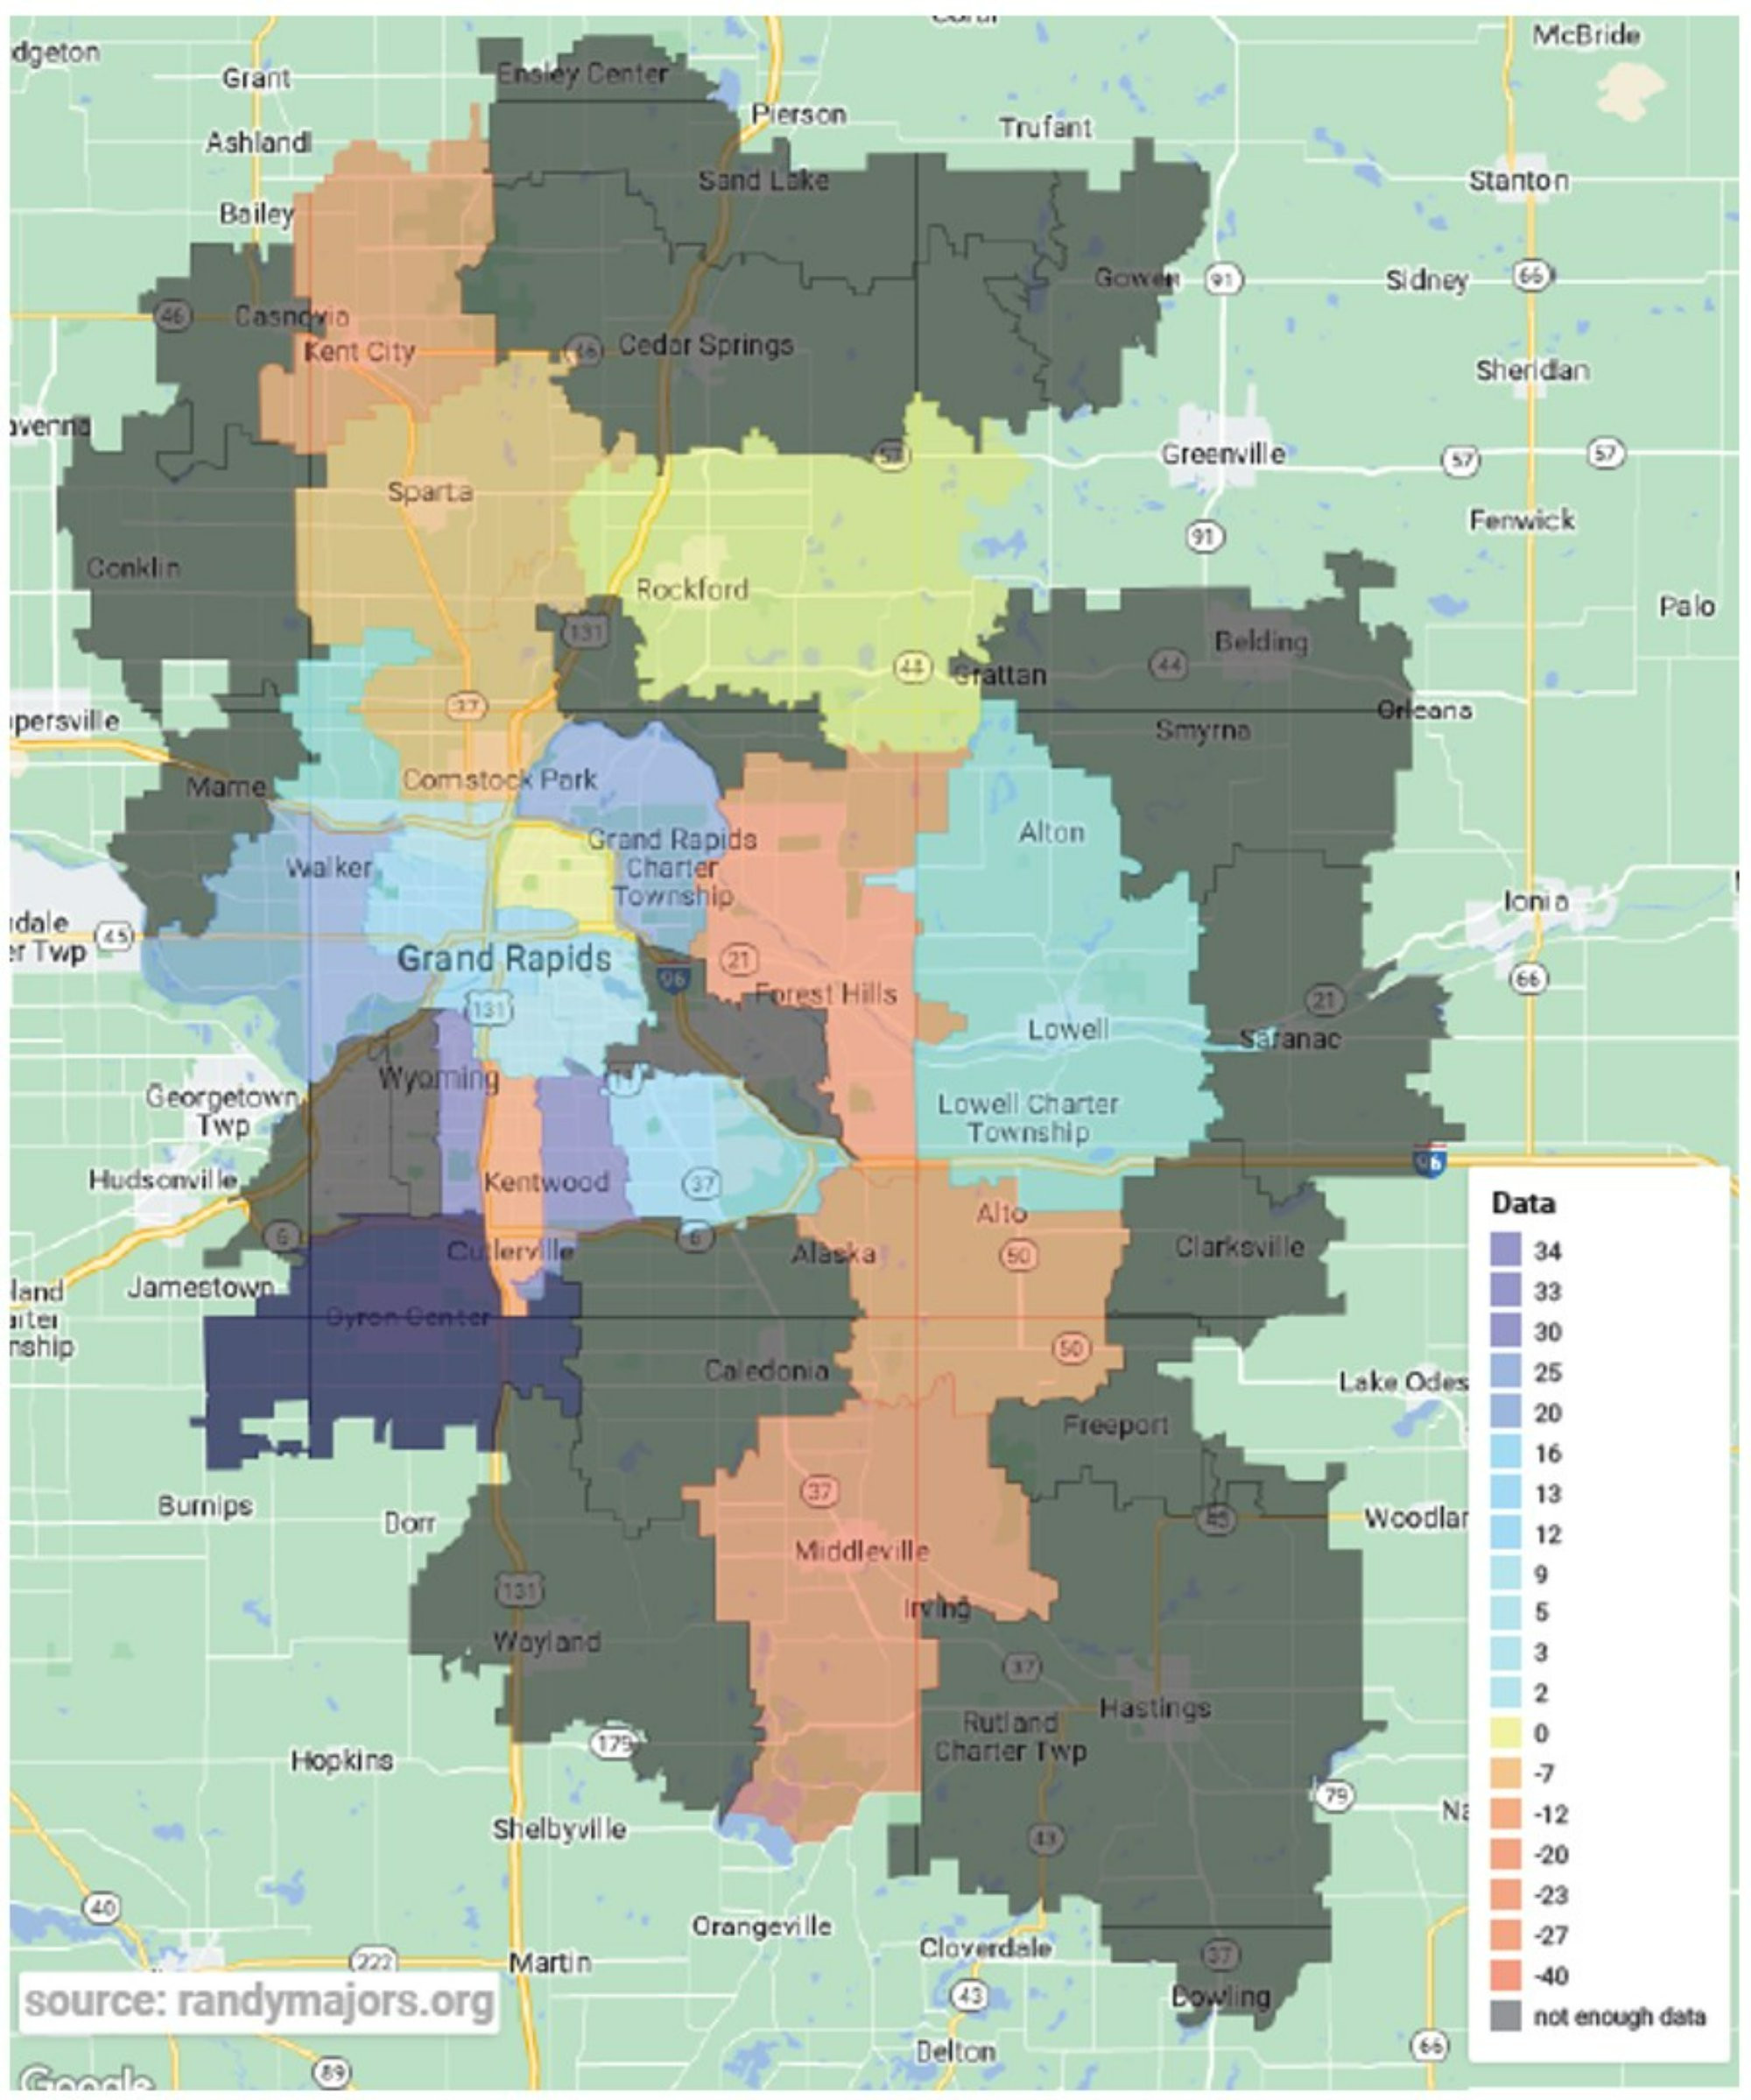
By area, cities and larger municipalities appear to perform better in terms of internet satisfaction, while those in rural areas tend to be more dissatisfied with their internet service. Figure 1 shows the diffusion index, which is the difference in the fraction of respondents who are satisfied with their internet and those who are not for each zip code.1 These data indicate some variation in the computed index. Some of the cities with a larger proportion of satisfied respondents (positive diffusion index, shaded blue) include Grand Rapids, Byron Center, Cutlerville, Kentwood, and Wyoming, among others. Most of the territories with a larger fraction of dissatisfied respondents (negative diffusion index, shaded orange or red) are rural areas outside of Grand Rapids.
Meanwhile, areas in yellow have a diffusion index equal to zero, indicating that the proportions of satisfied and dissatisfied respondents are the same. It may be noted that zip codes without sufficient sample sizes are shaded dark gray.
Figure 1 - Internet Satisfaction Diffusion Index Map
- With respect to internet download speeds, there appears to be a 50-Mbps threshold that correlates with internet satisfaction. Users with download speeds greater than 50 Mbps express much greater satisfaction than those with speeds below this threshold.
- Across racial groups, a small fraction of respondents expressed concerns about their children’s difficulties with homework completion or attendance in online classes due to either lack of access to computers or good internet connection. Given the high levels of ownership of devices and home broadband, this level of dissatisfaction may reflect, in part, the quality of computers and speed of internet respondents have at home.
- Unlike White respondents, minority respondents noted that their children’s computer skills are not sufficient to complete their homework on their own, or that they themselves do not have sufficient computer skills to assist their children. Minorities also noted issues with their children’s ease of access to internet services in public or school libraries.
- Respondents tend to use both smartphones and laptops to perform work-related tasks, while students mainly use laptops for school-related activities. For other activities including those related to health, accessing city services, shopping, getting information, and social media, people mostly reported using their smartphones.
- When asked about health-related questions, almost all respondents noted that they use the internet to access medical information. Moreover, less than three-quarters use the internet to consult their health care provider (telemedicine). Blacks tend to participate in telemedicine to a lesser degree compared to the other racial groups.
- More than 90 percent of all respondents are able to do tasks requiring basic skills (e.g., conducting internet searches) and intermediate skills (e.g., blocking spam, adjusting privacy settings). However, minorities (e.g., Blacks, Hispanics) still face some challenges when it comes to protecting their devices from spam and phishing attempts.
- While people recognize the importance of internet access in their daily lives, cost appears to be a major issue for a significant number of respondents.
Recommendations
Overall, these findings point to the need for the following:
- Reduce the financial burden of monthly internet costs especially to lower-income households. This can be in the form of direct assistance to target households or through some form of partnership with internet service providers. Government assistance can also allow households suffering from low download and upload speeds to access better service packages from their internet providers.
- Take a closer look at the quality of computers that children use as well as the level of computer skills that children learn in schools. Cheaper laptops may not have the necessary features needed to seamlessly complete schoolwork and projects. Lower-income households can particularly benefit from any form of technology assistance from the government.
- Expand the number of households with broadband service. Among those who have no home broadband, reliance on mobile data can make it difficult to complete schoolwork, search for jobs, or engage in telemedicine.
- Enhance internet access in public areas to ease the burden of those with no home broadband or those who have limited mobile data plans.
- Design programs that can improve the computer and internet knowhow of adults, particularly those coming from minority households. This will not only allow them to better assist their children in their schoolwork, it will also elevate their online activities and computer skills.
Technical Notes
[1] The sample size for certain zip codes are not sufficiently large and are thus hidden.
References
Federal Communications Commission. (n.d.) Bridging the digital divide for all Americans. Retrieved from https://www.fcc.gov/about-fcc/fcc-initiatives/bridging-digital-divide-all-americans (last visited May 1, 2021).
Schumacher, S. and Kent, N. (2020). 8 charts on internet use around the world as countries grapple with COVID-19. Retrieved from https://www.pewresearch.org/fact-tank/2020/04/02/8-charts-on-internet-use-around-the-world-as-countries-grapple-with-covid-19/