Grand Rapids Housing Market – 2021 In Review
By Laudo M. Ogura, Ph.D., Associate Professor, Department of Economics
Paul Isely, Ph.D., Associate Dean, Seidman College of Business.
Since the start of the COVID-19 pandemic last year, housing price growth accelerated despite the initial slowdown. This large increase in prices both at the national and regional levels is a result of many factors, from low mortgage rates to low supply of available houses for sale and increased preference for single-family, larger homes due to the COVID-19 mobility restriction measures. Another factor, unrelated to the pandemic, is that millennials have entered their age range for transitioning to homeownership, thus adding to the demand for houses.
Table 1 summarizes the housing market conditions in the U.S. and in the Grand Rapids area in the last couple of years. In the nation, housing prices have gone up by 16% in 2021, with sales increasing by 7.6% and construction starts increasing by 13.4%. Lower mortgage rates and lower unemployment rates have helped boost housing demand. However, inflation has spiked, reaching an average of 4% in 2021 due to pent-up demand and supply chain disruptions caused by the pandemic. This has put upward pressure on interest rates, which have already risen from a low of 2.65% at the start of the year to 3.14% by late October.
Table 1 - Economic and Housing Market Conditions
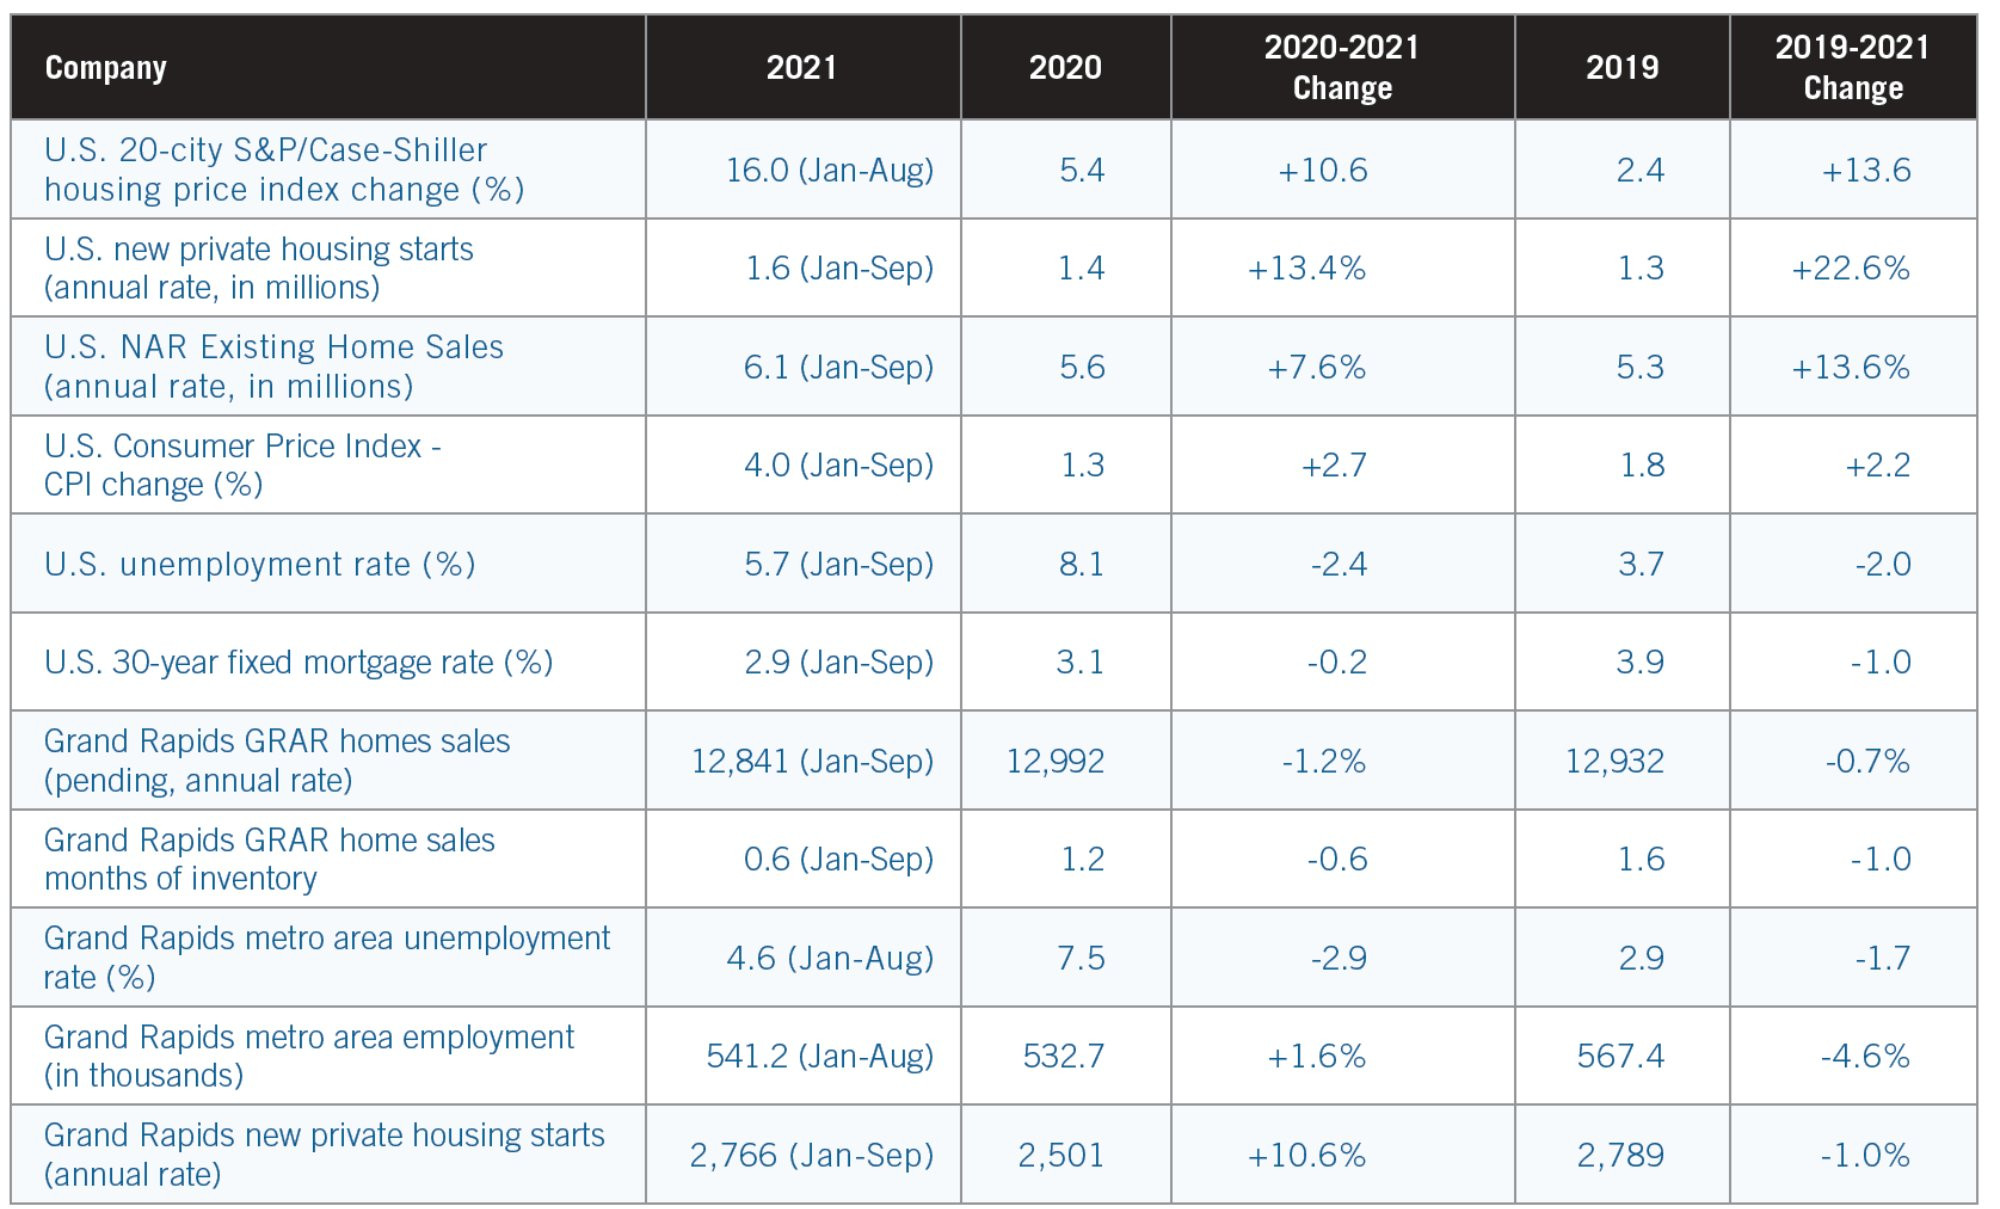
The Grand Rapids metropolitan area includes Kent, Ottawa, Barry, and Montcalm counties.
Annual data represents the average rate for the year.
Sources: GRAR (2021) and Federal Reserve St. Louis (2021), using data compiled from the U.S. Bureau of Labor Statistics, U.S. Census Bureau, U.S. Department of Housing and Urban Development, Freddie Mac, National Association of Realtors (NAR), and S&P Dow Jones Indices LLC.
In the City of Grand Rapids, repeat-sale price index estimates (Figure 1) suggest that home prices rose by an average of 18% in 2021 (based on data through September) following a 15% increase in 2020. In northern and eastern municipalities of Kent County (East Grand Rapids, Grand Rapids Township, Cascade, and Plainfield), home prices rose by 17% in 2021 following a 11% rise in 2020. For the estimation of our price indexes, data was restricted to reflect market conditions for typical, non-distressed, single-family home sales (details are in the Technical Notes at the end of the article). The base period for the indexes shown in Figure 1 is 2006, the year when local housing prices peaked in the 2000s. Thus, repeat-sale housing prices have approximately doubled since 2006.
Figure 1 - Housing Price Indexes (HPI) for the Grand Rapids Area
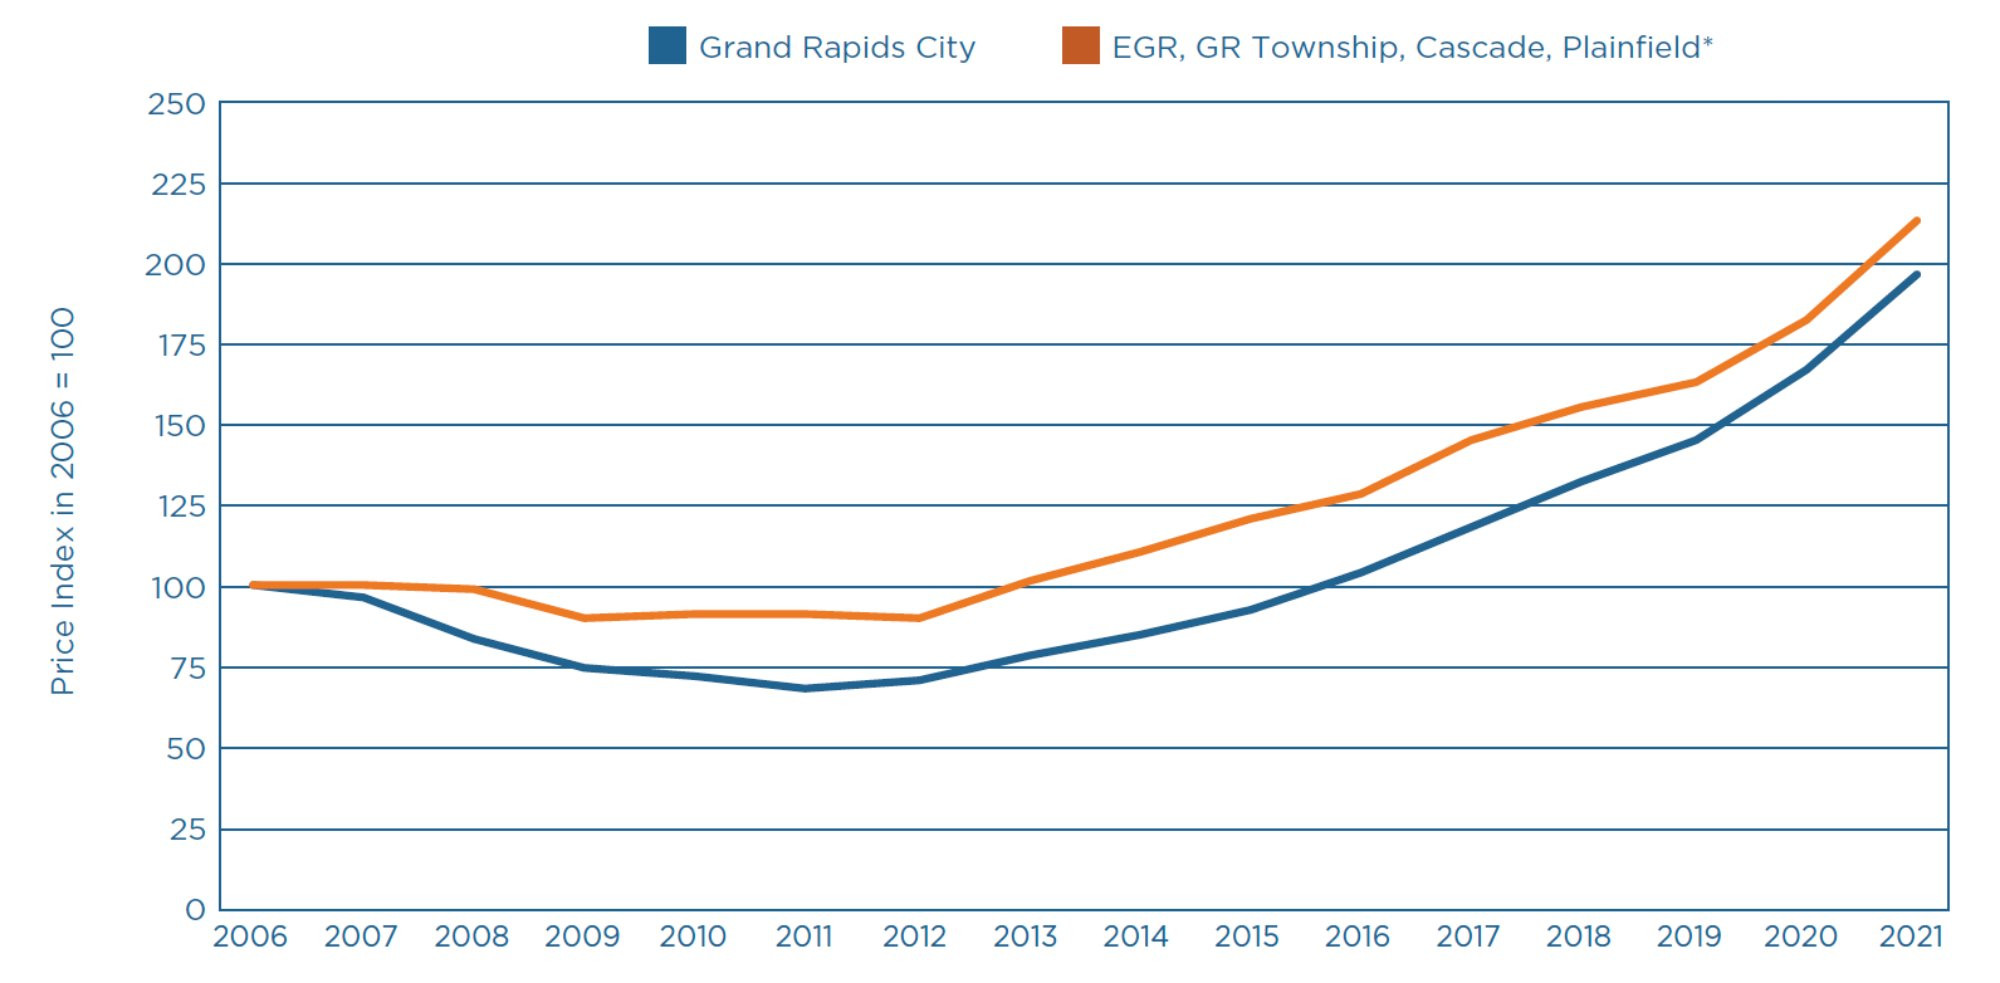
The 2021 index is based on data through September. See Technical Notes at the end of the article for details.
* The municipalities are City of East Grand Rapids (EGR), Grand Rapids Township (GR Township), Cascade Township, and Plainfield Charter Township.
Source: Sales data retrieved from BS&A Software (2021).
Our housing price index estimation shows that the recent high rate of price growth was observed even in downtown Grand Rapids (zip code 49503) despite the COVID-19 restrictions to work, school, and leisure activities, which could have affected the desire to live in central areas. The high housing price growth in the region demonstrates the strength of the local demand relative to a constrained supply, as indicated by home sales remaining at the same pace as in previous years (see Table 1).
On the demand side, the regional economy has further recovered during 2021 as shown by lower unemployment rates and growing employment (Table 1). The recovery in the labor market, however, has been hindered by declining labor force participation, with the average employment count in 2021 still 4.6% below the 2019 level. The limited supply of workers has kept wages rising at a 5% rate in 2021, the same rate as in the previous two years (labor market data is from the U.S. Bureau of Labor Statistics, retrieved from Federal Reserve Bank of St. Louis, 2021).
On the supply side, the inventory of homes for sale dropped to an extremely low 0.6 month supply in the region in 2021, according to the local realtors association (GRAR, 2021). Housing construction starts in the area have recovered from the 2020 drop, but only back to the 2019 level (see Table 1), so it has not followed the national growth trend mentioned earlier. Figure 2 shows housing construction permit trends in the region in the past two decades, with single-family permit counts remaining stable in recent years after the recovery from the earlier housing crash in the late 2000s.
Figure 2 - New Housing Units Building Permits in the Grand Rapids Metro Area
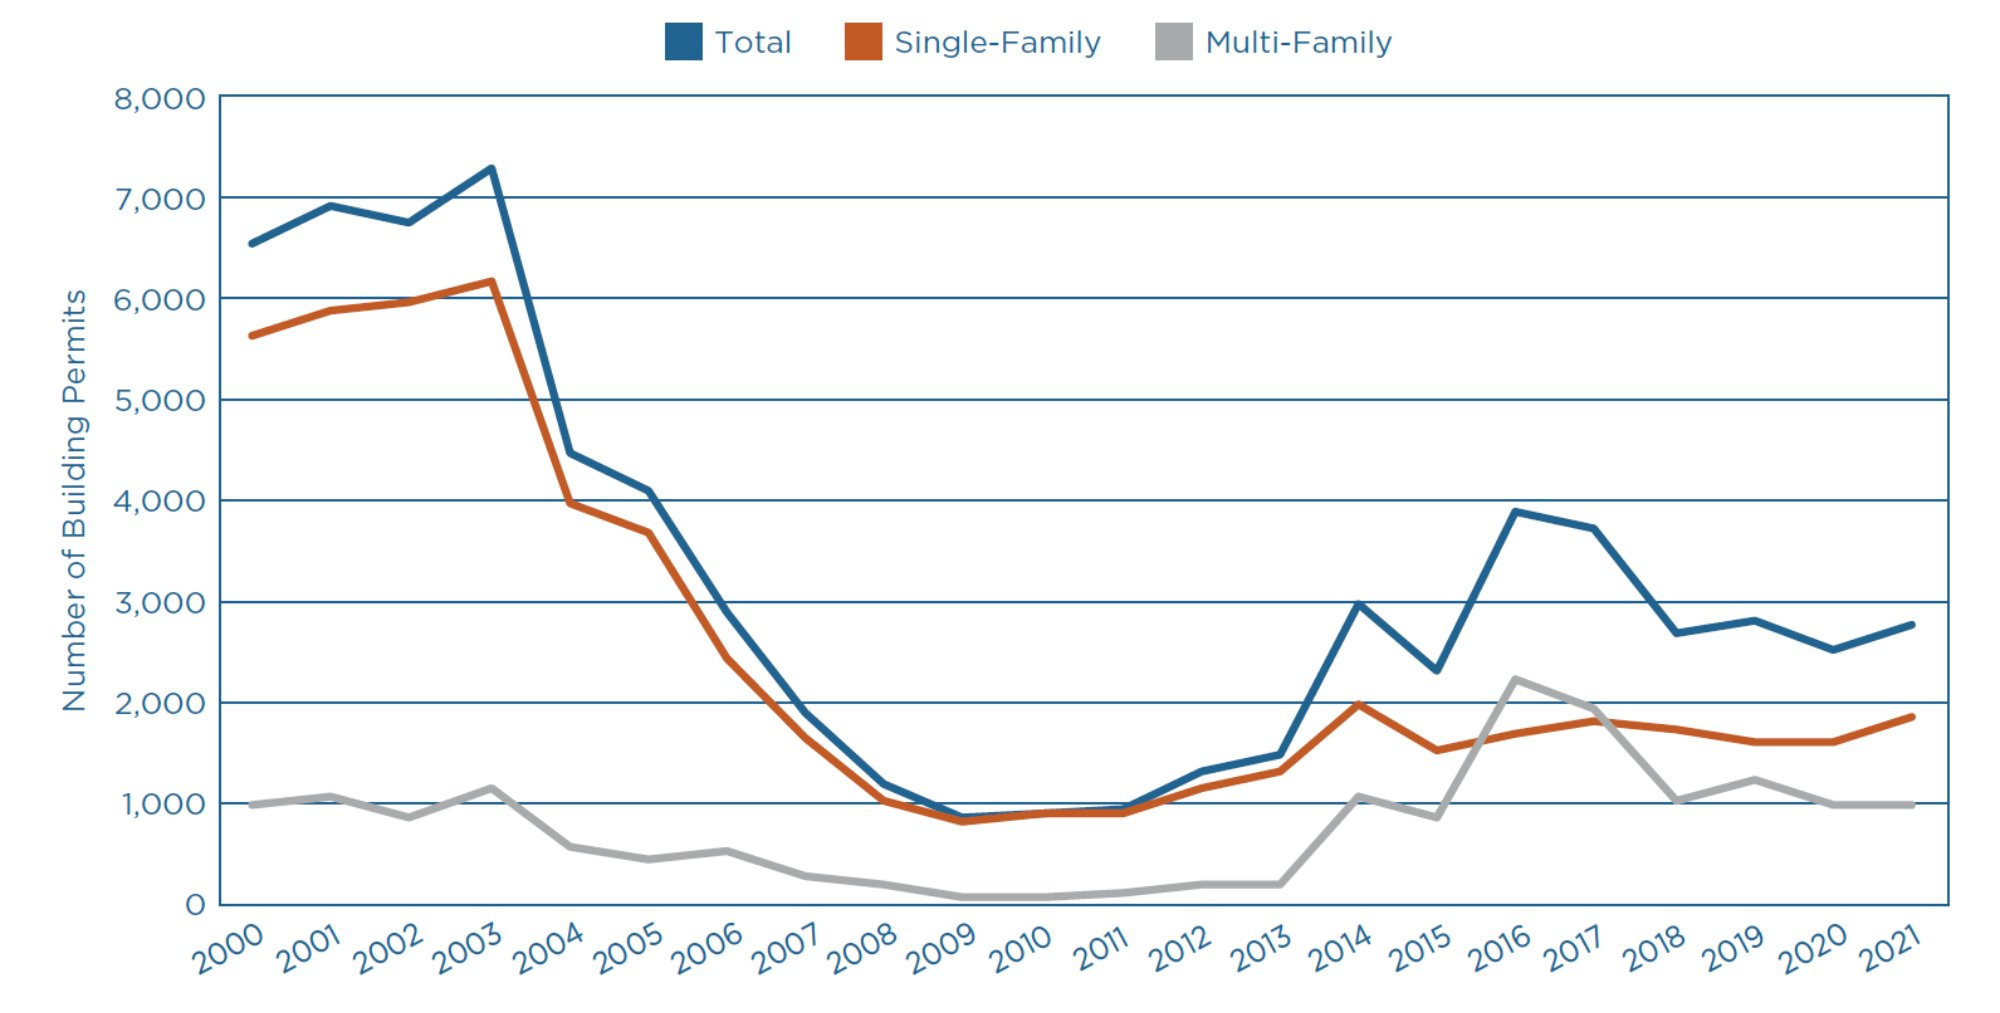
The Grand Rapids metropolitan area includes Kent, Ottawa, Barry, and Montcalm counties.
Data for 2021 is the annual rate based on seasonally adjusted data until September.
Source: Federal Reserve St. Louis (2021).
There was a temporary effect on housing markets in American cities described as the “Doughnut Effect” in a National Bureau of Economic Research (NBER) article (Ramani & Bloom, 2021). Early in the crisis people devalued living in the center city and wanted to move to settings with lower population density yet still close to the city. This was seen in large cities, but also in some cities similar in size to Grand Rapids. This effect can be observed in the changes in home prices by quarter (Figure 3). During the first three quarters of 2020 larger price growth was seen in the suburban areas around Grand Rapids as people competed for houses there. At the same time the price growth in the City of Grand Rapids slowed down as there was less competition especially in the downtown area (zip code 49503). However, this effect was short lived as the overall demand for housing in the region resulted in homebuyers then backfilling into the City of Grand Rapids in the 4th quarter of 2020. So, the driving forces of housing prices have returned to demographic pressures and tight housing stock.
Figure 3 - Quarterly Housing Price Index (HPI) for the Grand Rapids Area (2018-2021)
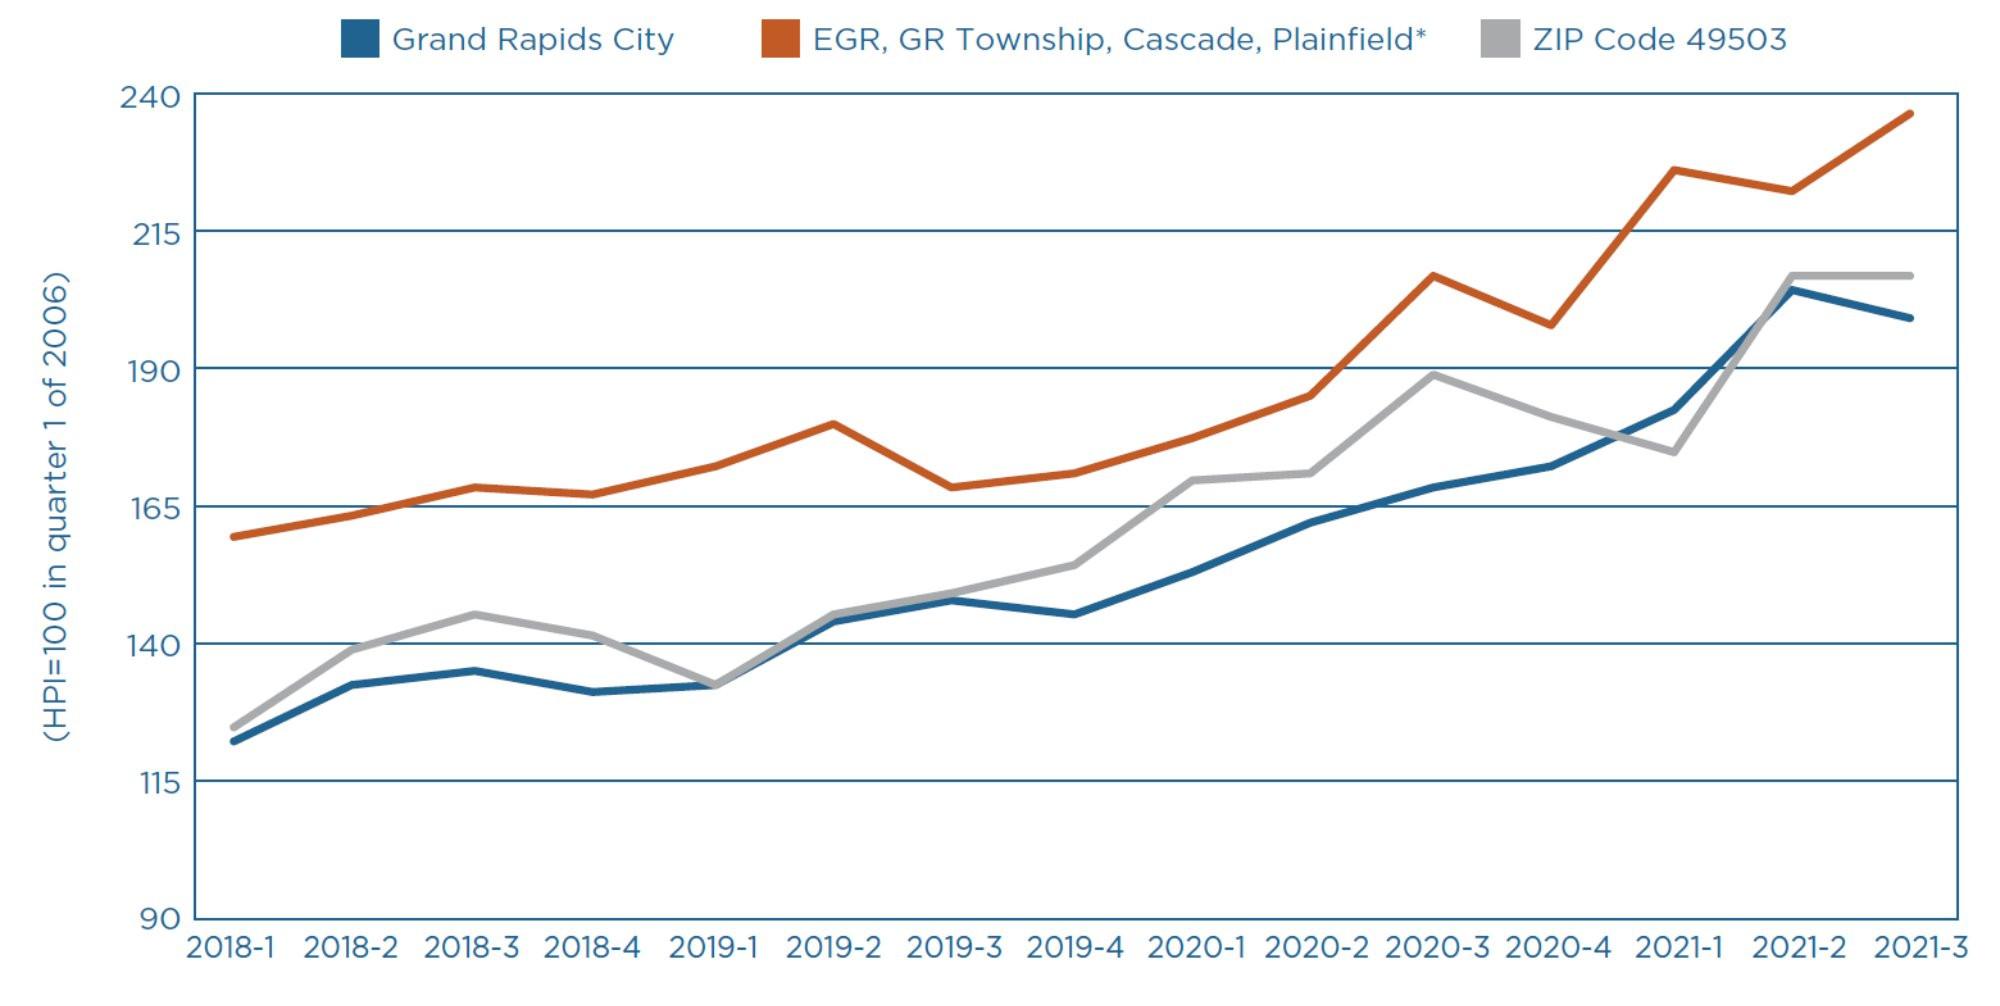
The 2021 index is based on data through September. See Technical Notes at the end of the article for details.
* The municipalities are City of East Grand Rapids (EGR), Grand Rapids Township (GR Township), Cascade Township, and Plainfield Charter Township.
Source: Sales data retrieved from BS&A Software (2021).
Conclusions
Home price growth accelerated during 2021 in the Grand Rapids region, but home sales and construction starts stayed relatively stable compared to past years, indicating that prices grew even faster in 2021 as result of rising demand together with a persistent limited supply. Low mortgage rates, pent up demand, growing preferences towards homeownership and mid-size urban areas, along with demographic changes (the transition of millennials to homeownership) have pushed demand up. Inventory of homes for sale dried up further and construction activity remained stable despite growth at the national level. In the near future, the combination of low home sale inventories and moderate construction activity along with rising mortgage rates should keep prices rising but at a slower pace.
References
BS&A Software (2021). Property Sale Search [Data file]. Retrieved from https://bsaonline.com/MunicipalDirectory
Federal Reserve Bank of St. Louis (2021). FRED Economic data [Data files CPIAUCSL, CSUSHPISA, EXHOSLUSM495S, GRAN326BP1FH, GRAN326BPPRIVSA, GRAN326LFN, GRAN326URN, HOUST, LAUMT262434000000005, MORTGAGE30US, SMU26243400500000011SA, and UNRATE]. Retrieved from https://fred.stlouisfed.org
Greater Regional Alliance of Realtors – GRAR (2021). Monthly Market Update - Comparative Activity Report September 2020. Retrieved from https://www.grar.com/monthly-market-update
Ramani, A. & Bloom, N. (2021). The Donut Effect of Covid-19 on Cities, NBER Working Papers 28876.
Technical Notes
The housing price indexes shown in Figures 1 and 3 are estimated using the repeat-sales method which compares prices of the same houses as they are resold over time. Data from January 2000 to September 2021 were used. Indexes were set at 100 in 2006, so that they can be interpreted as the amount of money needed to buy a house for every $100 that was needed to buy the same house in 2006. The repeat-sales method is a way to control for variation in the quality of the different houses sold in each year. The method excludes houses that were not resold during the period of analysis but disregards the impact of improvements or deterioration of each house and/or neighborhood. Nonetheless, it is widely used to measure average price changes in a broad housing market. In order to better measure the changes in market conditions for typical homes, we excluded the following type of sales: non-residential parcels, parcels sold for less than $30,000 or that never reached a price of at least $50,000; parcels with prices reaching more than $1,000,000; transfers from or to government, nonprofit, or financial institutions (these reflect non-market transactions); and parcels that had large variation in prices, usually the case when parcels were developed or redeveloped. In Figures 1 and 3, it should be noted that other municipalities in Kent County have a relatively small number of repeat sales per year, making the estimates less accurate.