Education and Job Growth
By Cody Kirby, Ph.D., Visiting Faculty, Department of Economics, Seidman College of Business, Grand Valley State University
In the sections that follow, we find evidence of increased population growth in West Michigan, coupled with an aging population and higher disease prevalence, which place upward pressure on healthcare demand. We anticipate that this will lead to higher healthcare costs and increased hospital utilization. In this section, we examine labor's capacity to meet the increased demand for healthcare. We begin with a discussion of job growth in the U.S. and Michigan, specifically in Grand Rapids and Detroit. We find evidence of healthcare employment growth in Grand Rapids that resembles the national average.
Furthermore, we find that healthcare employment, as a share of total employment, has increased since the start of the Great Recession in 2005, potentially due to increases in inflation-adjusted earnings among healthcare professionals. Lastly, we analyze the top 10 healthcare occupations with the highest turnover to shed light on current healthcare shortages in West Michigan. We find that, on average, shortages in West Michigan are less severe than those observed nationally. However, we do not anticipate that these shortages will abate anytime soon, as in many occupations, inflation-adjusted earnings are not keeping pace with national expectations.
Data for the U.S., Michigan, Grand Rapids, and Detroit come from the U.S. Bureau of Labor Statistics (BLS) and the Michigan Department of Technology, Management, and Budget (MDTMB). Specifically, the data on total non-farm payroll employment, industry employment, and earnings come from the BLS. Data on different healthcare occupations, including employment, earnings, replacement, and job growth, are derived from the BLS's and MDTMB's long-term employment projections. The national projection estimates rely on historical data spanning 2008 to 2018, 2010 to 2020, and 2020 to 2030. Meanwhile, state-level projection data comes from estimates covering 2000 to 2010, 2010 to 2020, and 2014 to 2024.
Many data transformations are required to return a balanced dataset suitable for occupational comparison. First, any series with missing internal values is imputed using the mean. Secondly, if observations are missing at the sample bounds, then historical growth rates are applied. Any occupation for which more than 40 percent of the data is missing is excluded from analysis. Third, all earnings measures are adjusted for inflation using the consumer price index (CPI) from the Federal Reserve Bank of St. Louis (FRED), with 1982 as the base year. Lastly, replacement and new job growth projections are derived using employment within the same year. The result of these transformations is a balanced dataset extending back to 2005. For brevity, we focus on the top 10 occupations by turnover; data and graphs for additional occupations are available upon request.
Total Employment
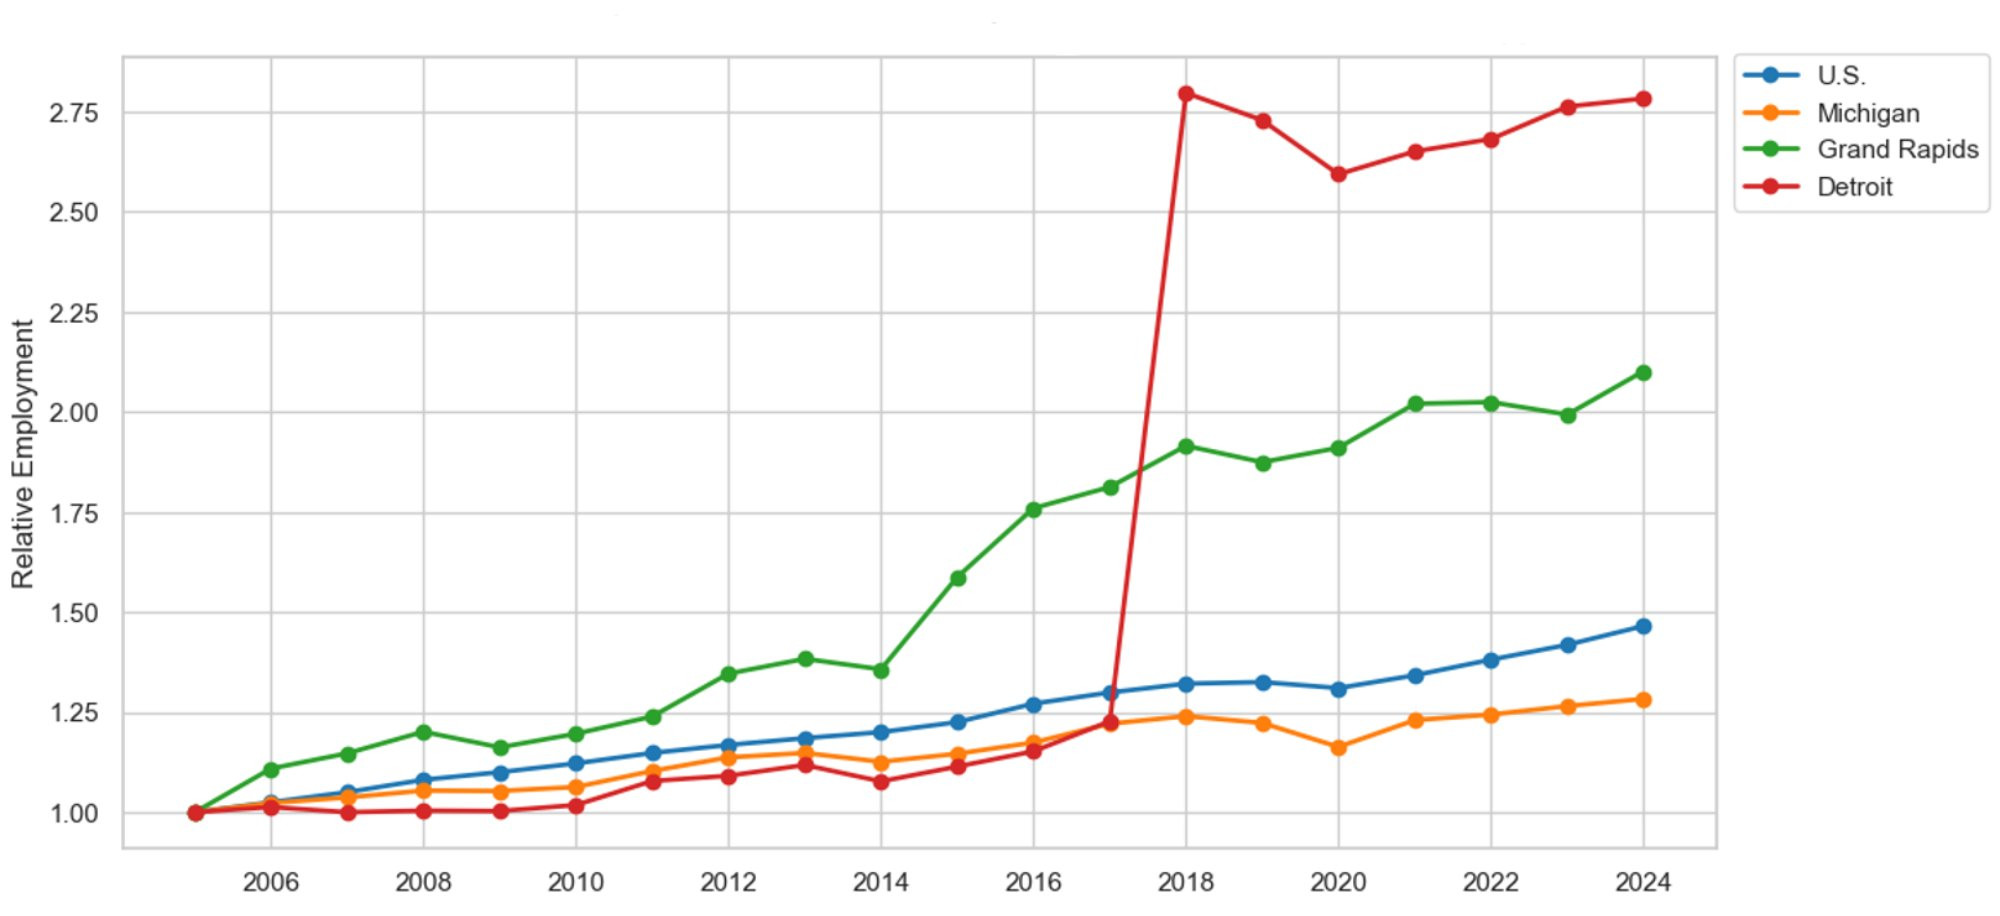
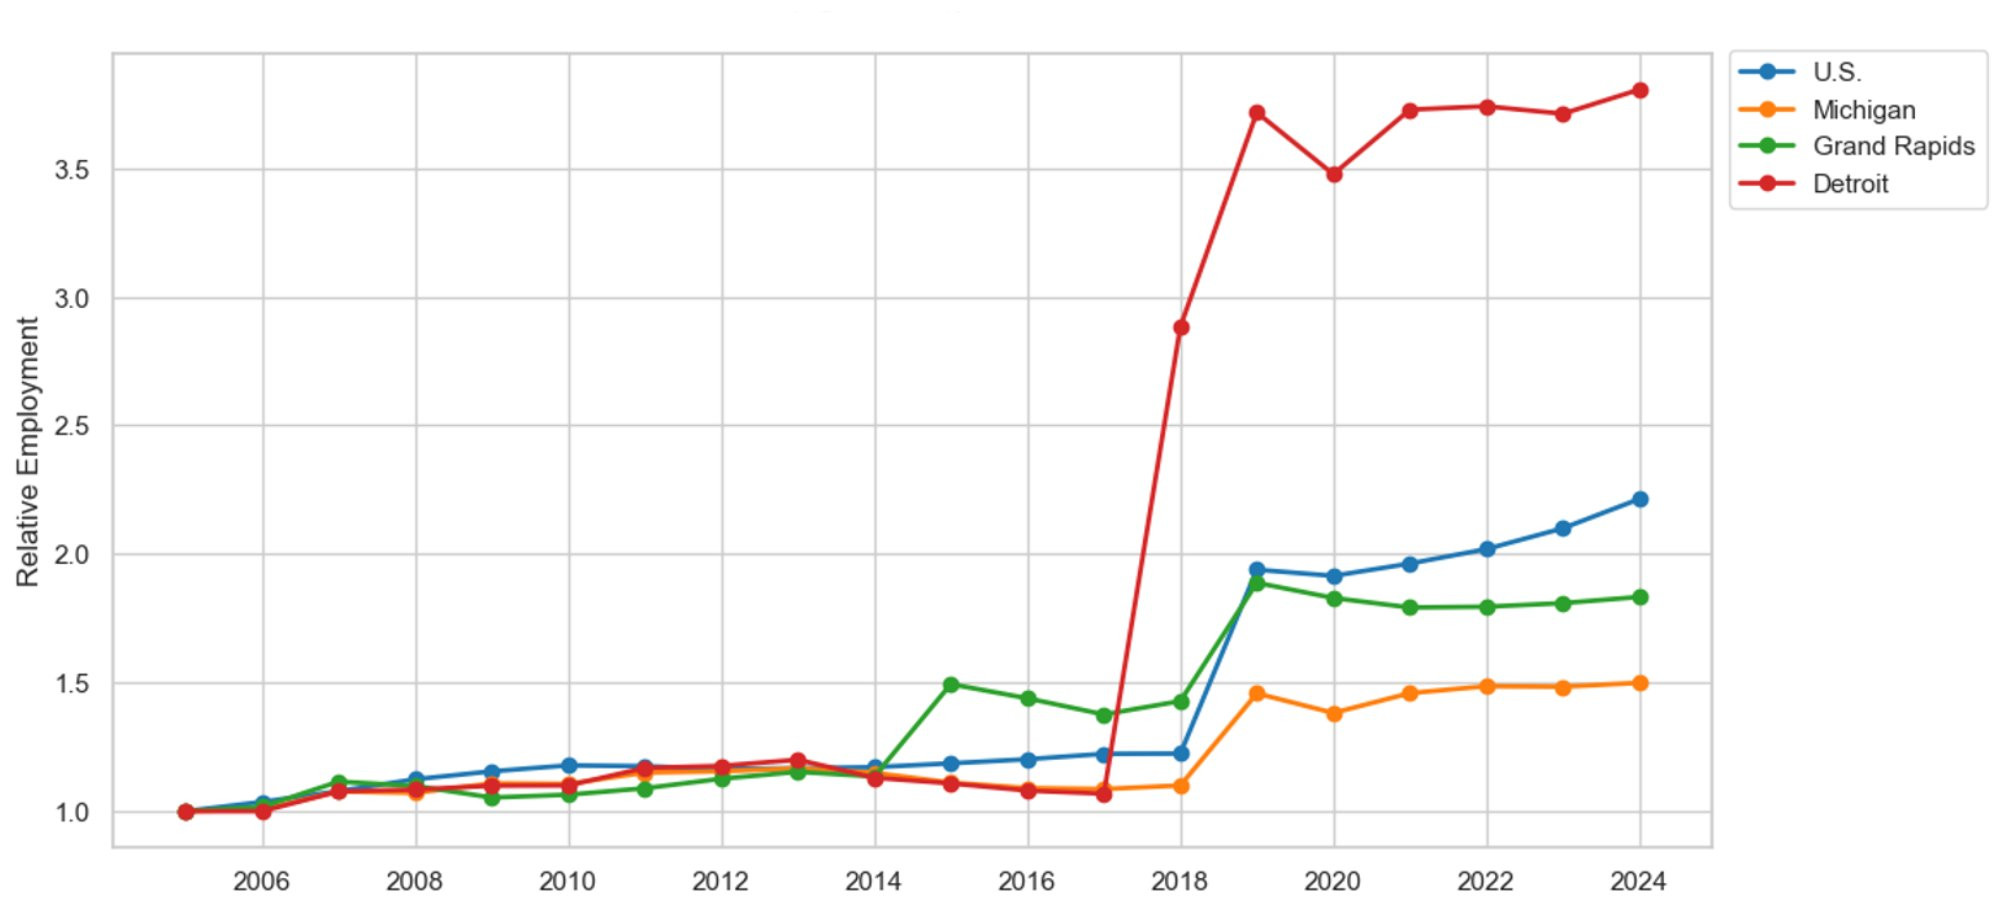
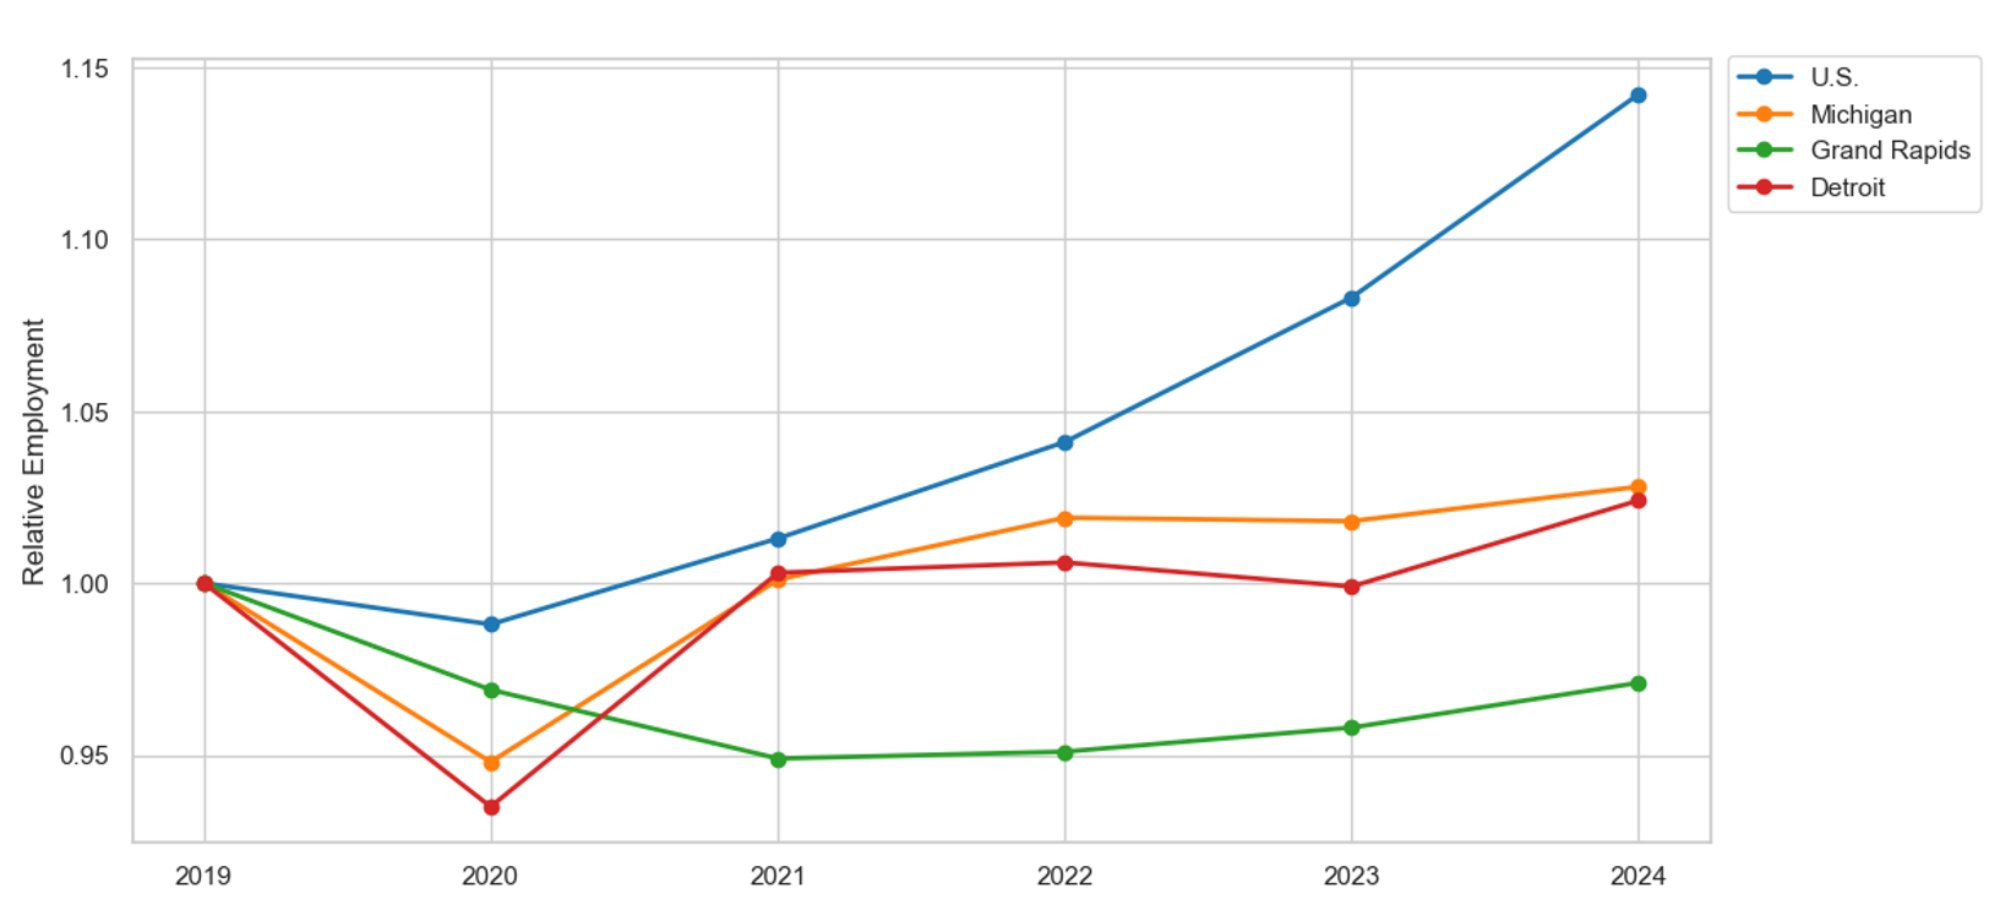
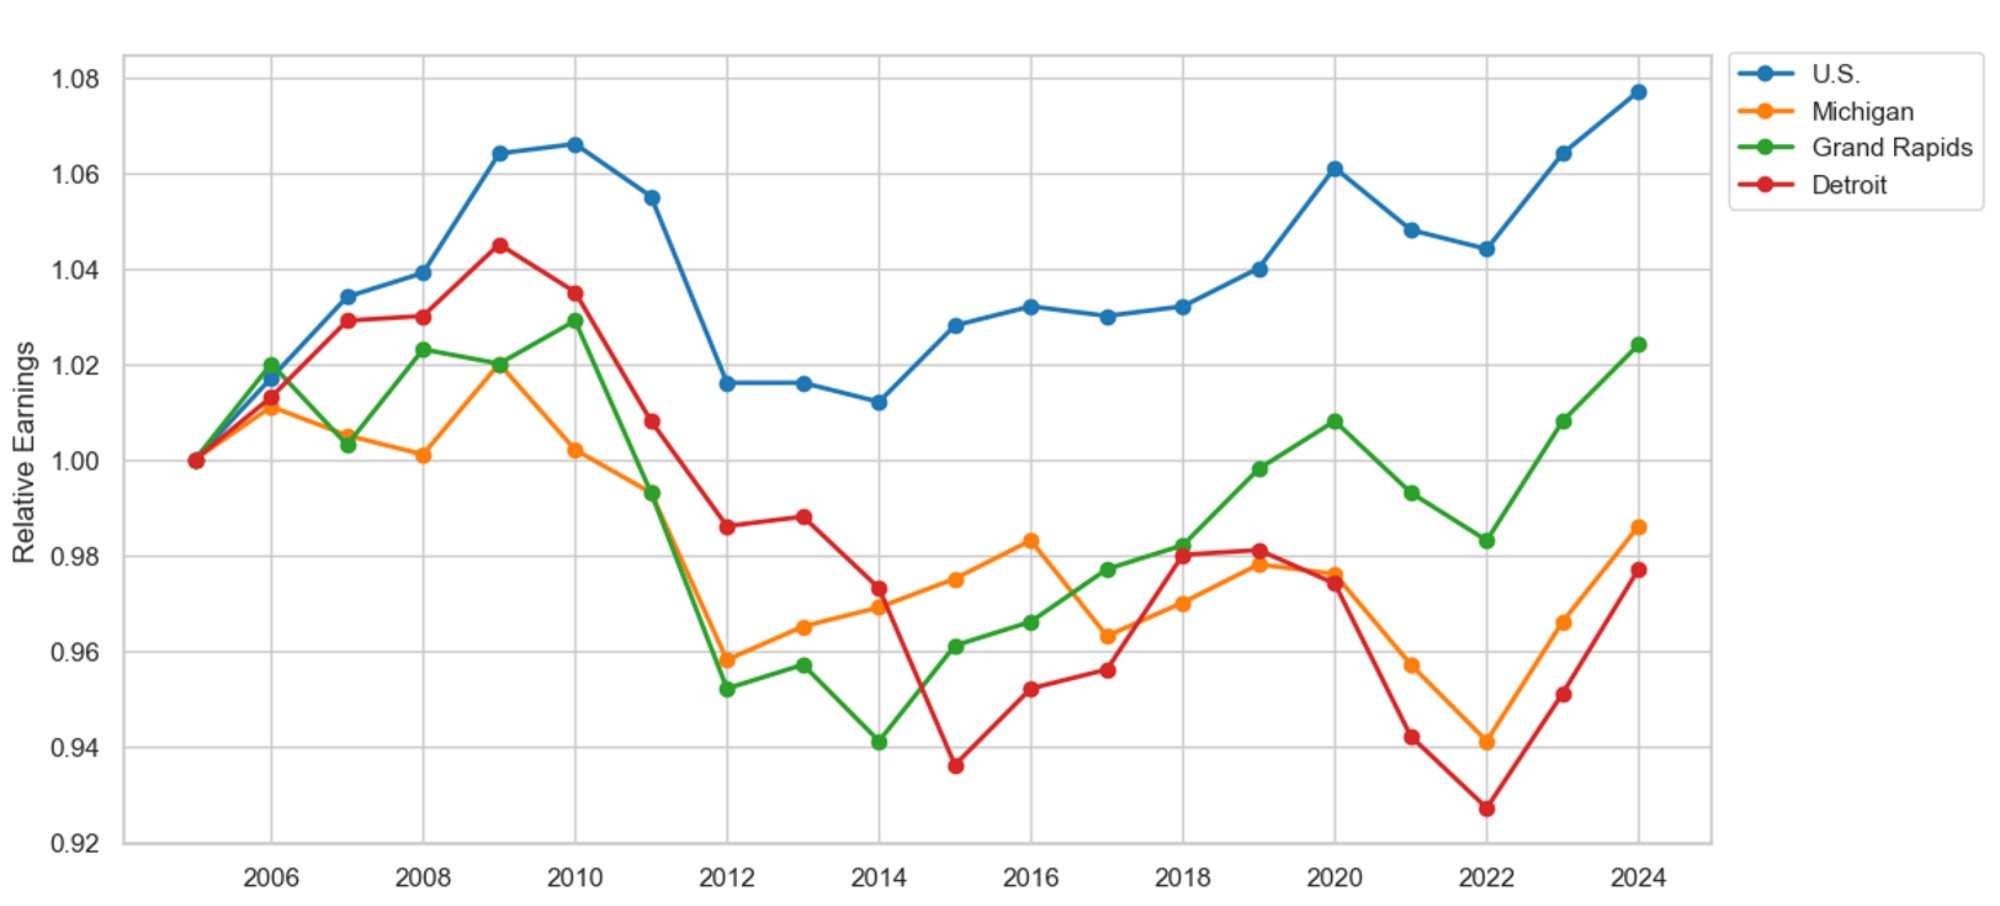
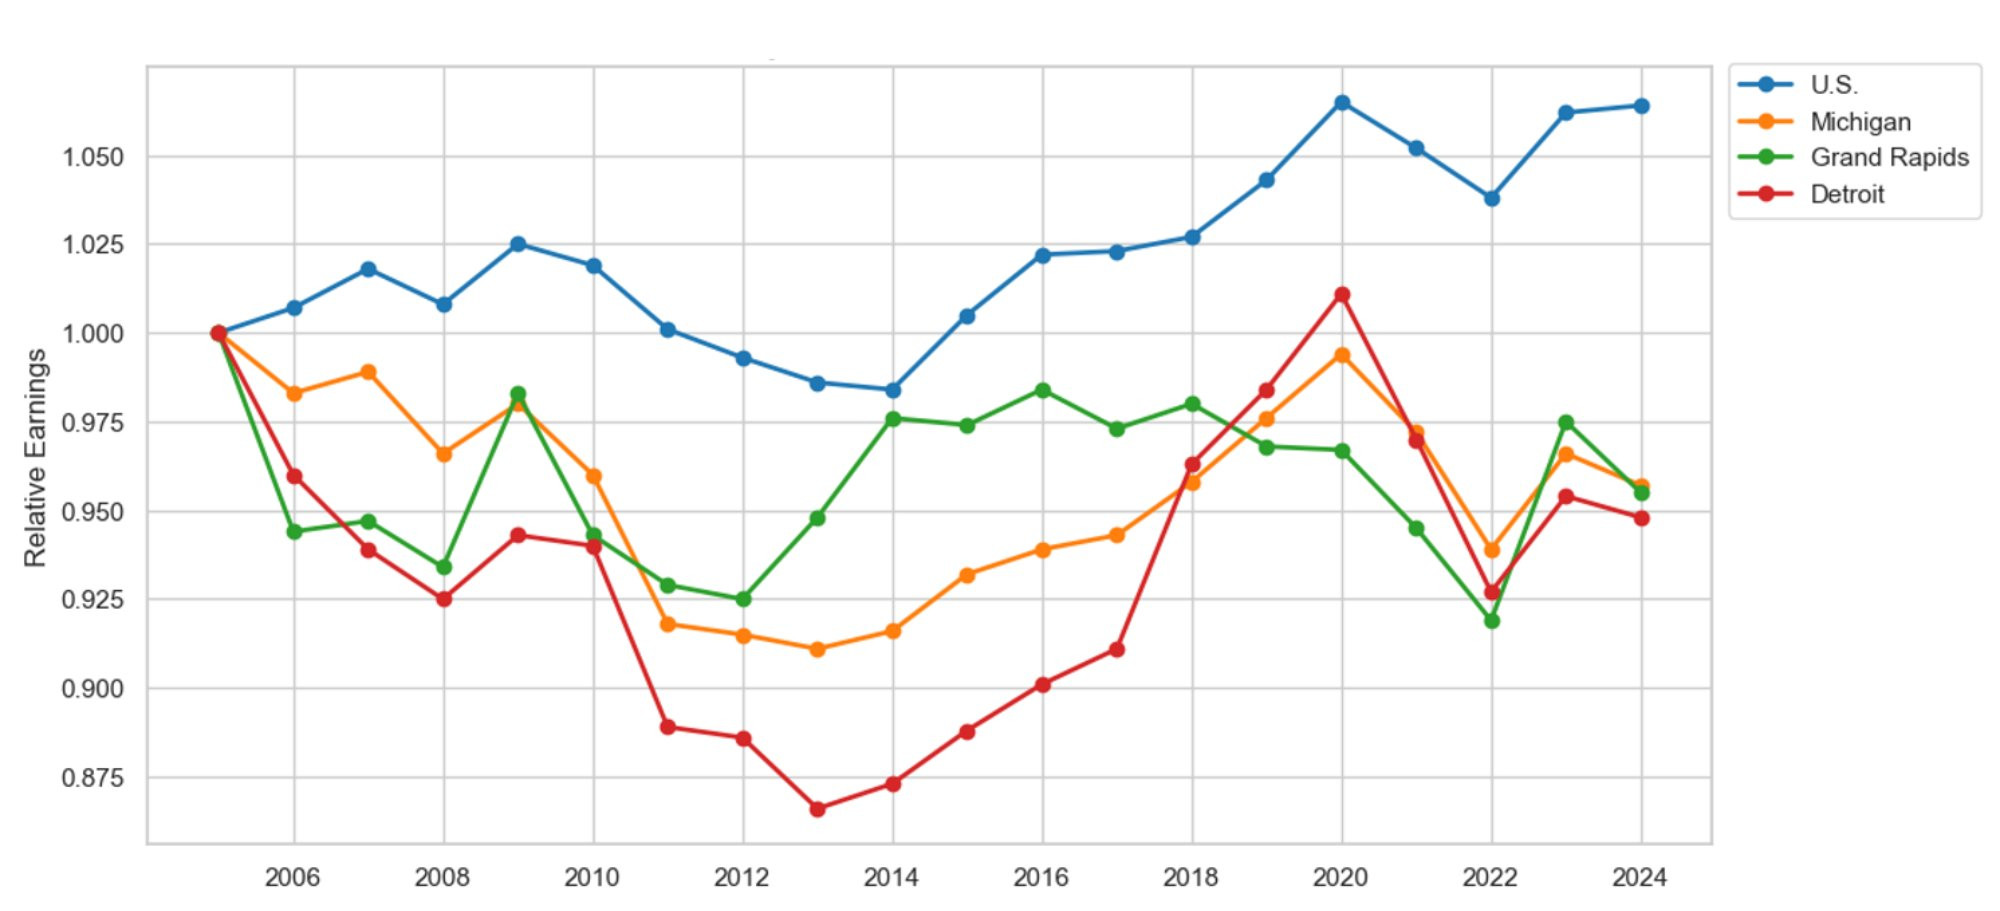
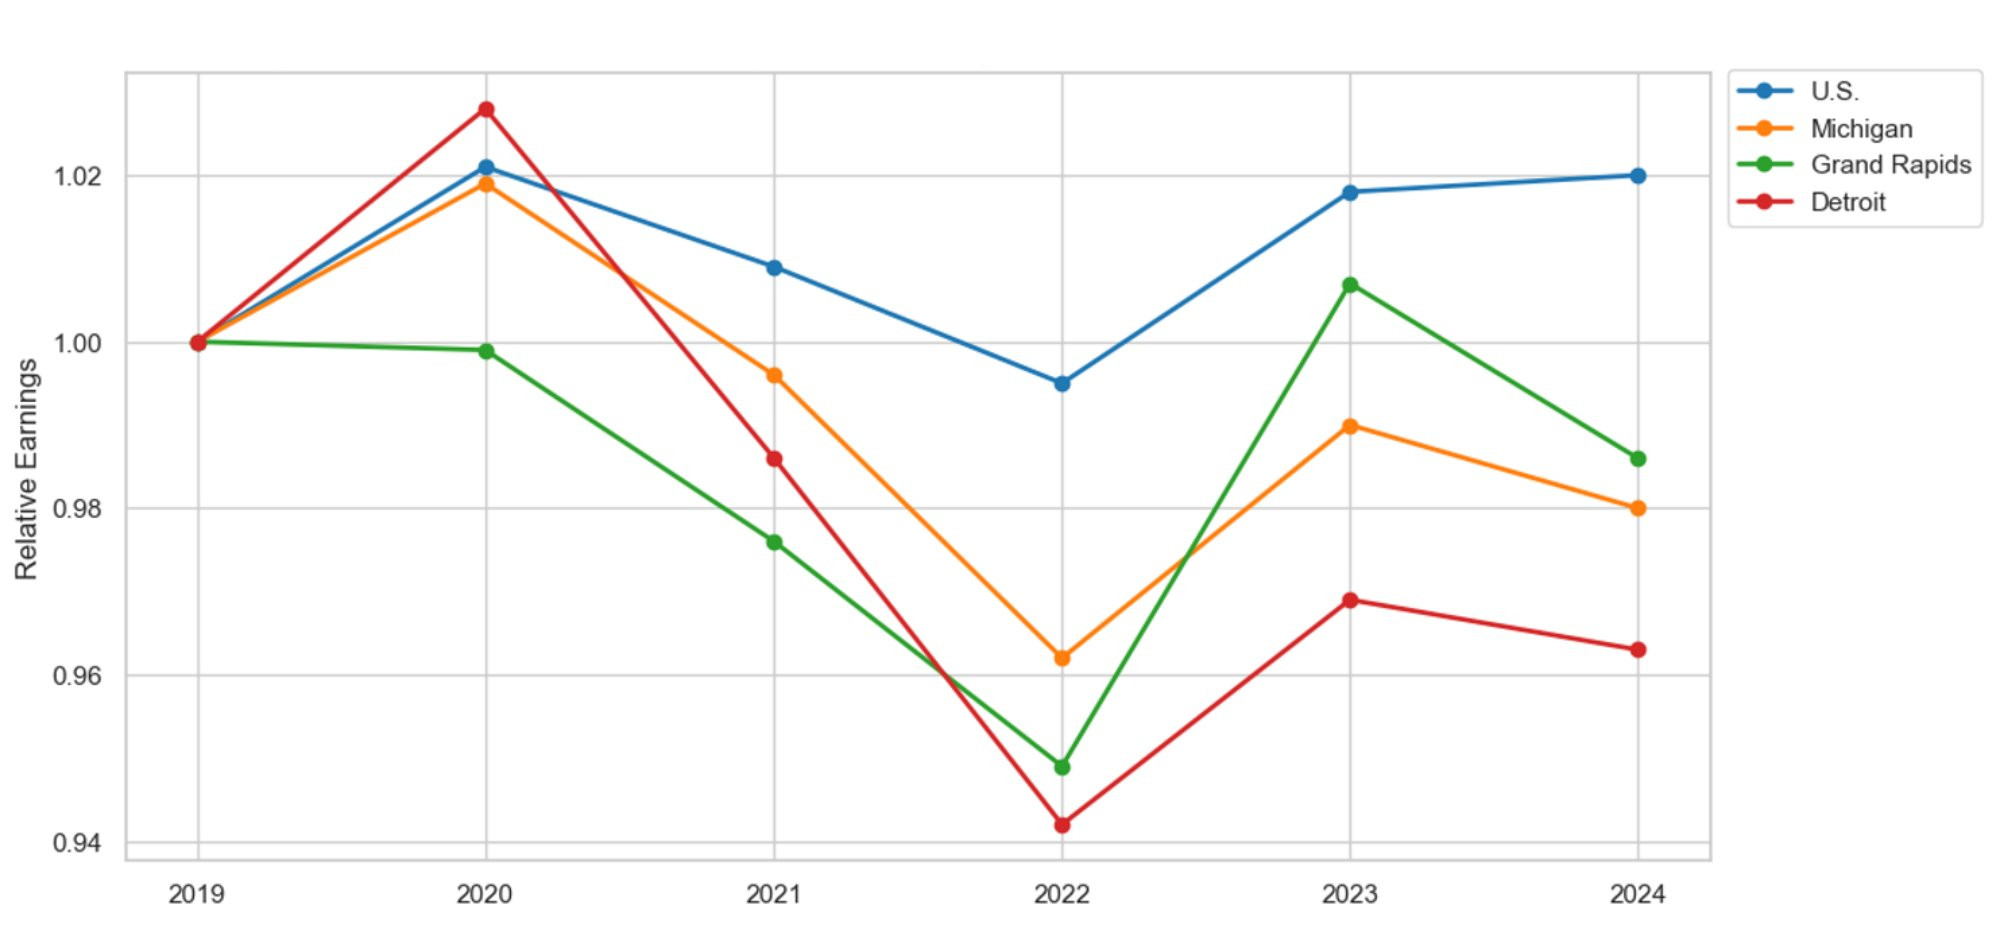
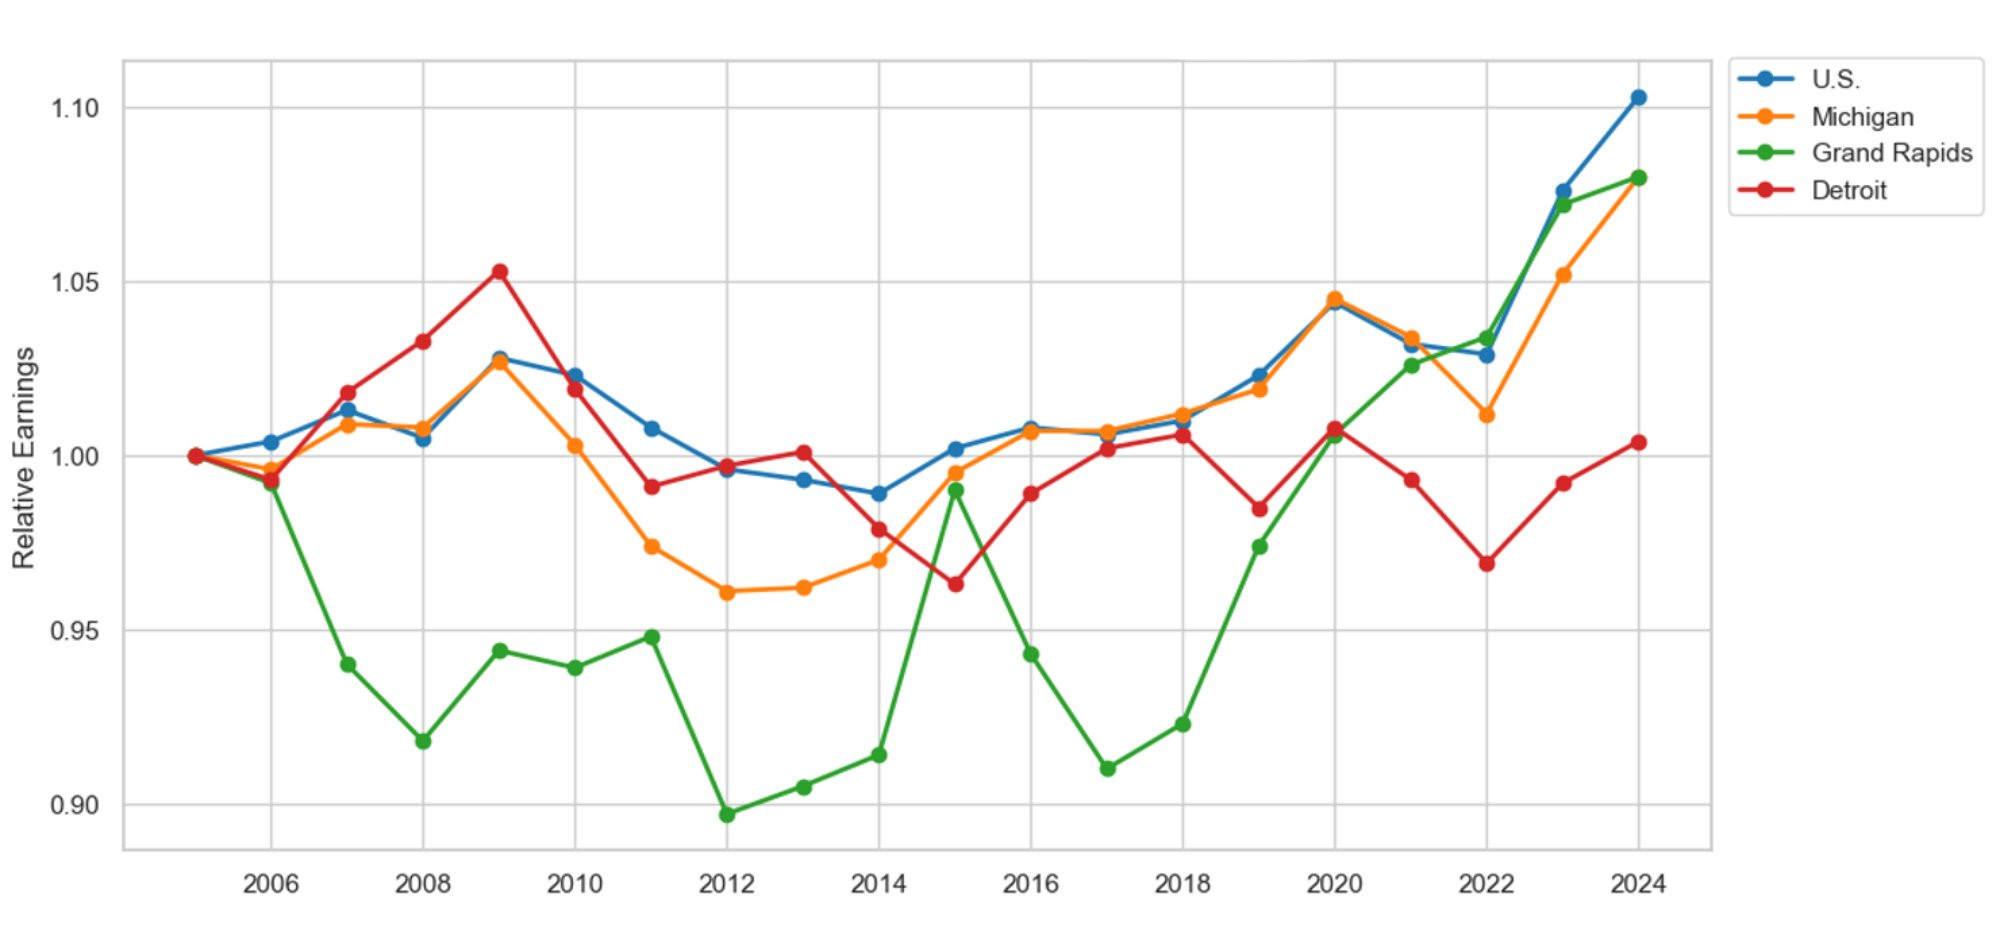
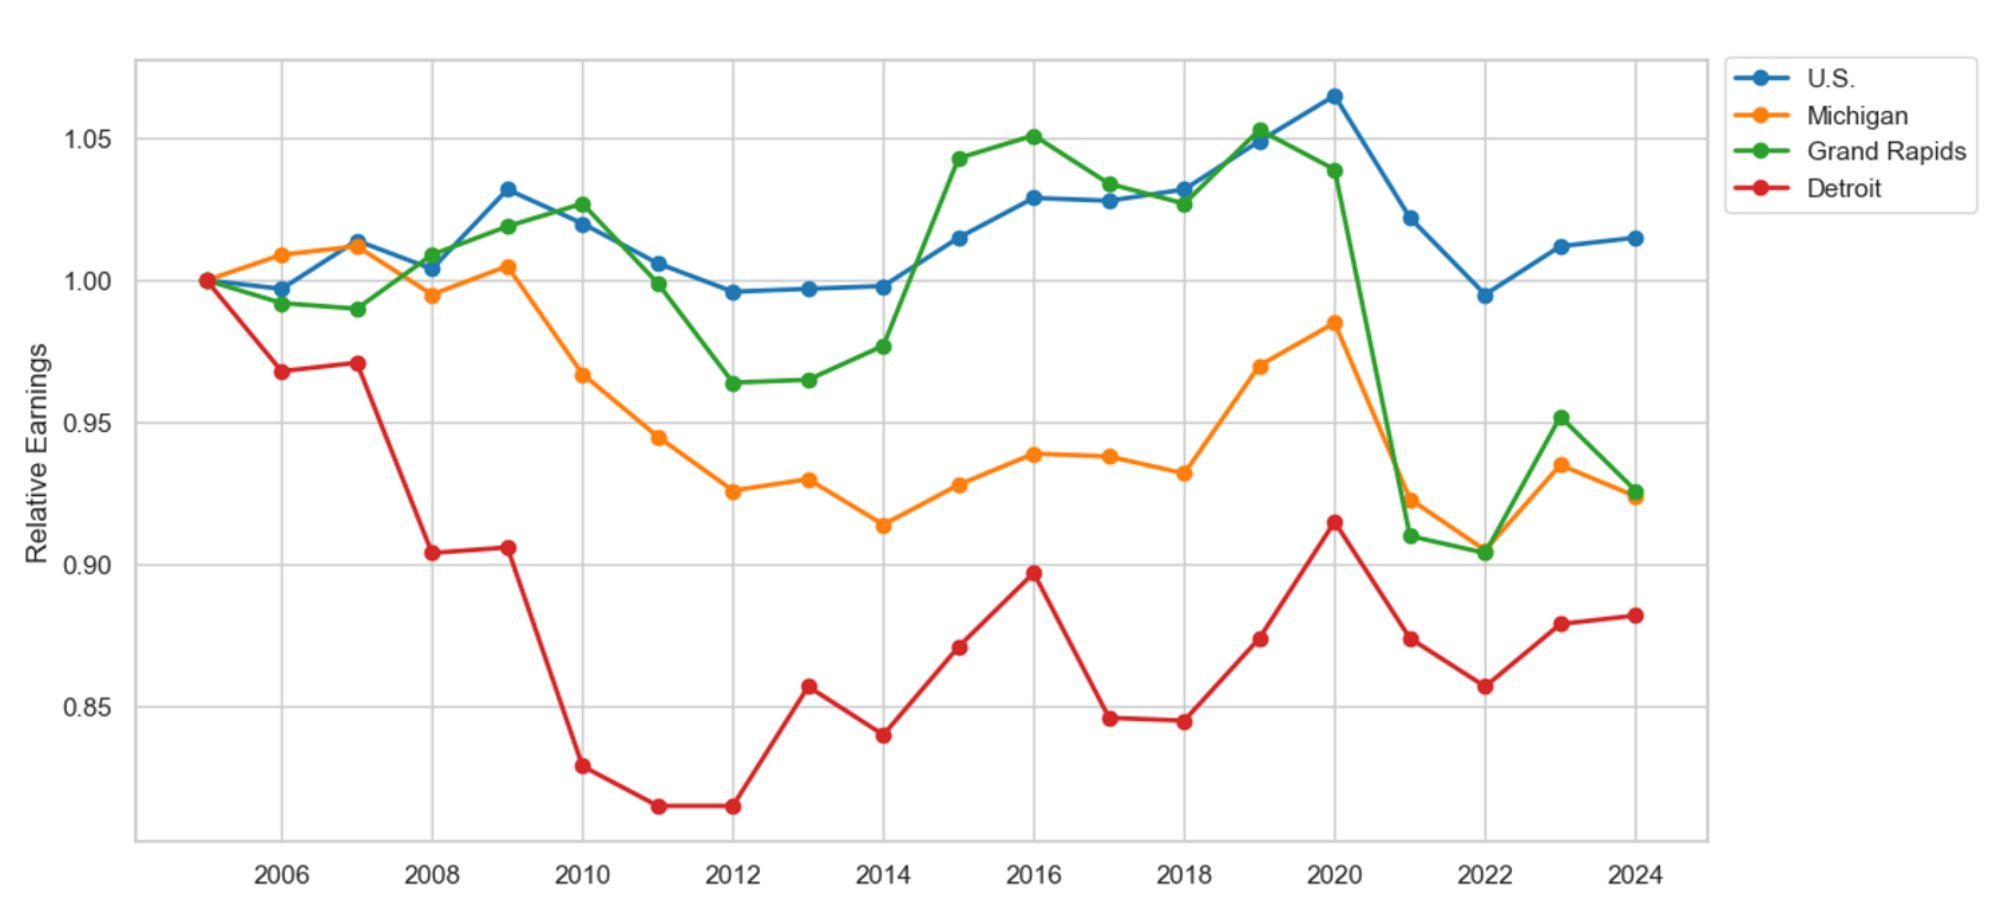
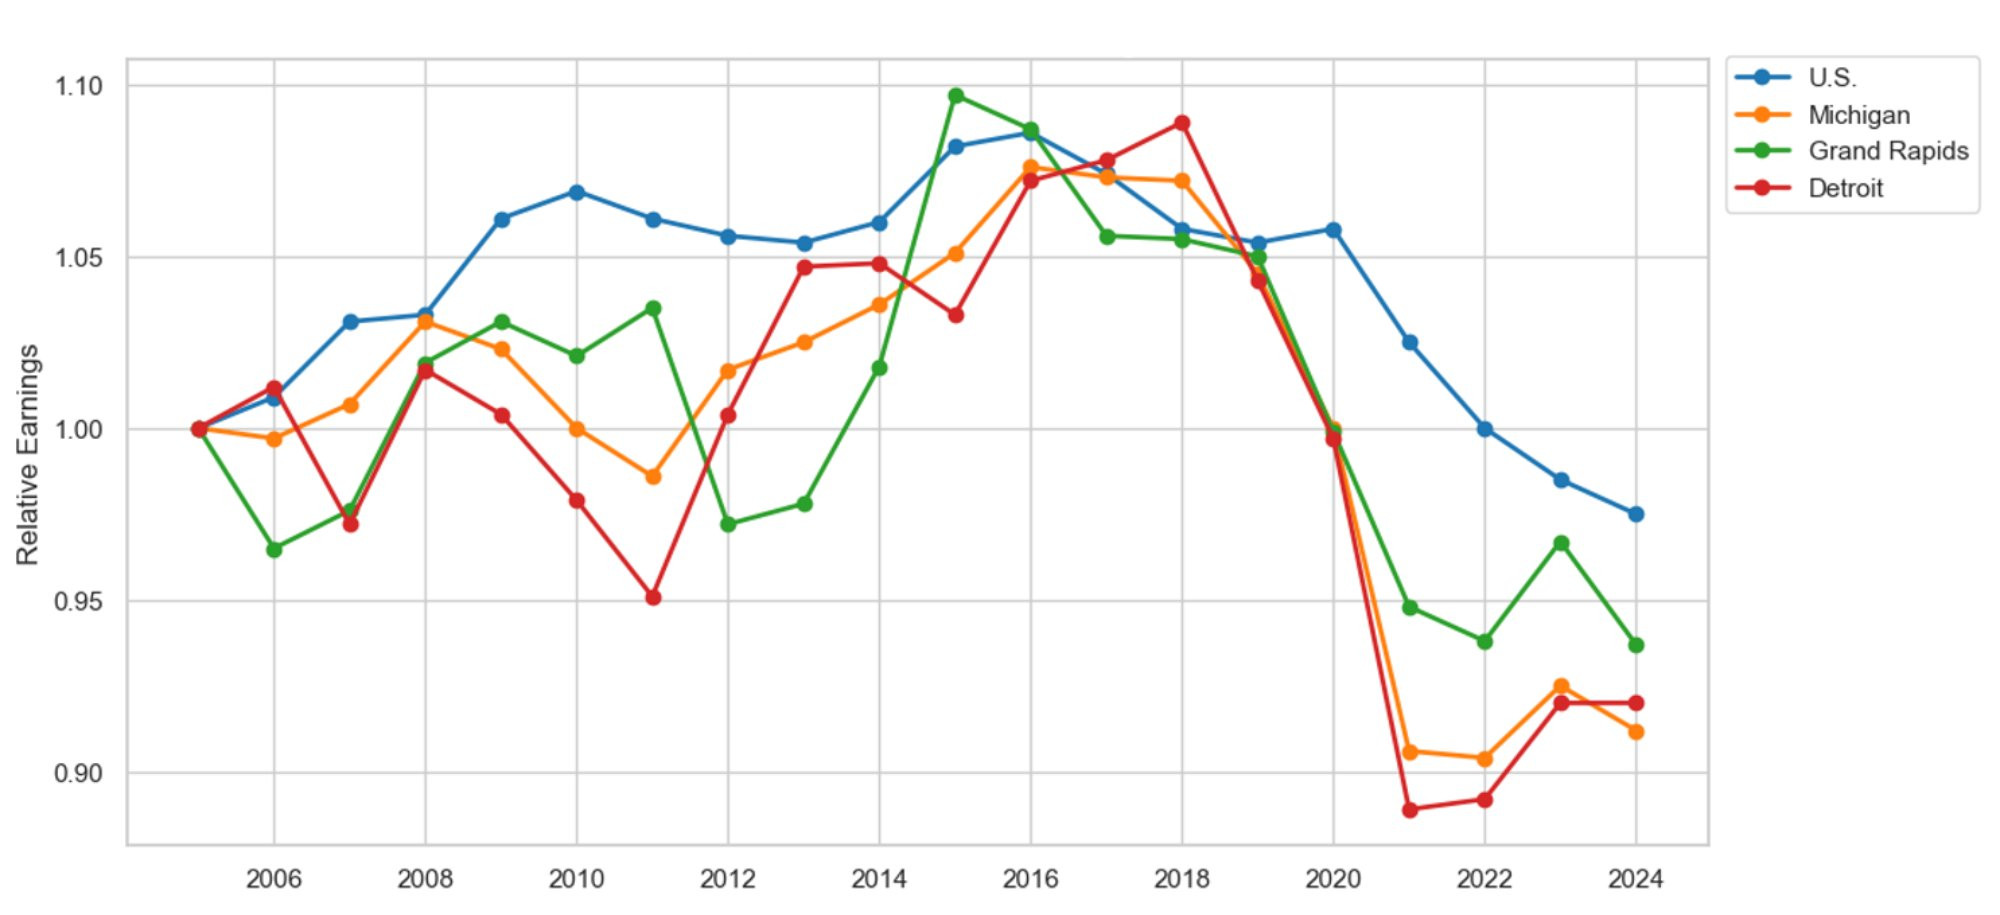
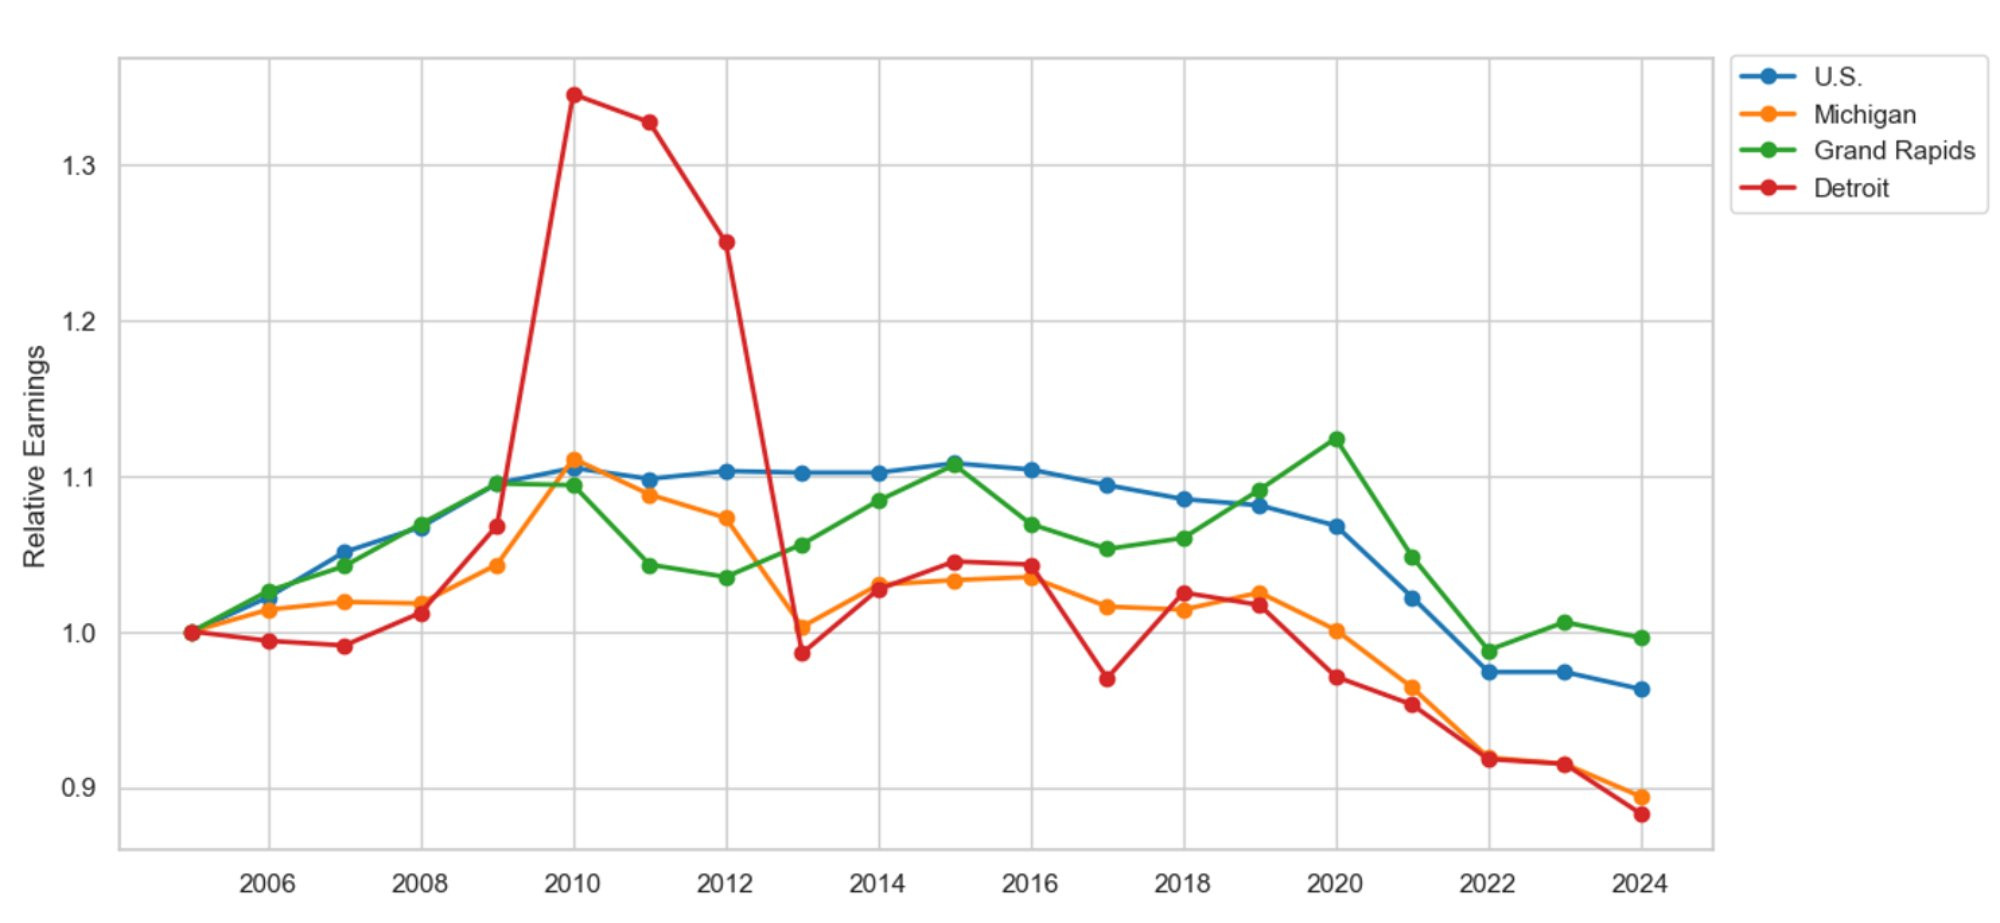
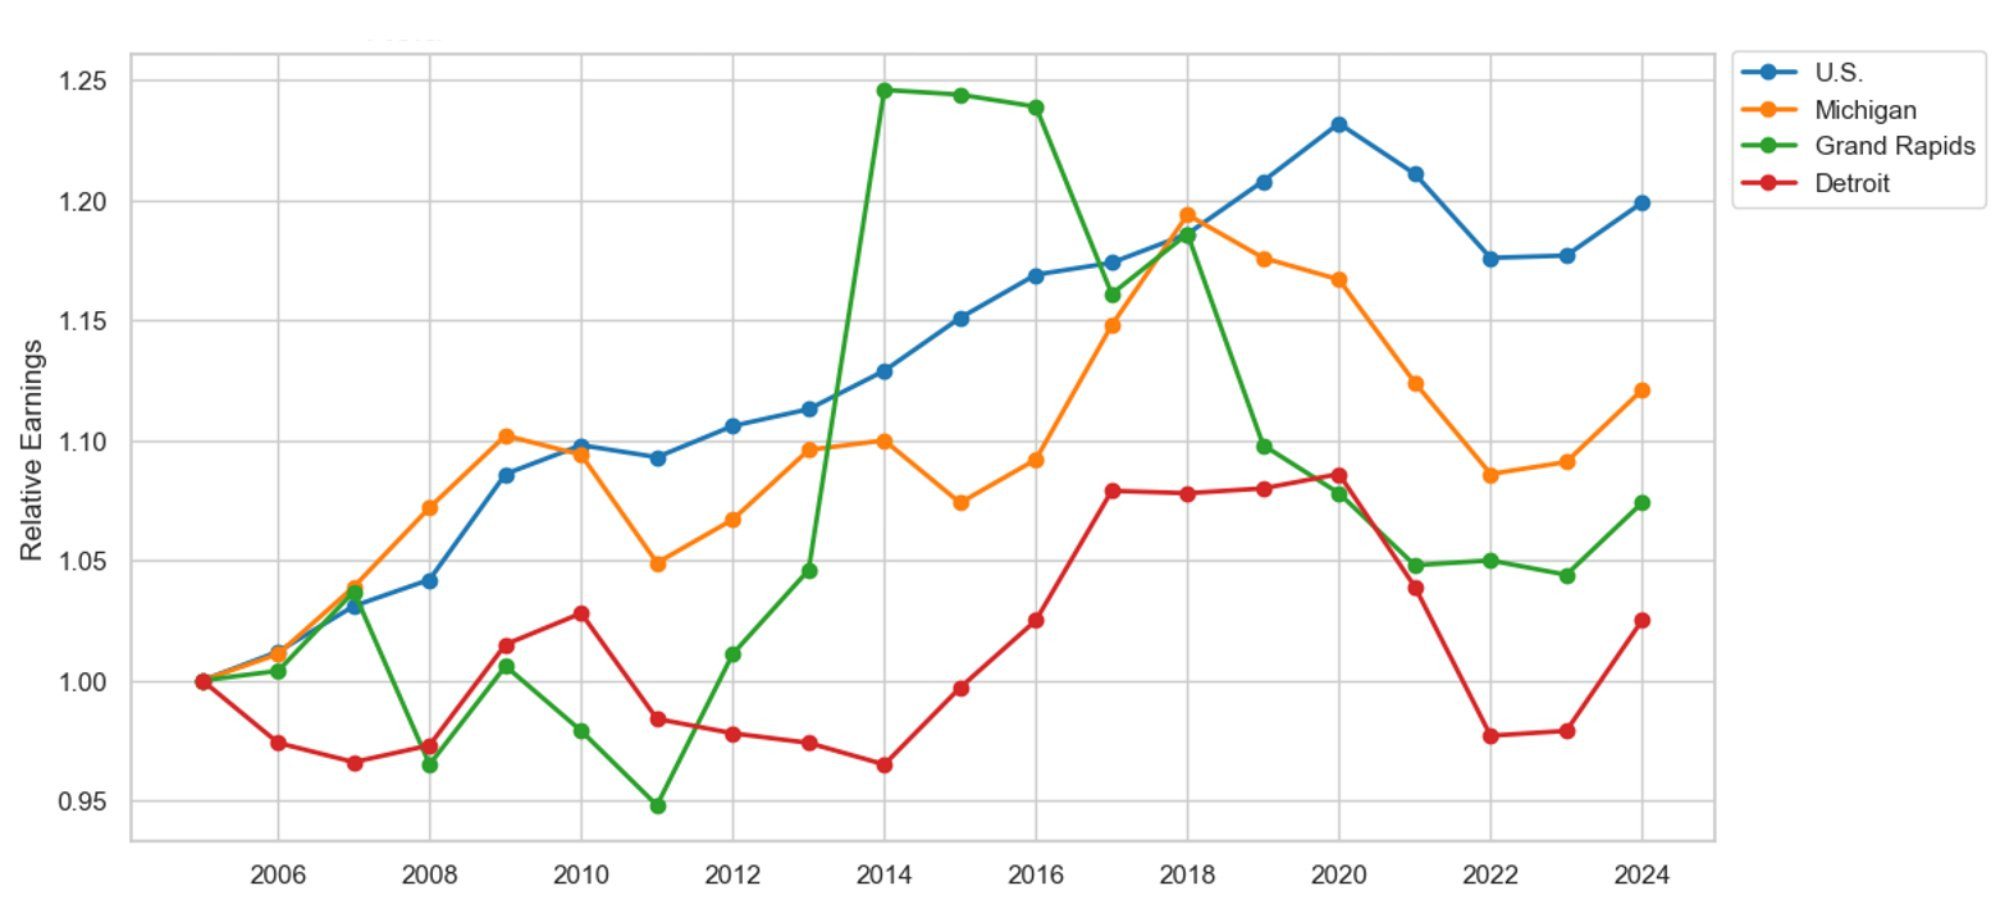
Figures 1 and 2 present the total non-farm employment relative to the start of the Great Recession in 2005 and the COVID-19 pandemic in 2019 for the U.S., Michigan, Grand Rapids, and Detroit. We find that Grand Rapids has recovered from the Great Recession at a rate comparable to the national average. For example, since 2005, Grand Rapids and the U.S. have observed net employment gains of 18.7 percent and 20.3 percent, respectively. By 2013, employment in Grand Rapids had returned to its pre-recession level, which lagged the national average by a year. In comparison, Detroit employment did not return to its pre-recession level until 2019. By 2025, Detroit will have recorded only a net employment gain of 0.5 percent, lagging far behind Grand Rapids. The data suggests that Detroit never really recovered from the Great Recession before being hit with the COVID-19 pandemic.
Figure 1: Relative Employment Since 2005
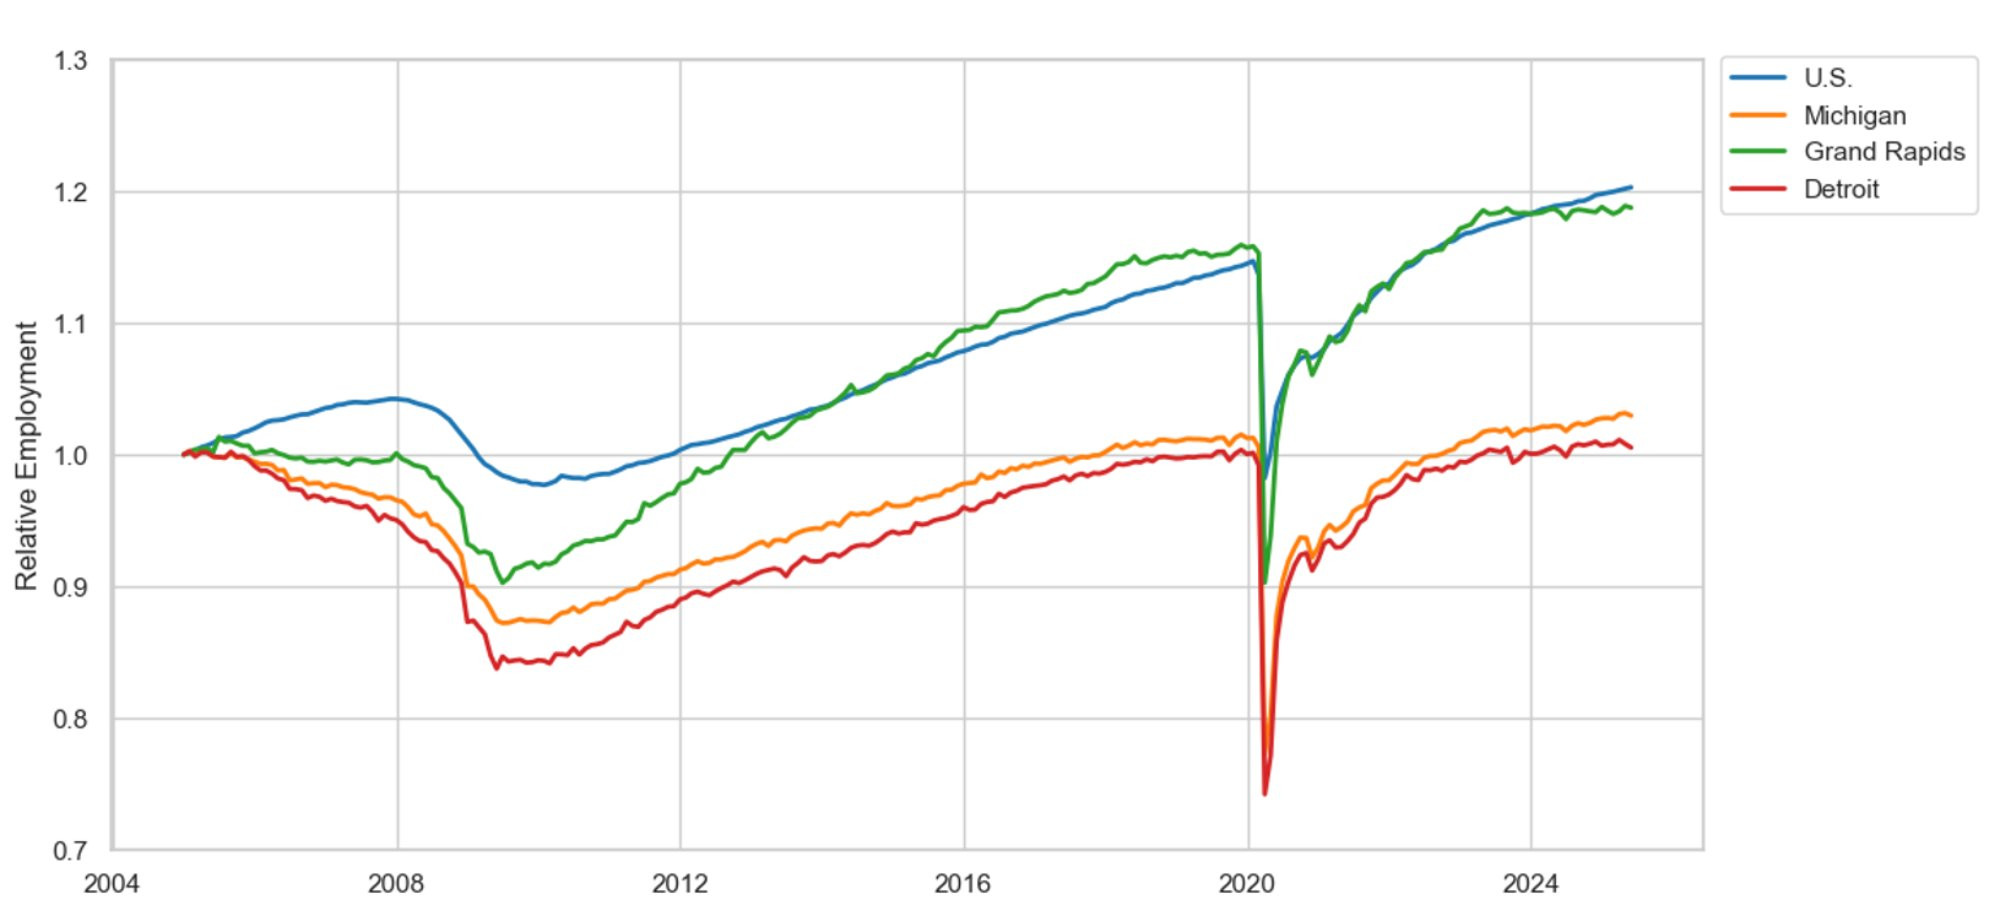
Description: Figure 1 highlights the rebound in employment since the start of the Great Recession in 2005 in the U.S., Michigan, Grand Rapids, and Detroit. The employment rebound in Grand Rapids mirrors the national rebound. By 2012, Grand Rapids began experiencing positive employment growth, which was not observed in Detroit or at the state level until late 2018.
Source: U.S. Bureau of Labor Statistics
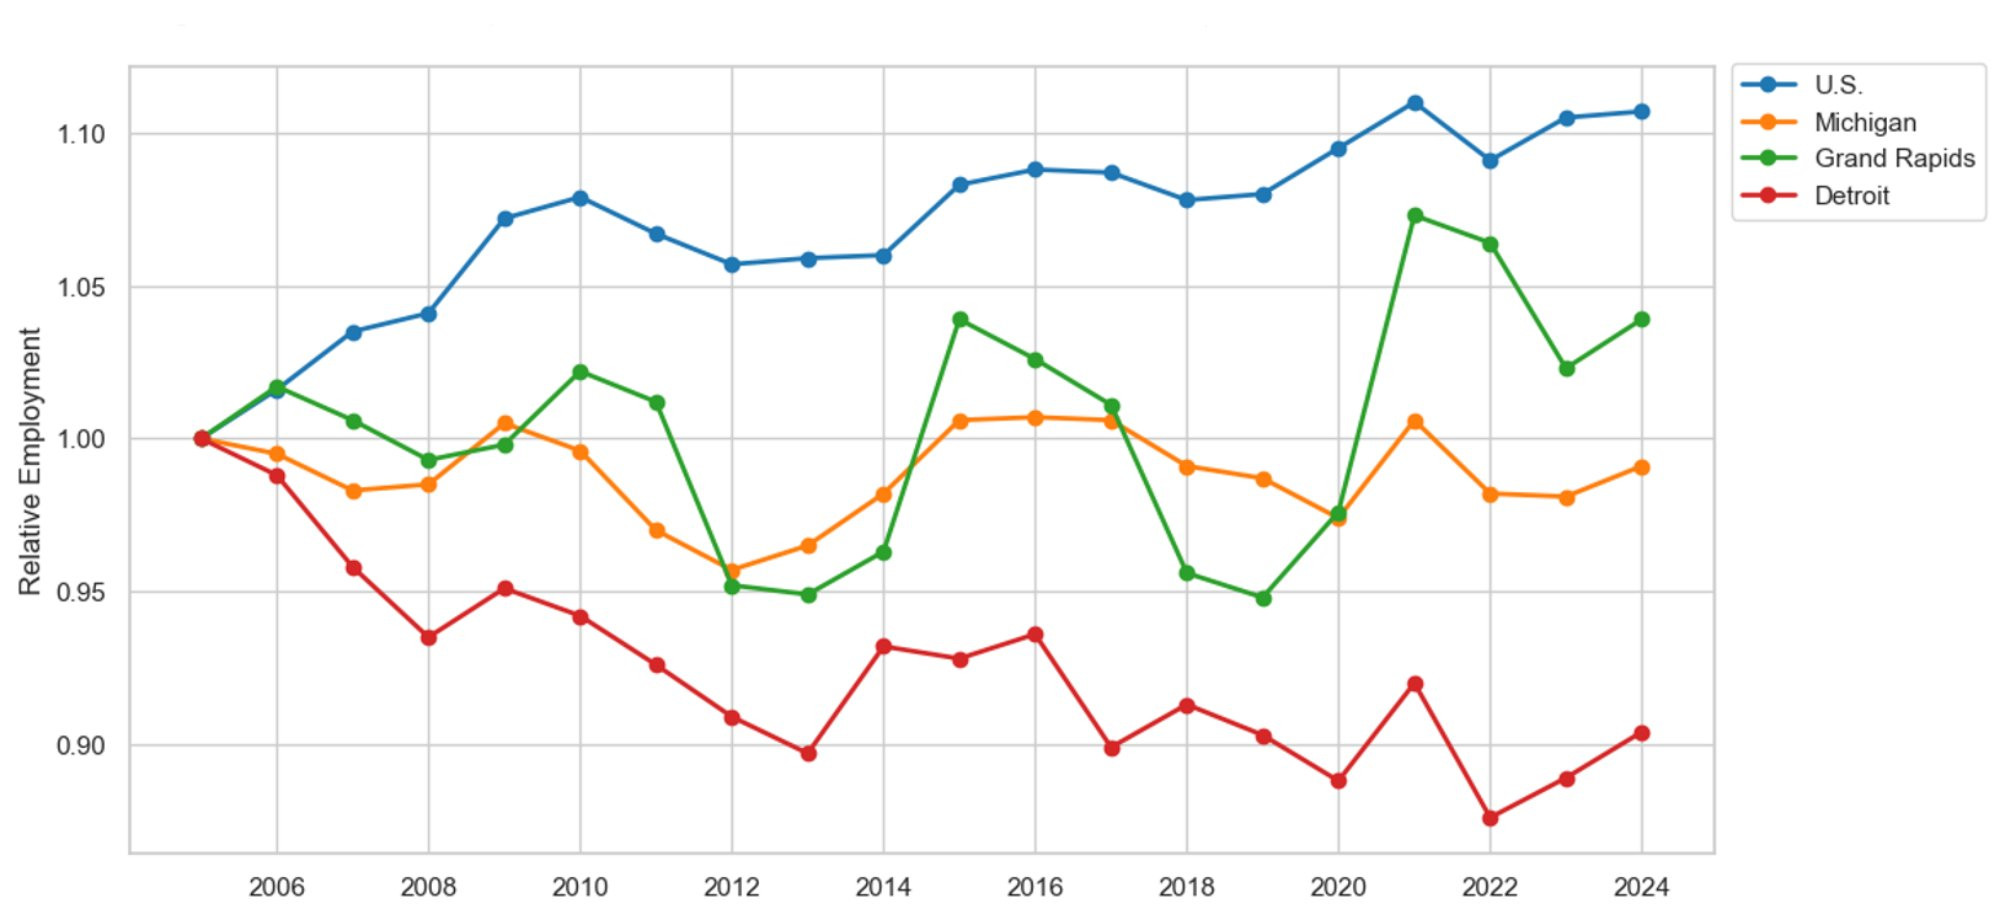
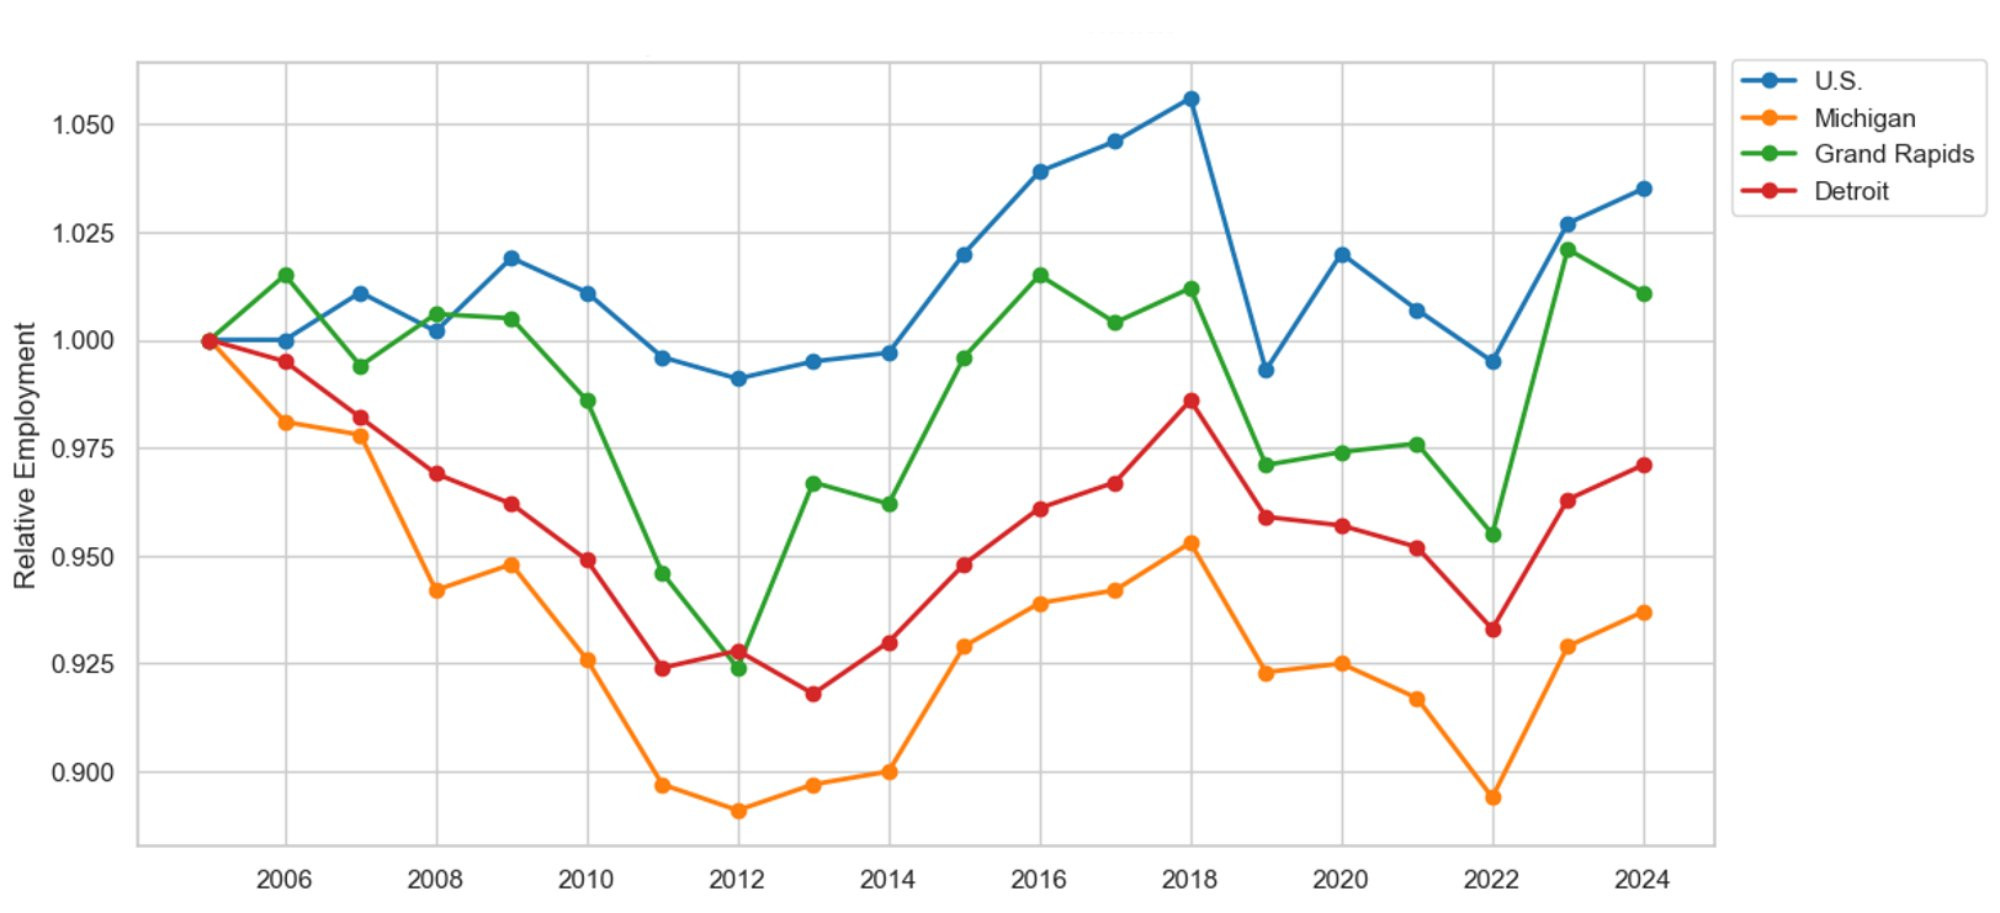
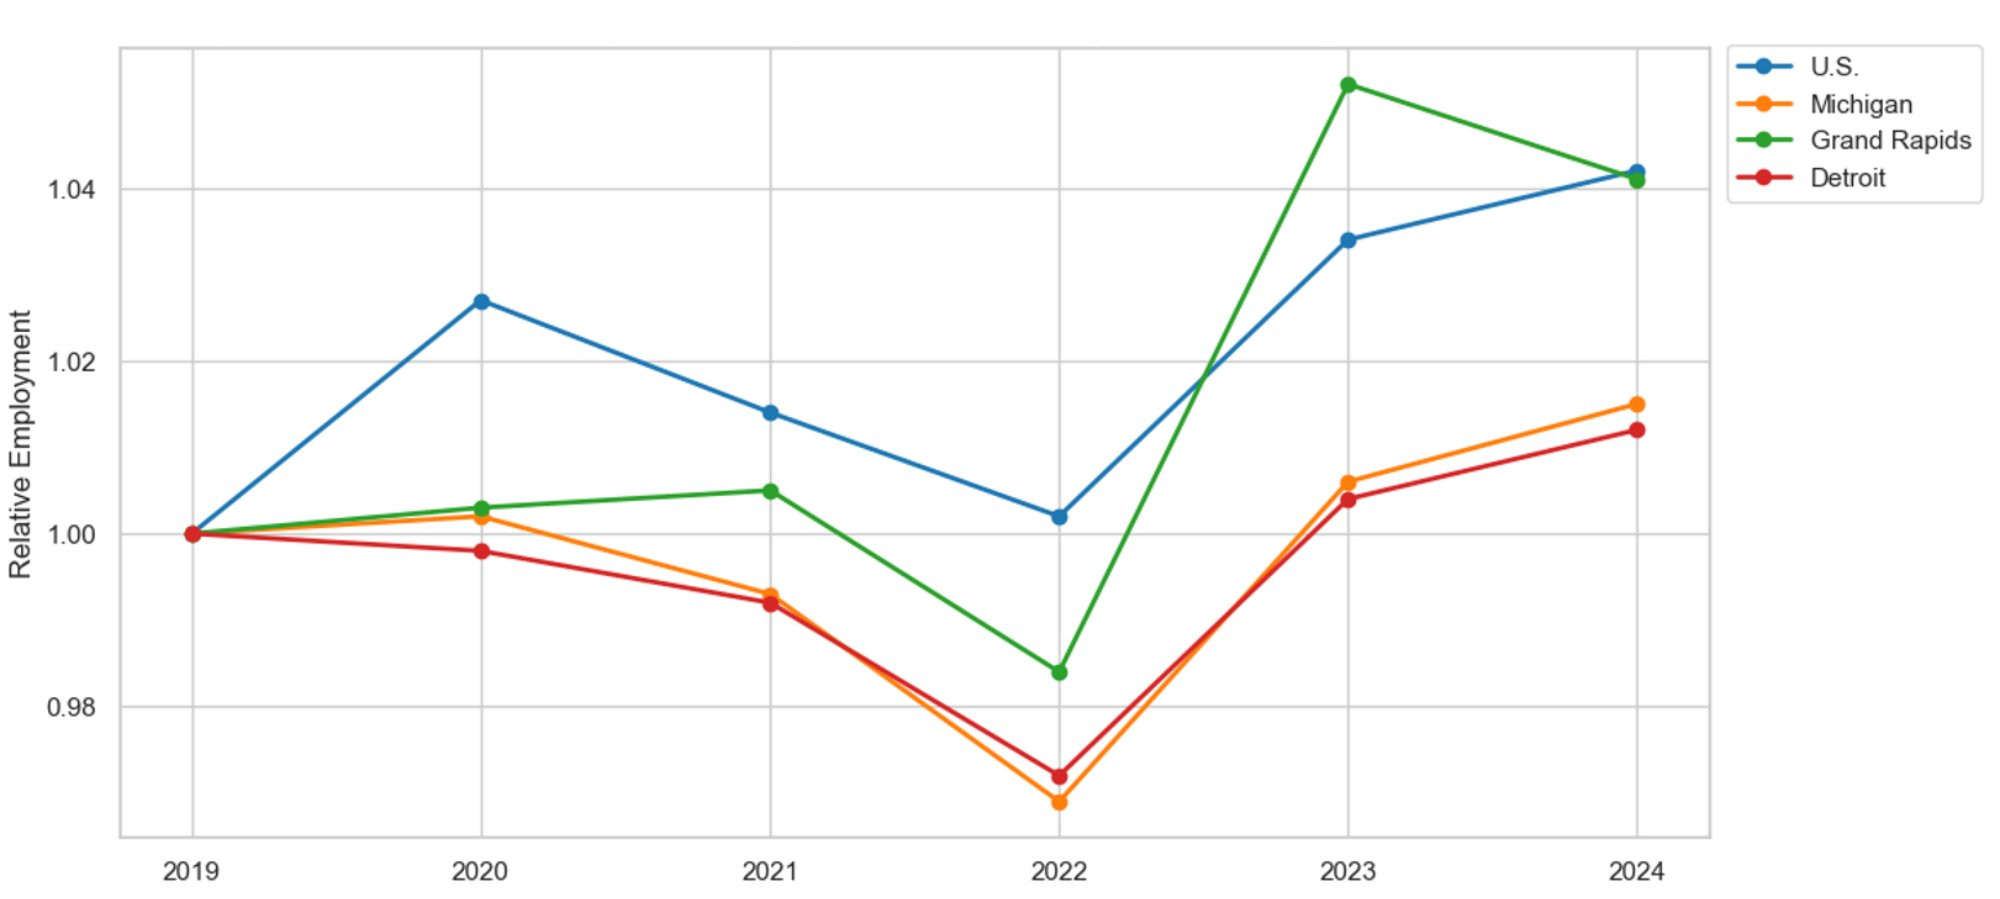
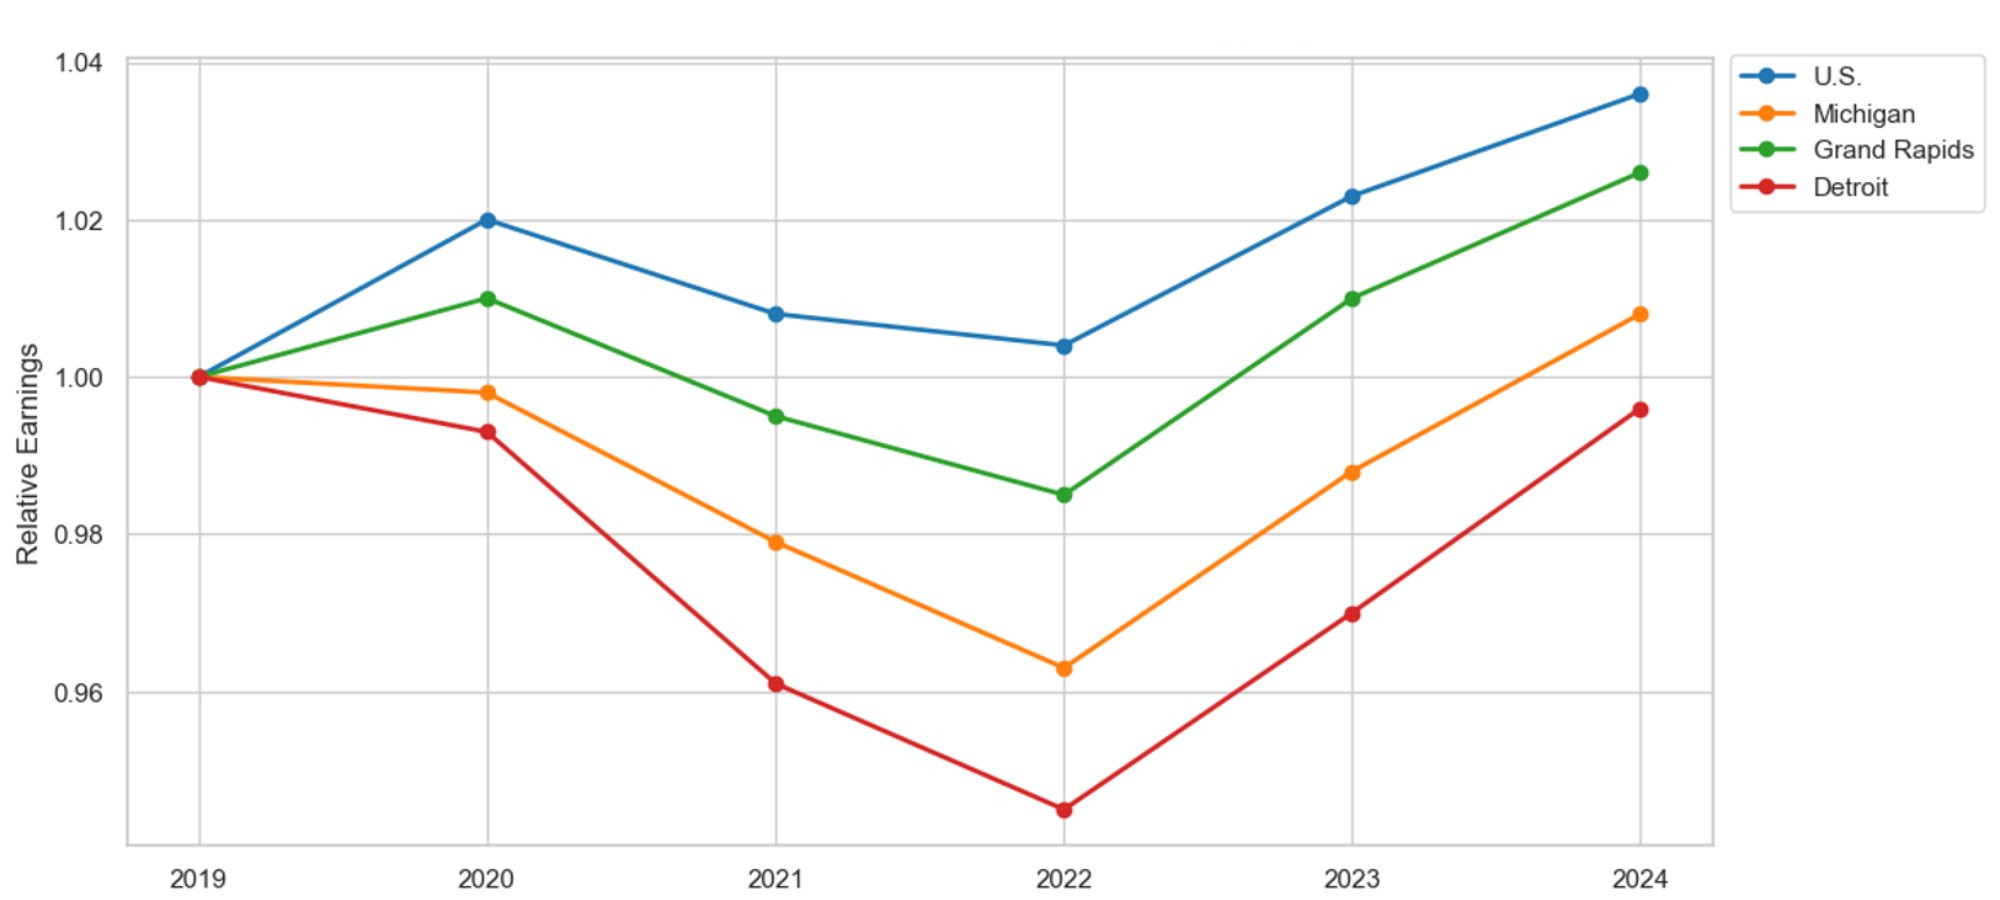
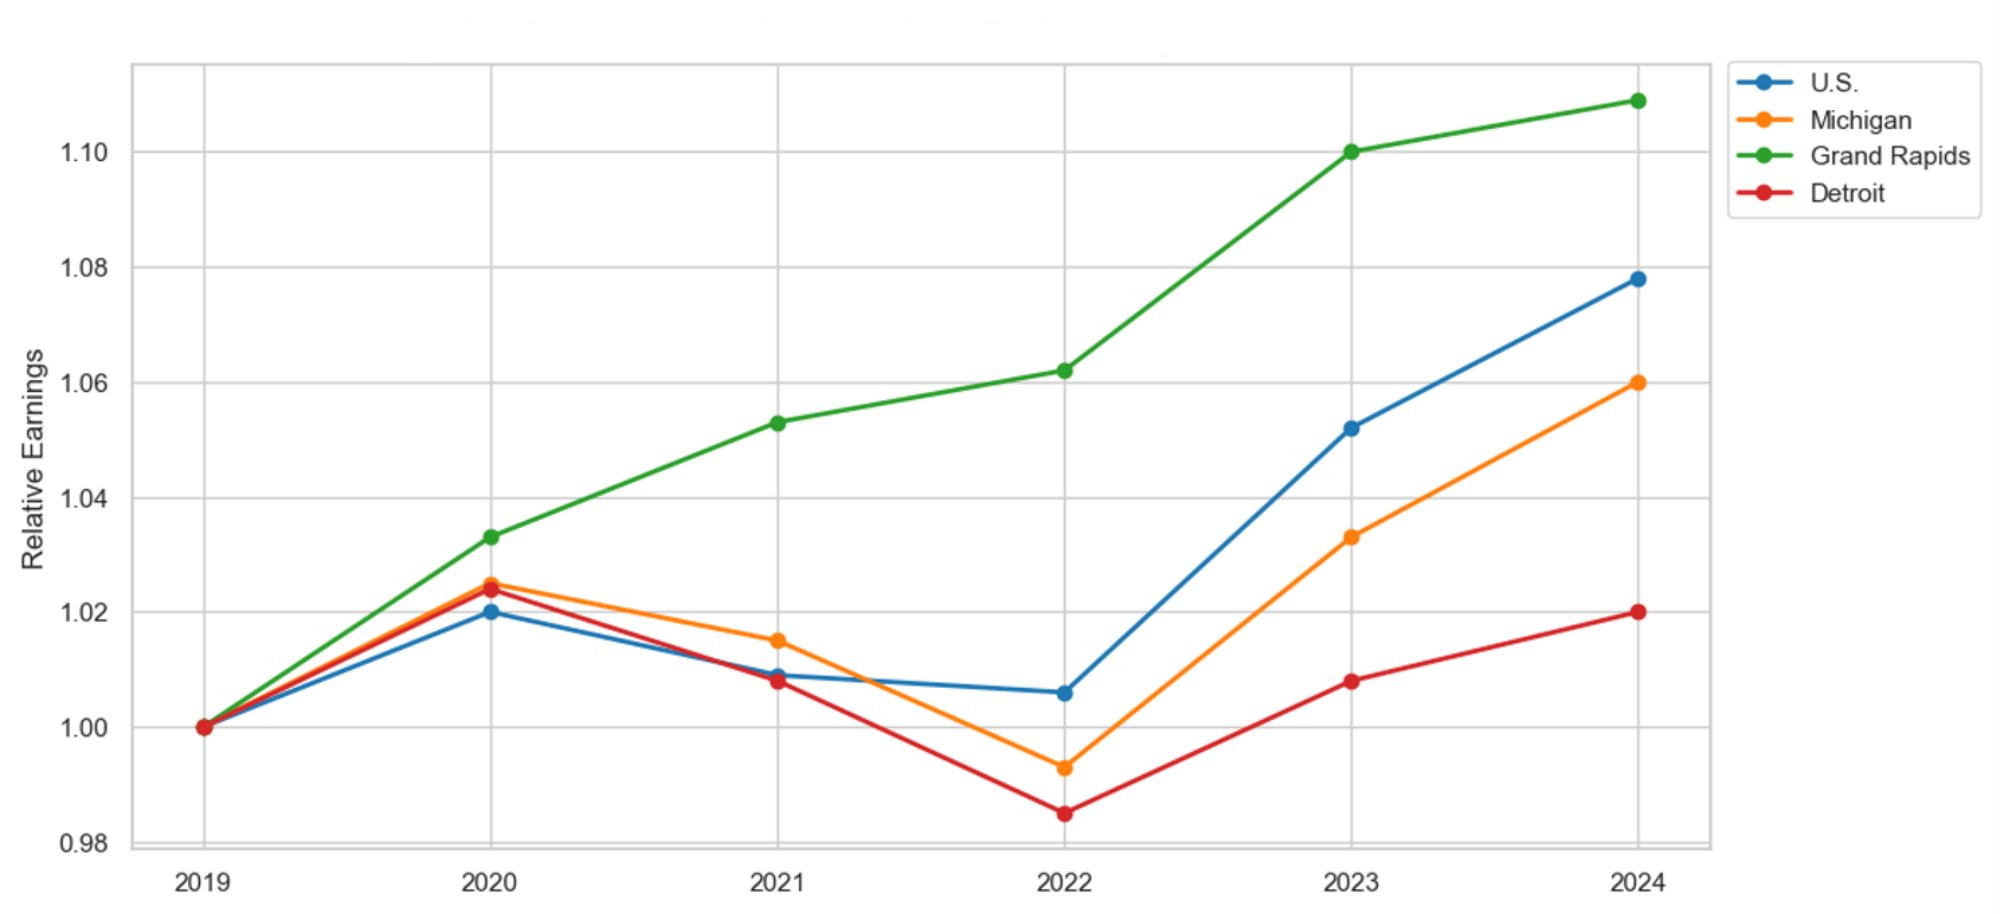
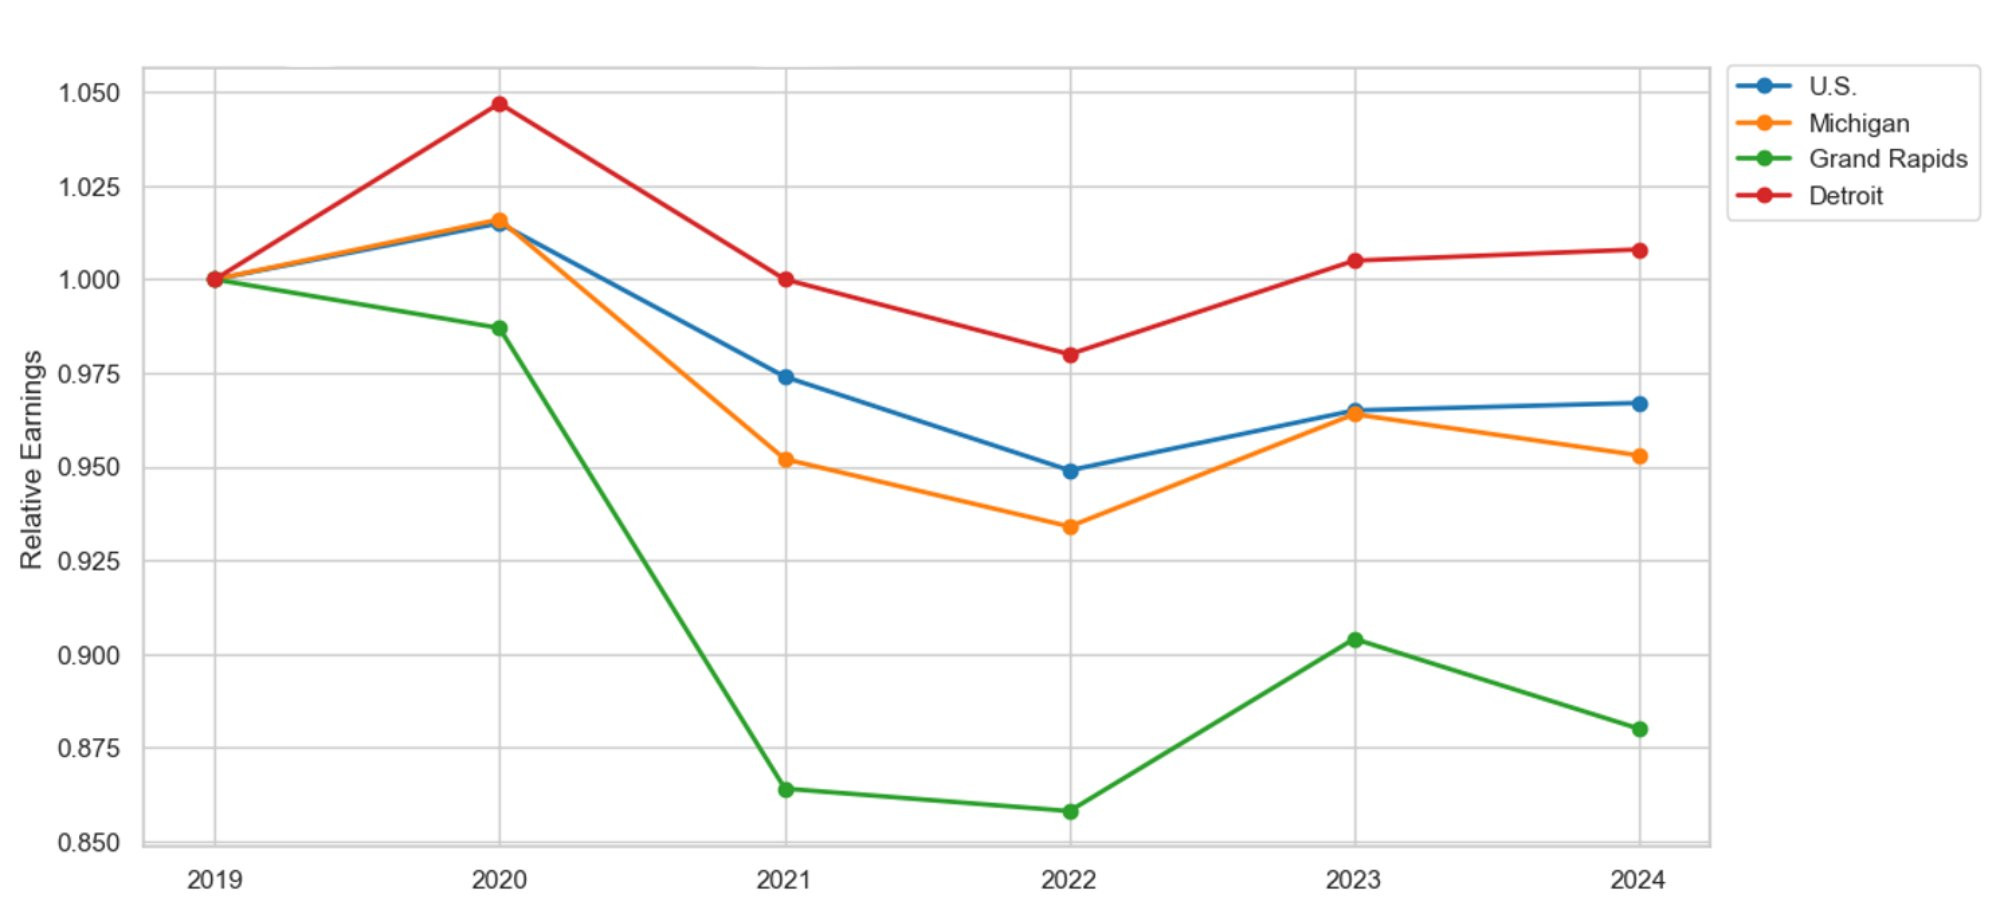
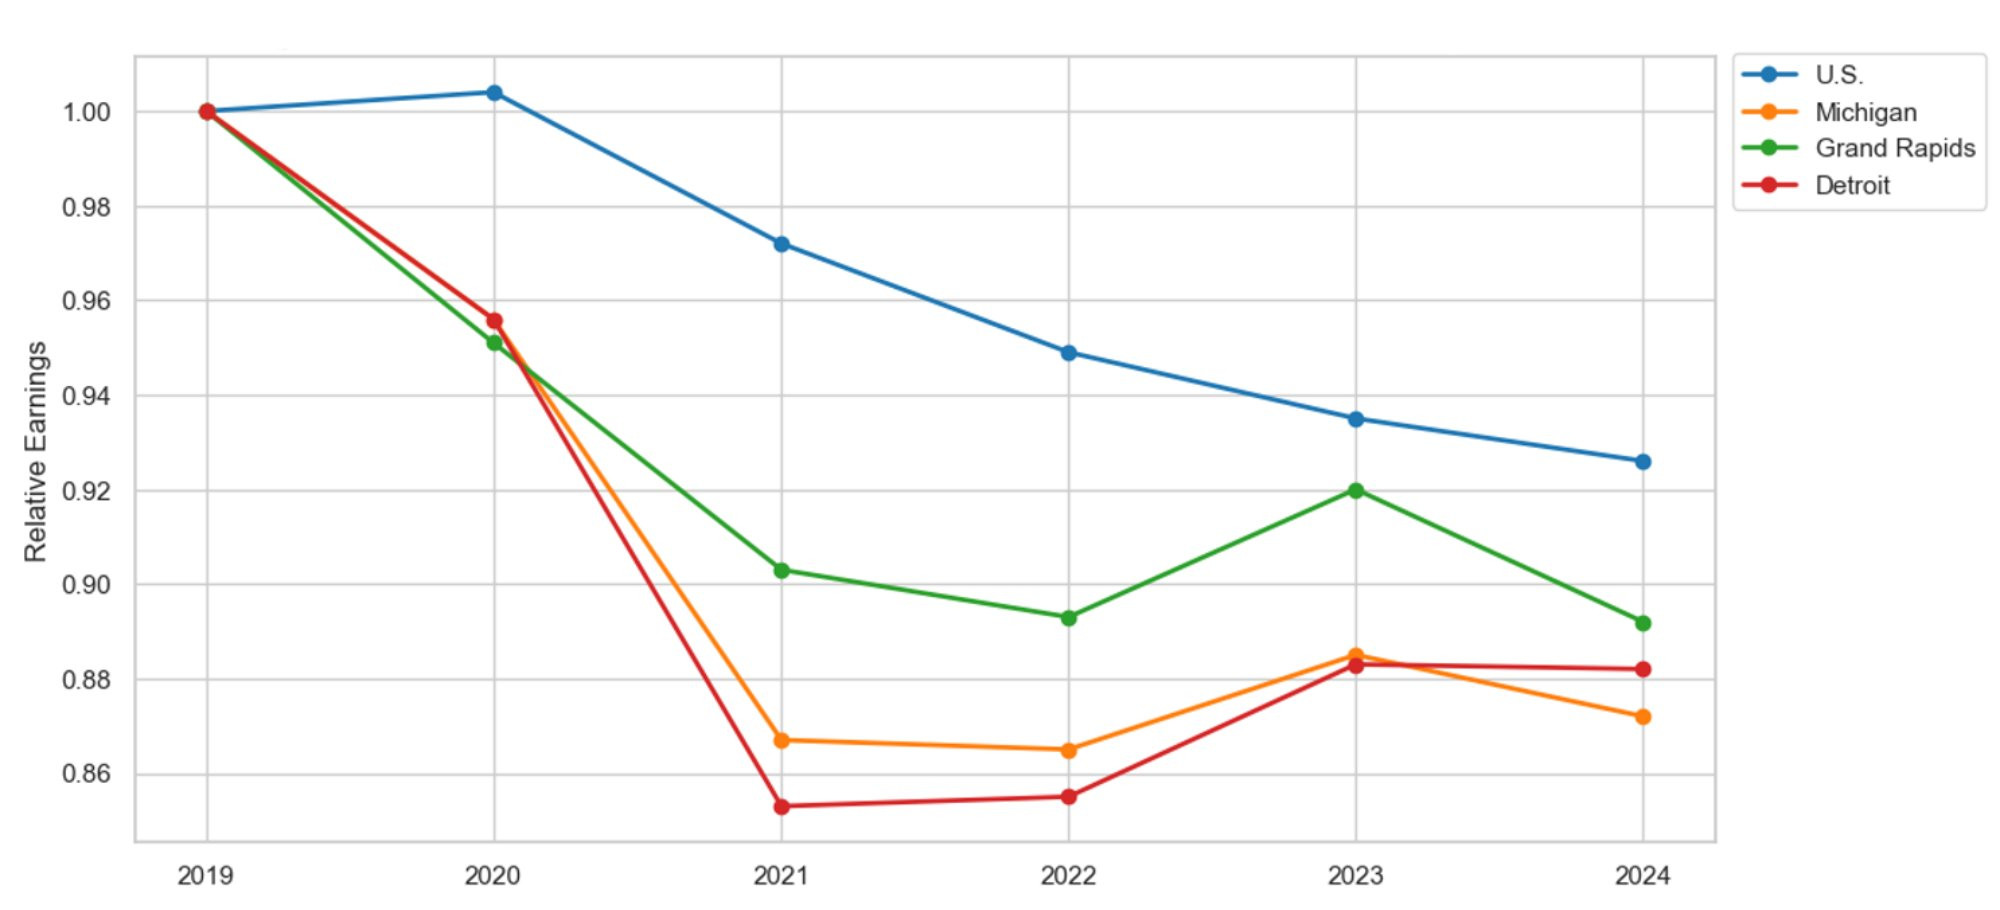
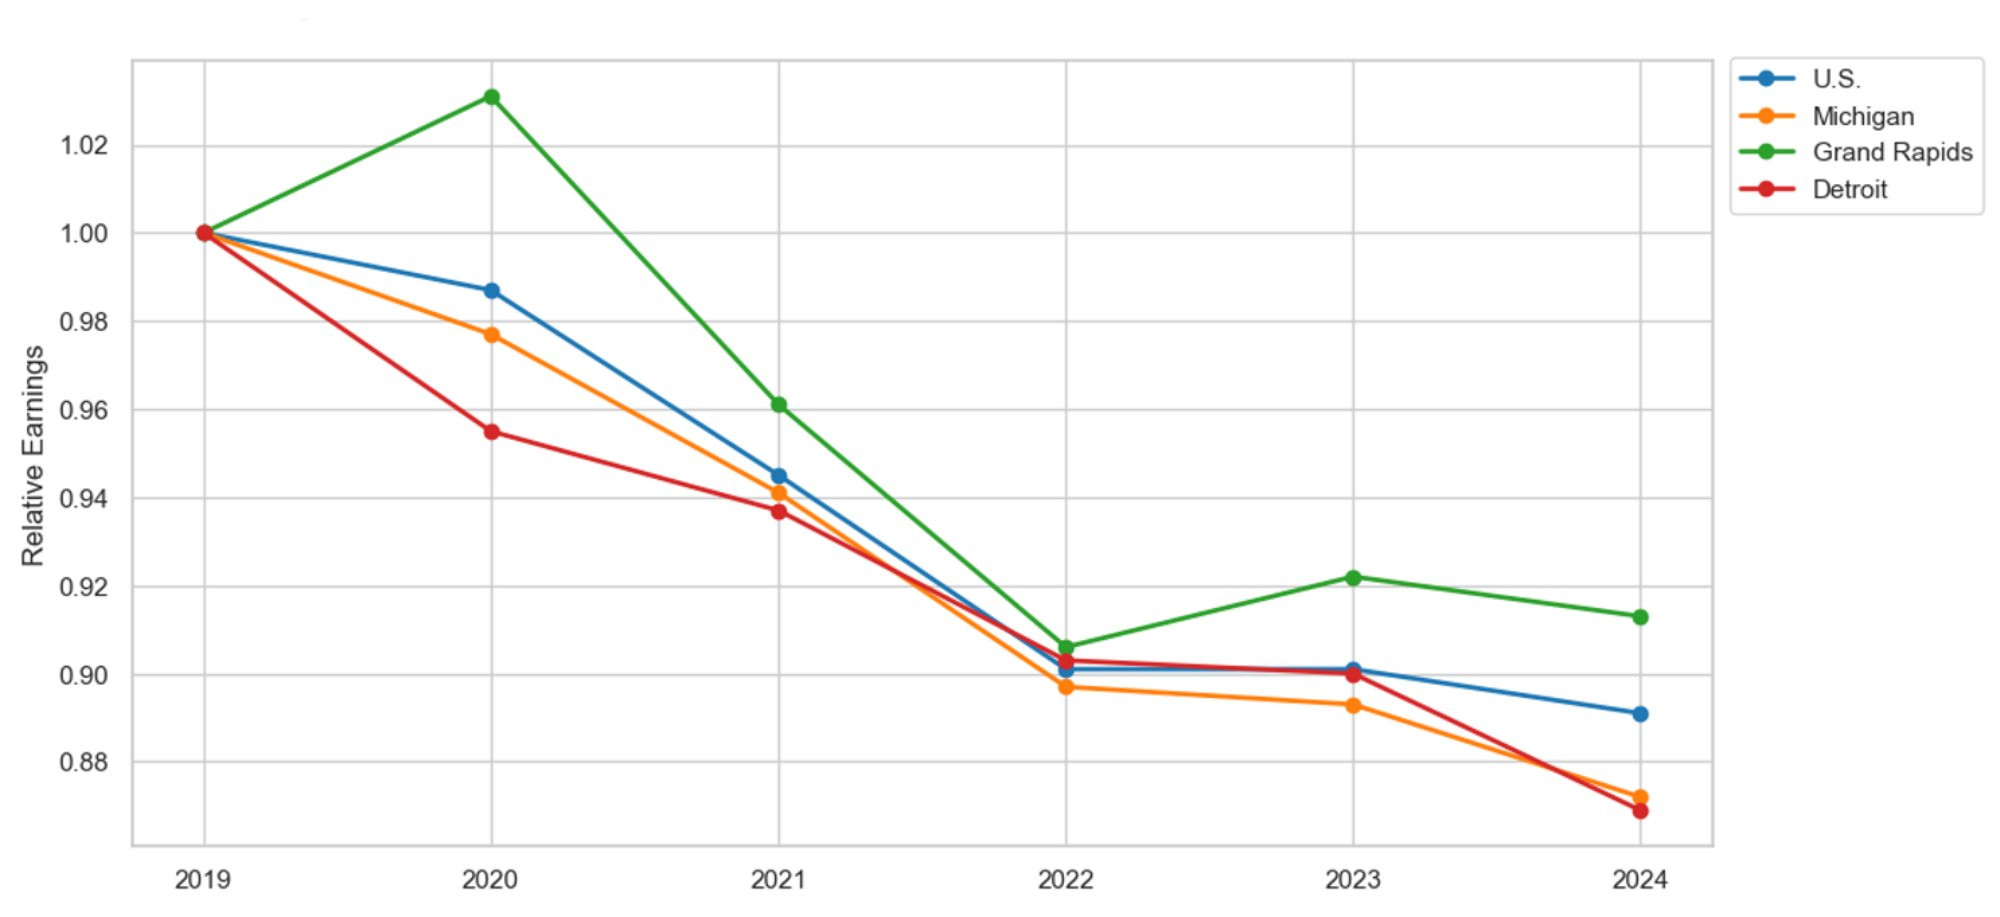
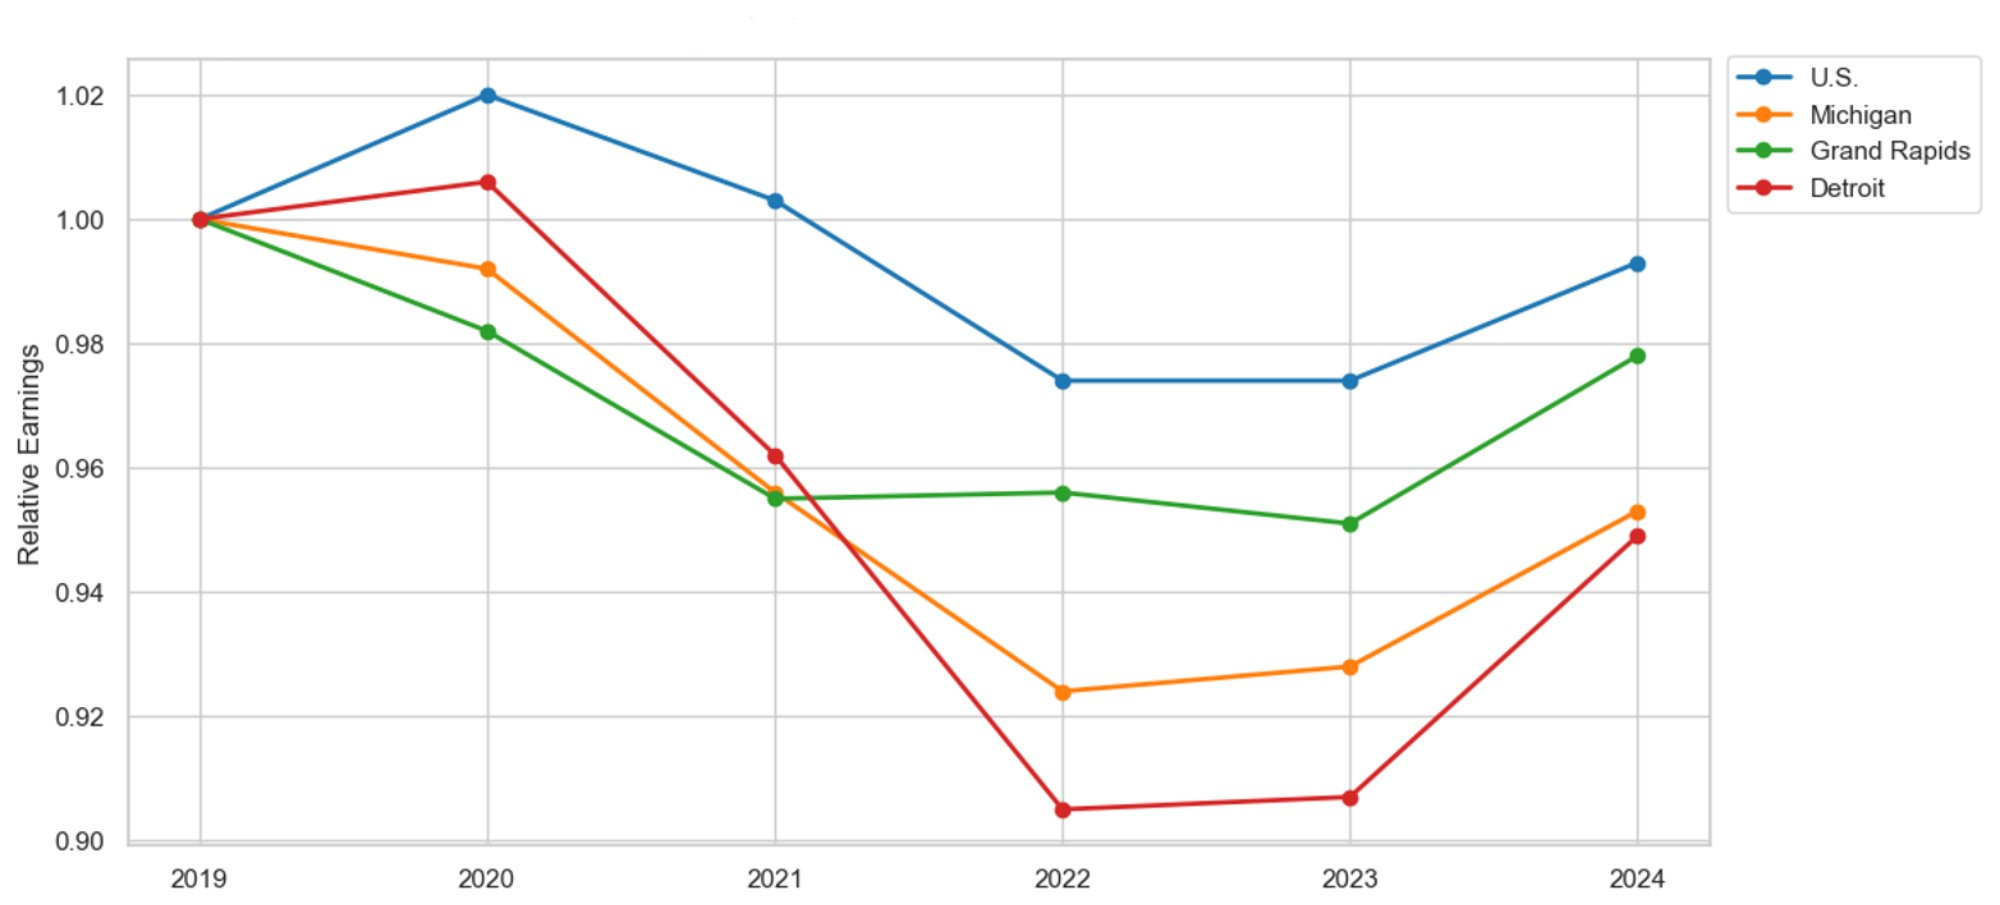
Figure 2: Relative Employment Since 2019
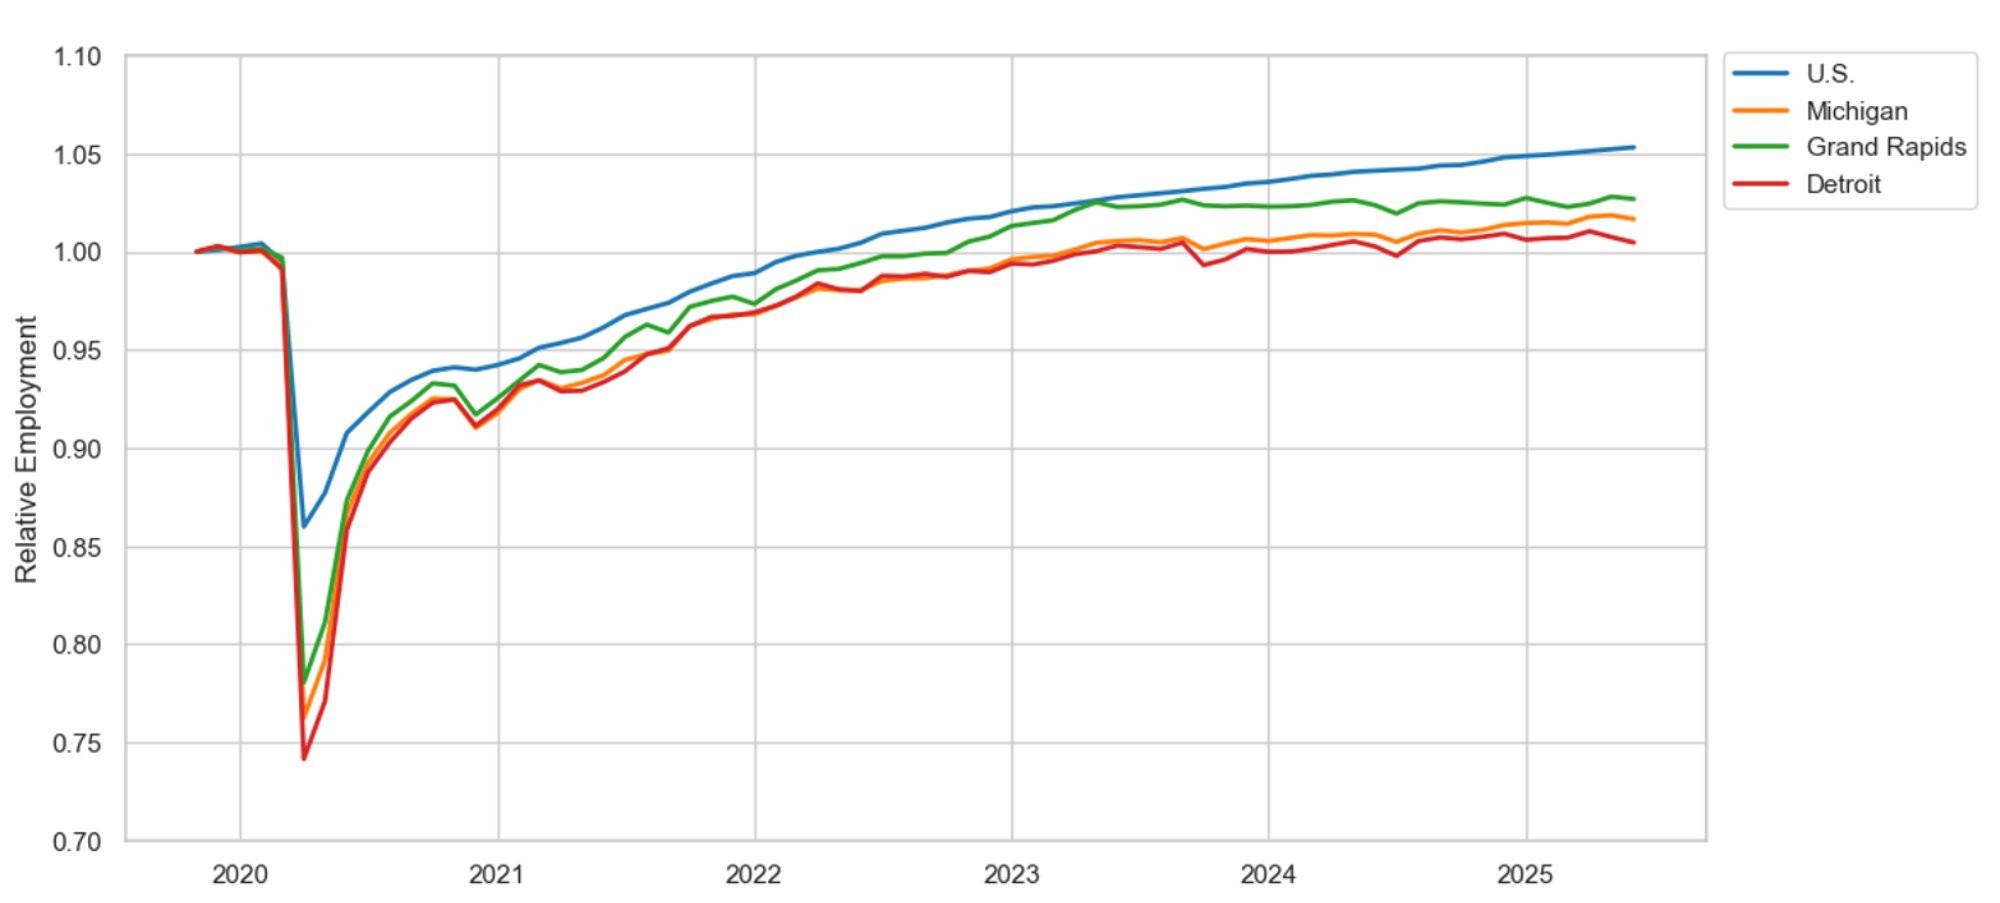
Description: Figure 2 highlights the rebound in employment since the start of the COVID-19 pandemic in 2019 in the U.S., Michigan, Grand Rapids, and Detroit. The employment rebound in Grand Rapids resembled the national rebound. By 2022, Grand Rapids began experiencing positive employment growth, which was not observed in Detroit or at the state level until 2023.
Source: U.S. Bureau of Labor Statistics
Since the onset of the COVID-19 pandemic in 2019, employment growth in Grand Rapids has lagged the national average but exceeded the state average. Since 2019, employment in Grand Rapids has increased by 2.7 percent, compared to 5.3 percent nationally and 1.7 percent at the state level. By 2022, employment in Grand Rapids had recovered to its pre-pandemic level, slightly slower than the U.S. recovery. Meanwhile, Detroit did not return to its pre-pandemic employment level until well into 2024. Even today, employment in Detroit has only increased by 0.4 percent since the start of the pandemic. To study only changes in total employment is to overlook the heterogeneity across industries and occupations. Therefore, we turn to our analysis at the industry level, focusing mainly on healthcare, before later tackling occupational differences within the healthcare industry.
Major Healthcare Industries
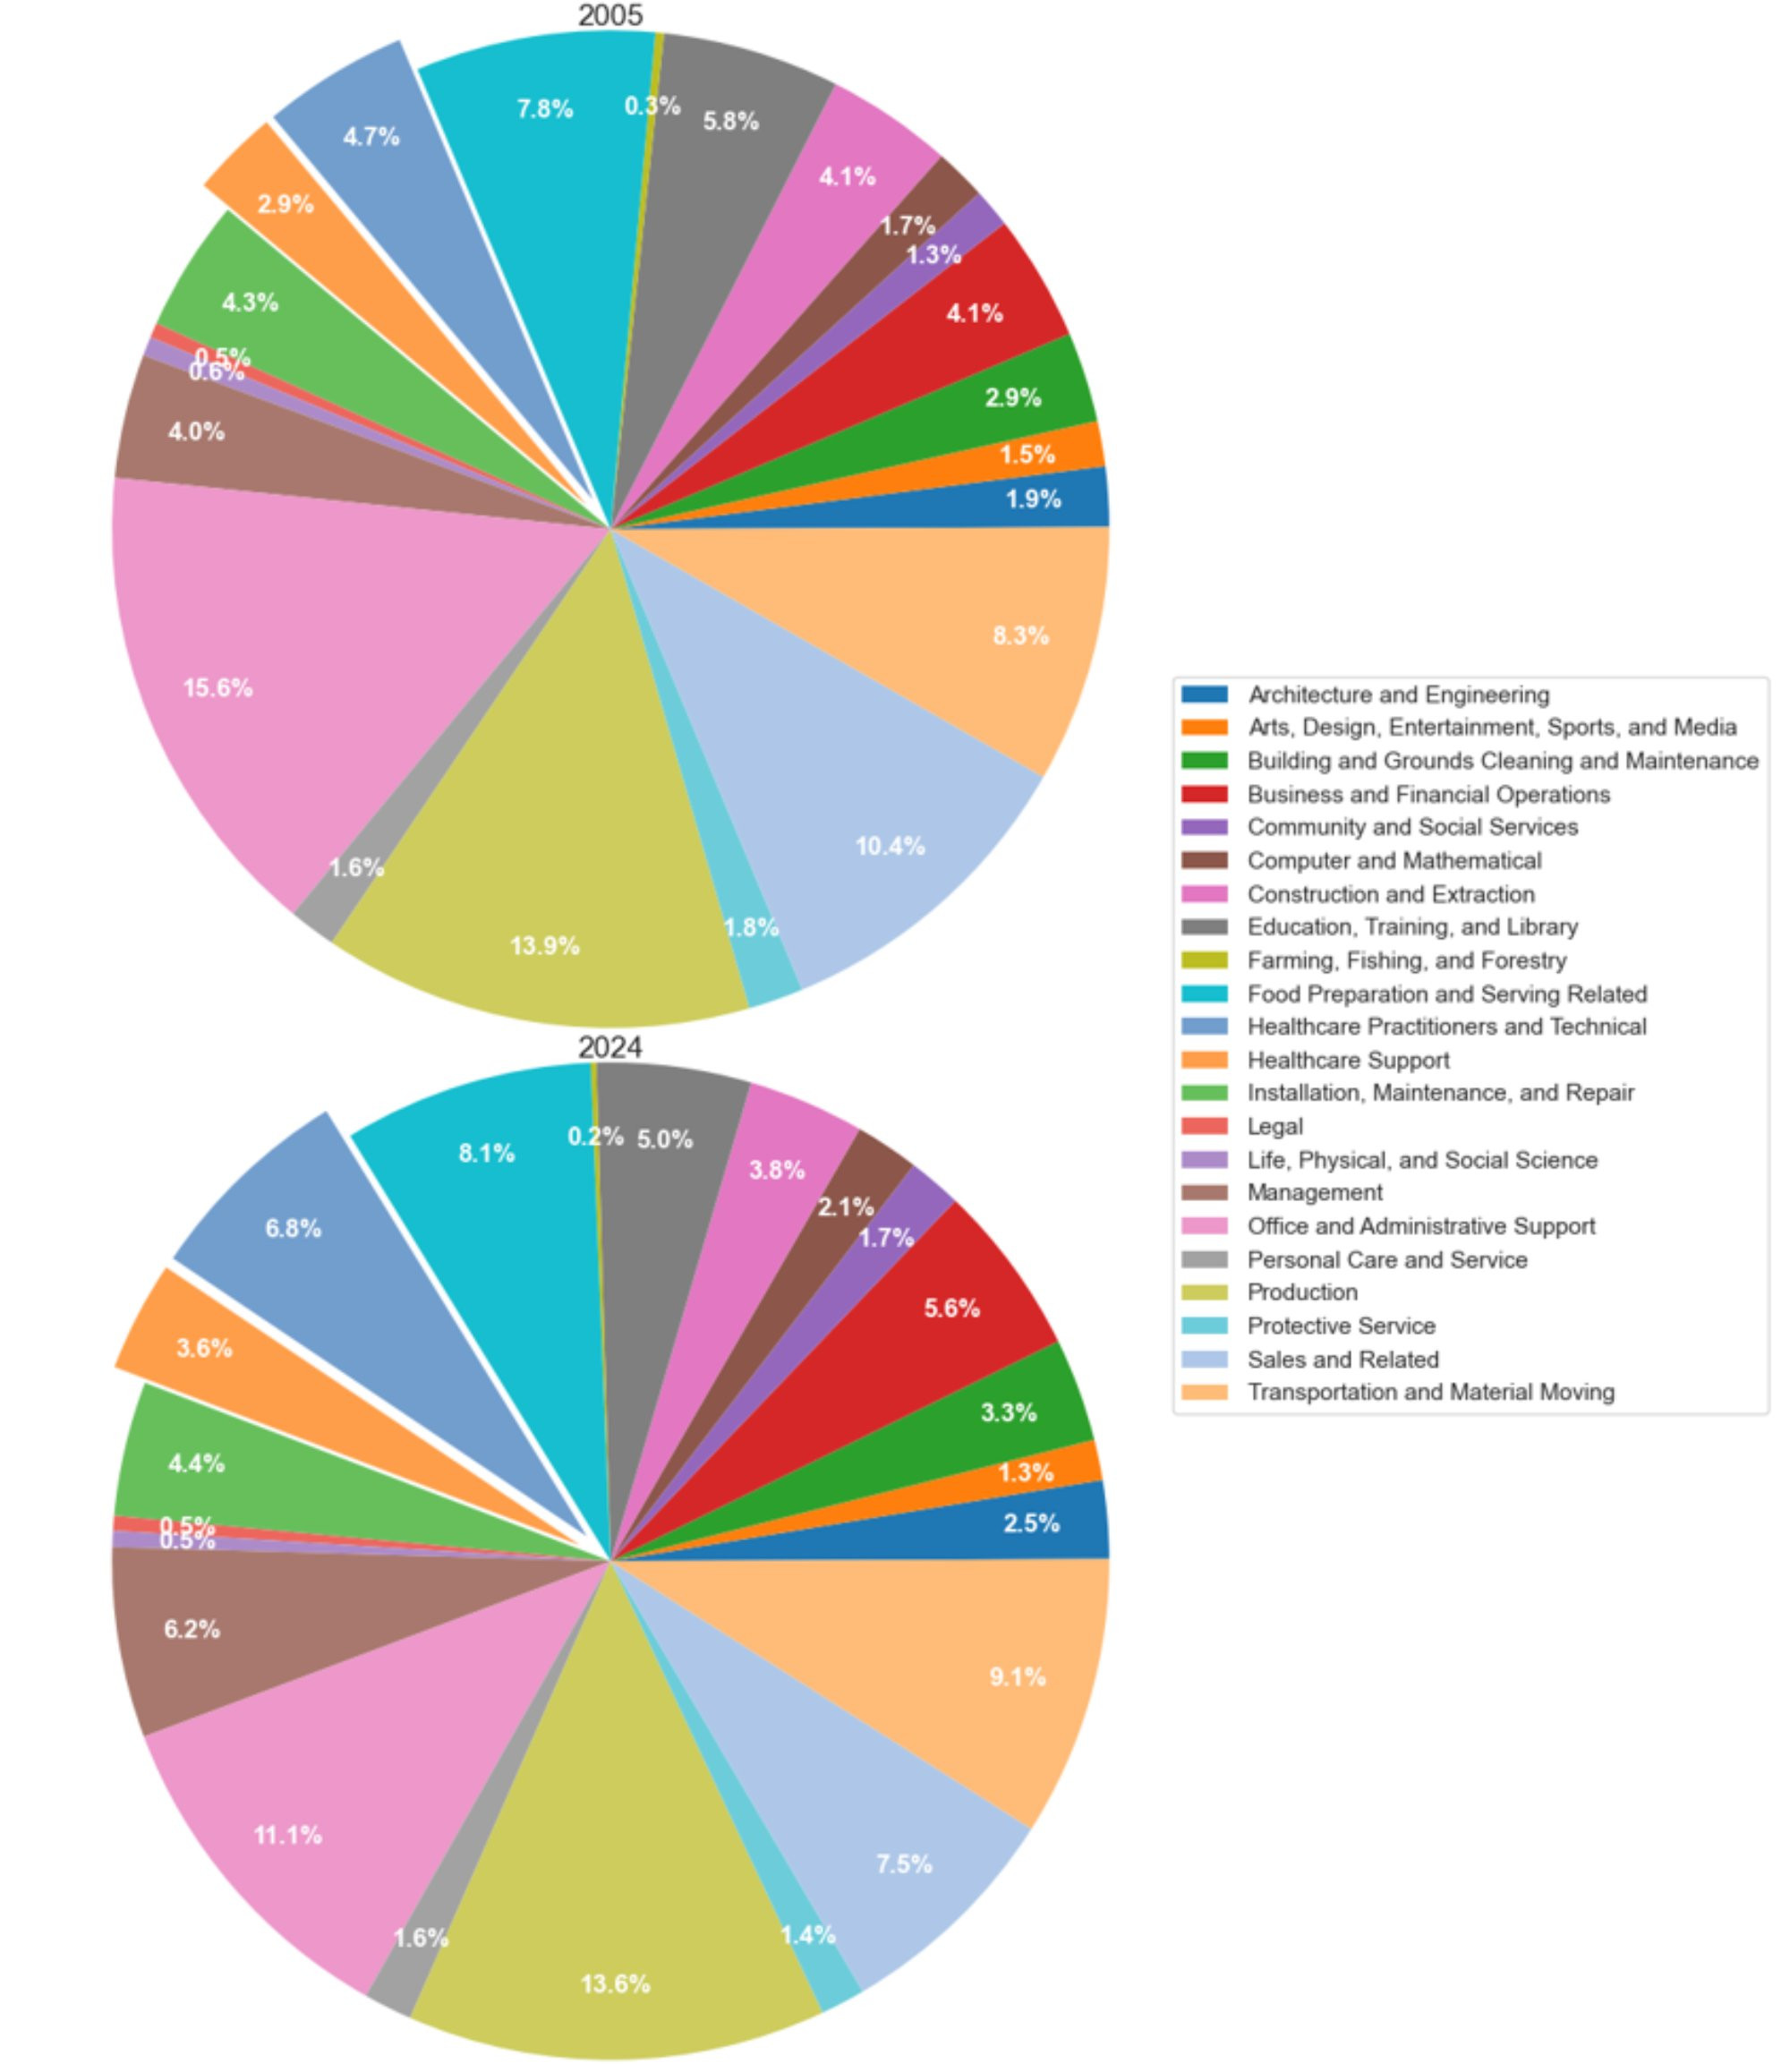
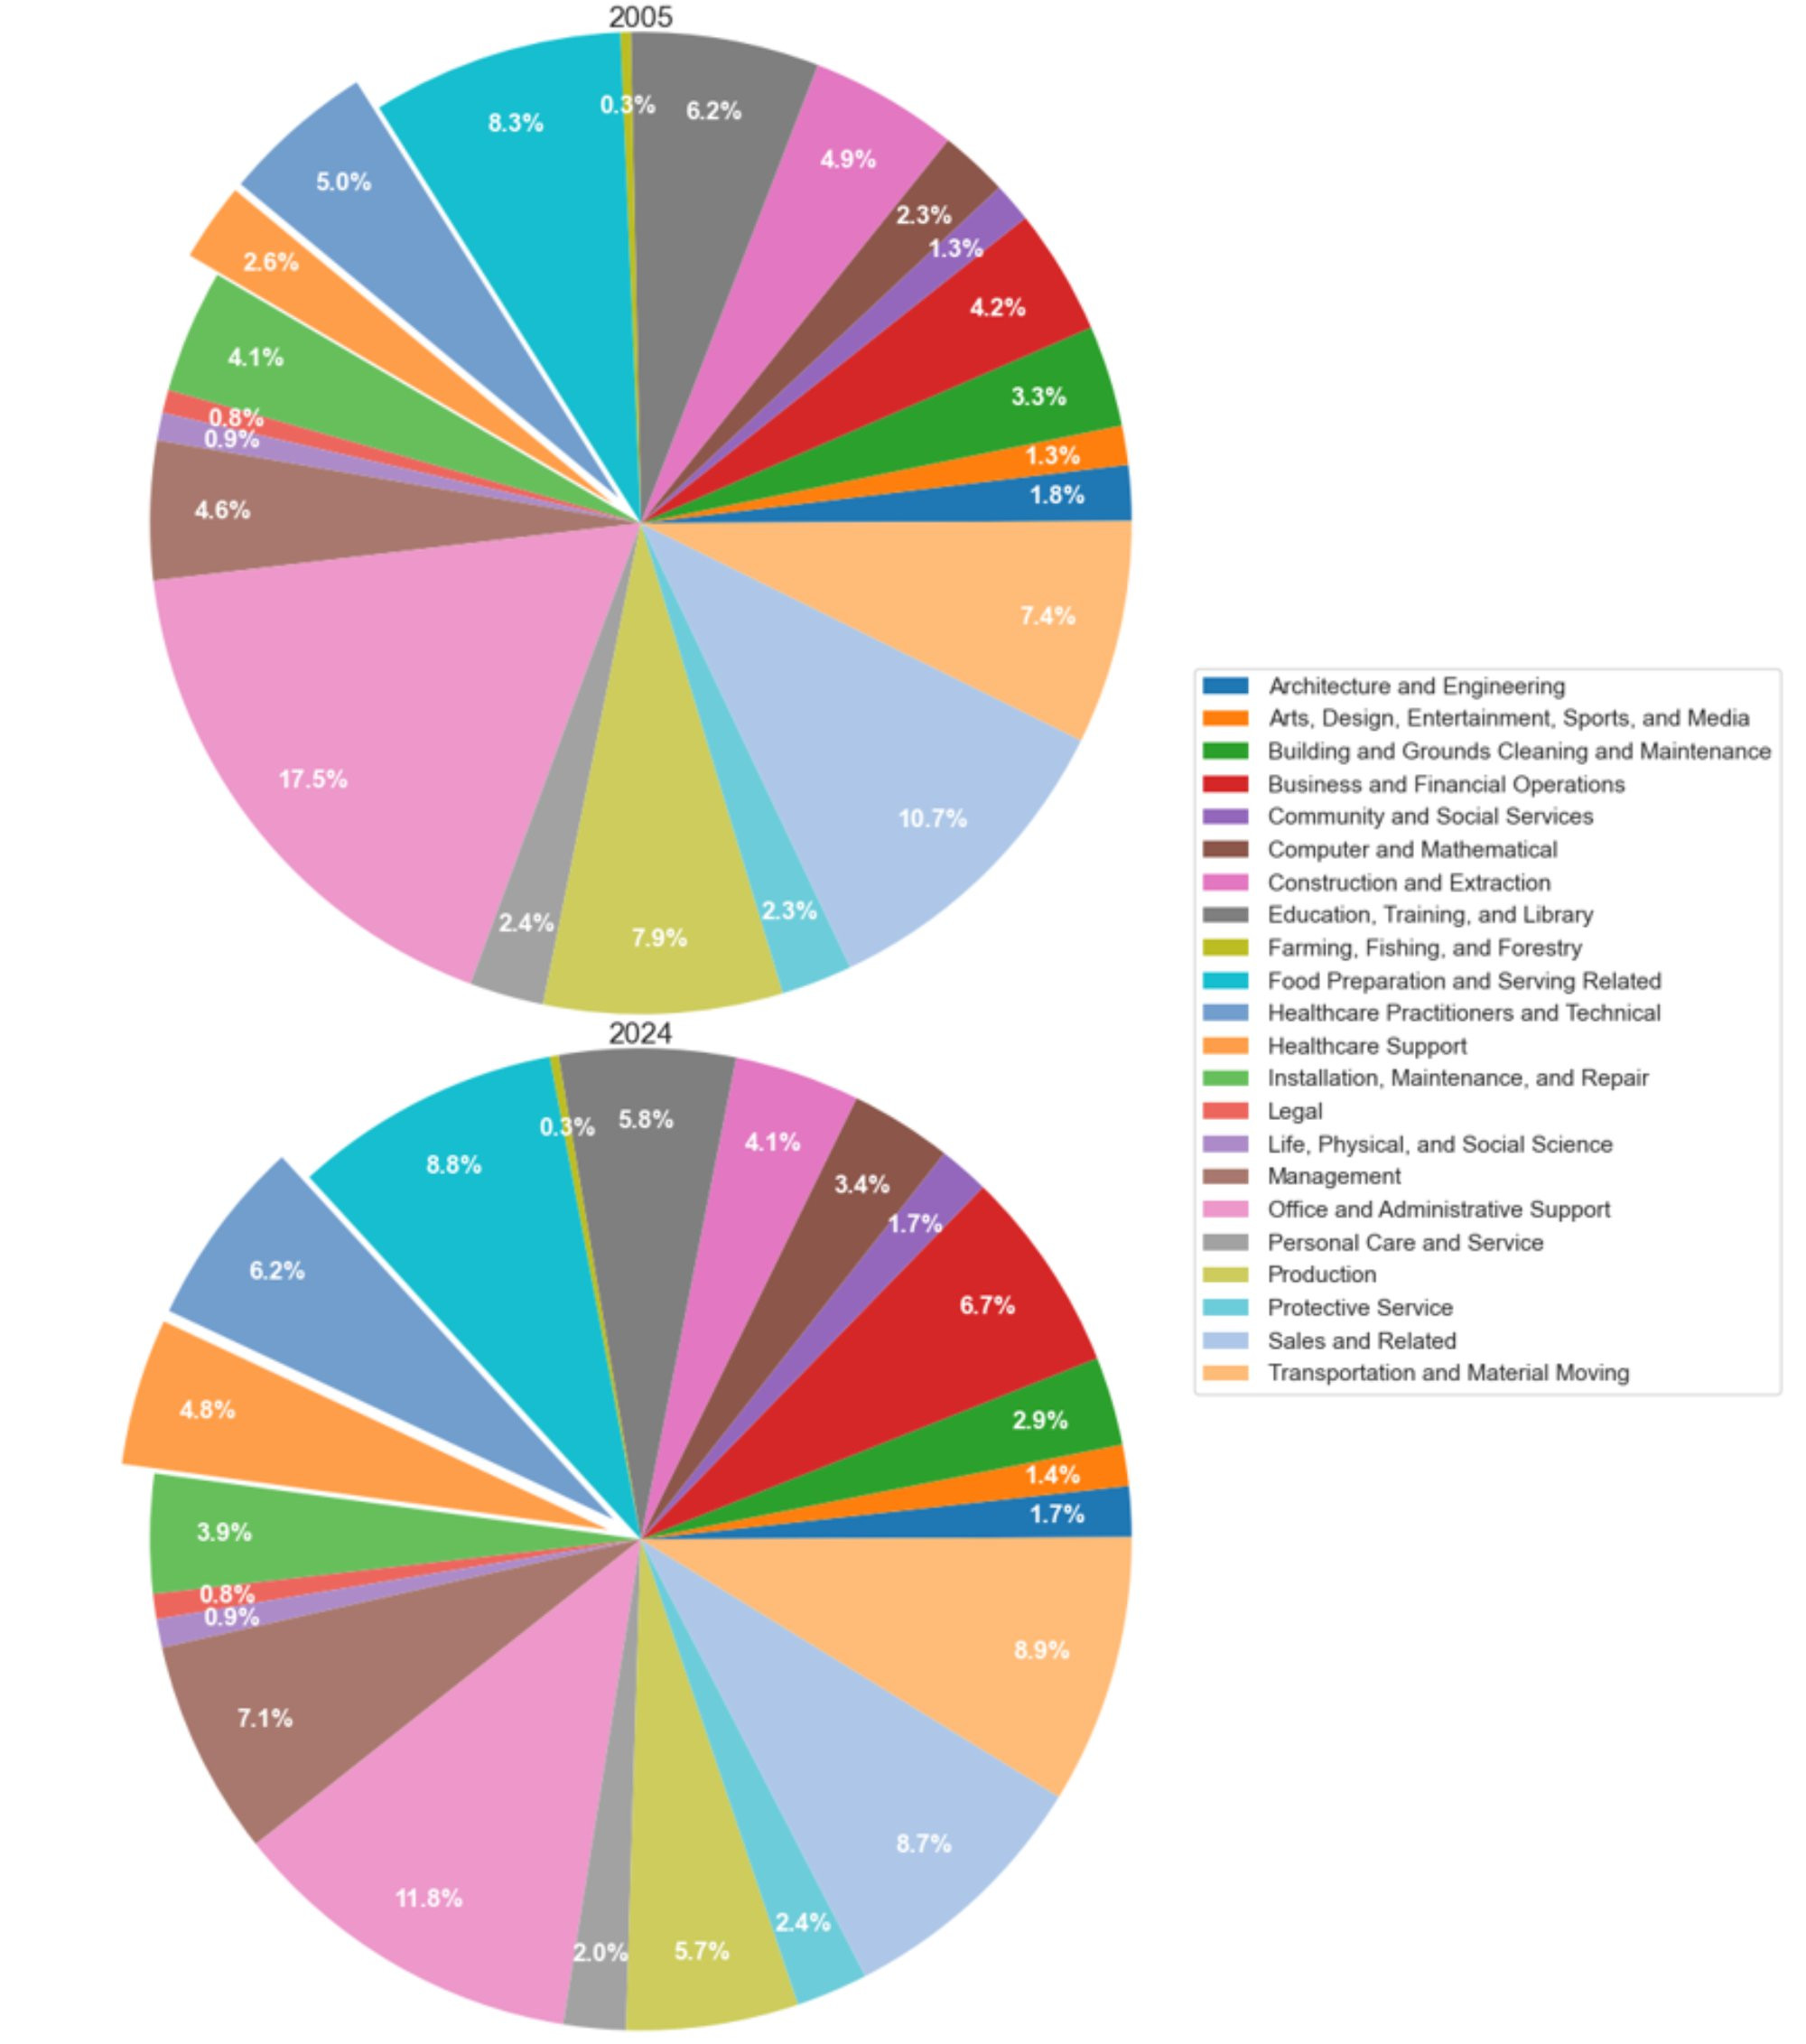
Figures 3 through 6 illustrate the evolution of industry employment since the onset of the Great Recession in the U.S., specifically in Michigan, including Grand Rapids and Detroit. Employment in each industry is taken as a percentage of total employment across all sectors to proxy the importance of that industry. All figures share a common trend: the relative importance of healthcare is increasing in all geographical samples. For example, healthcare practitioner and technical occupations, as well as healthcare support occupations, have collectively increased in Grand Rapids from 7.6 percent to 10.4 percent of total employment between 2005 and 2024. Healthcare is a vital component of West Michigan's economy, with 1 in 10 workers employed in the sector. Similar trends are found at the national and state levels. For example, healthcare as a percent of total employment has grown by 3.4 percent nationally, 2.7 percent at the state level, and by 3.4 percent in Detroit.
Figure 3: U.S. Industry Size and Importance by Employment Level
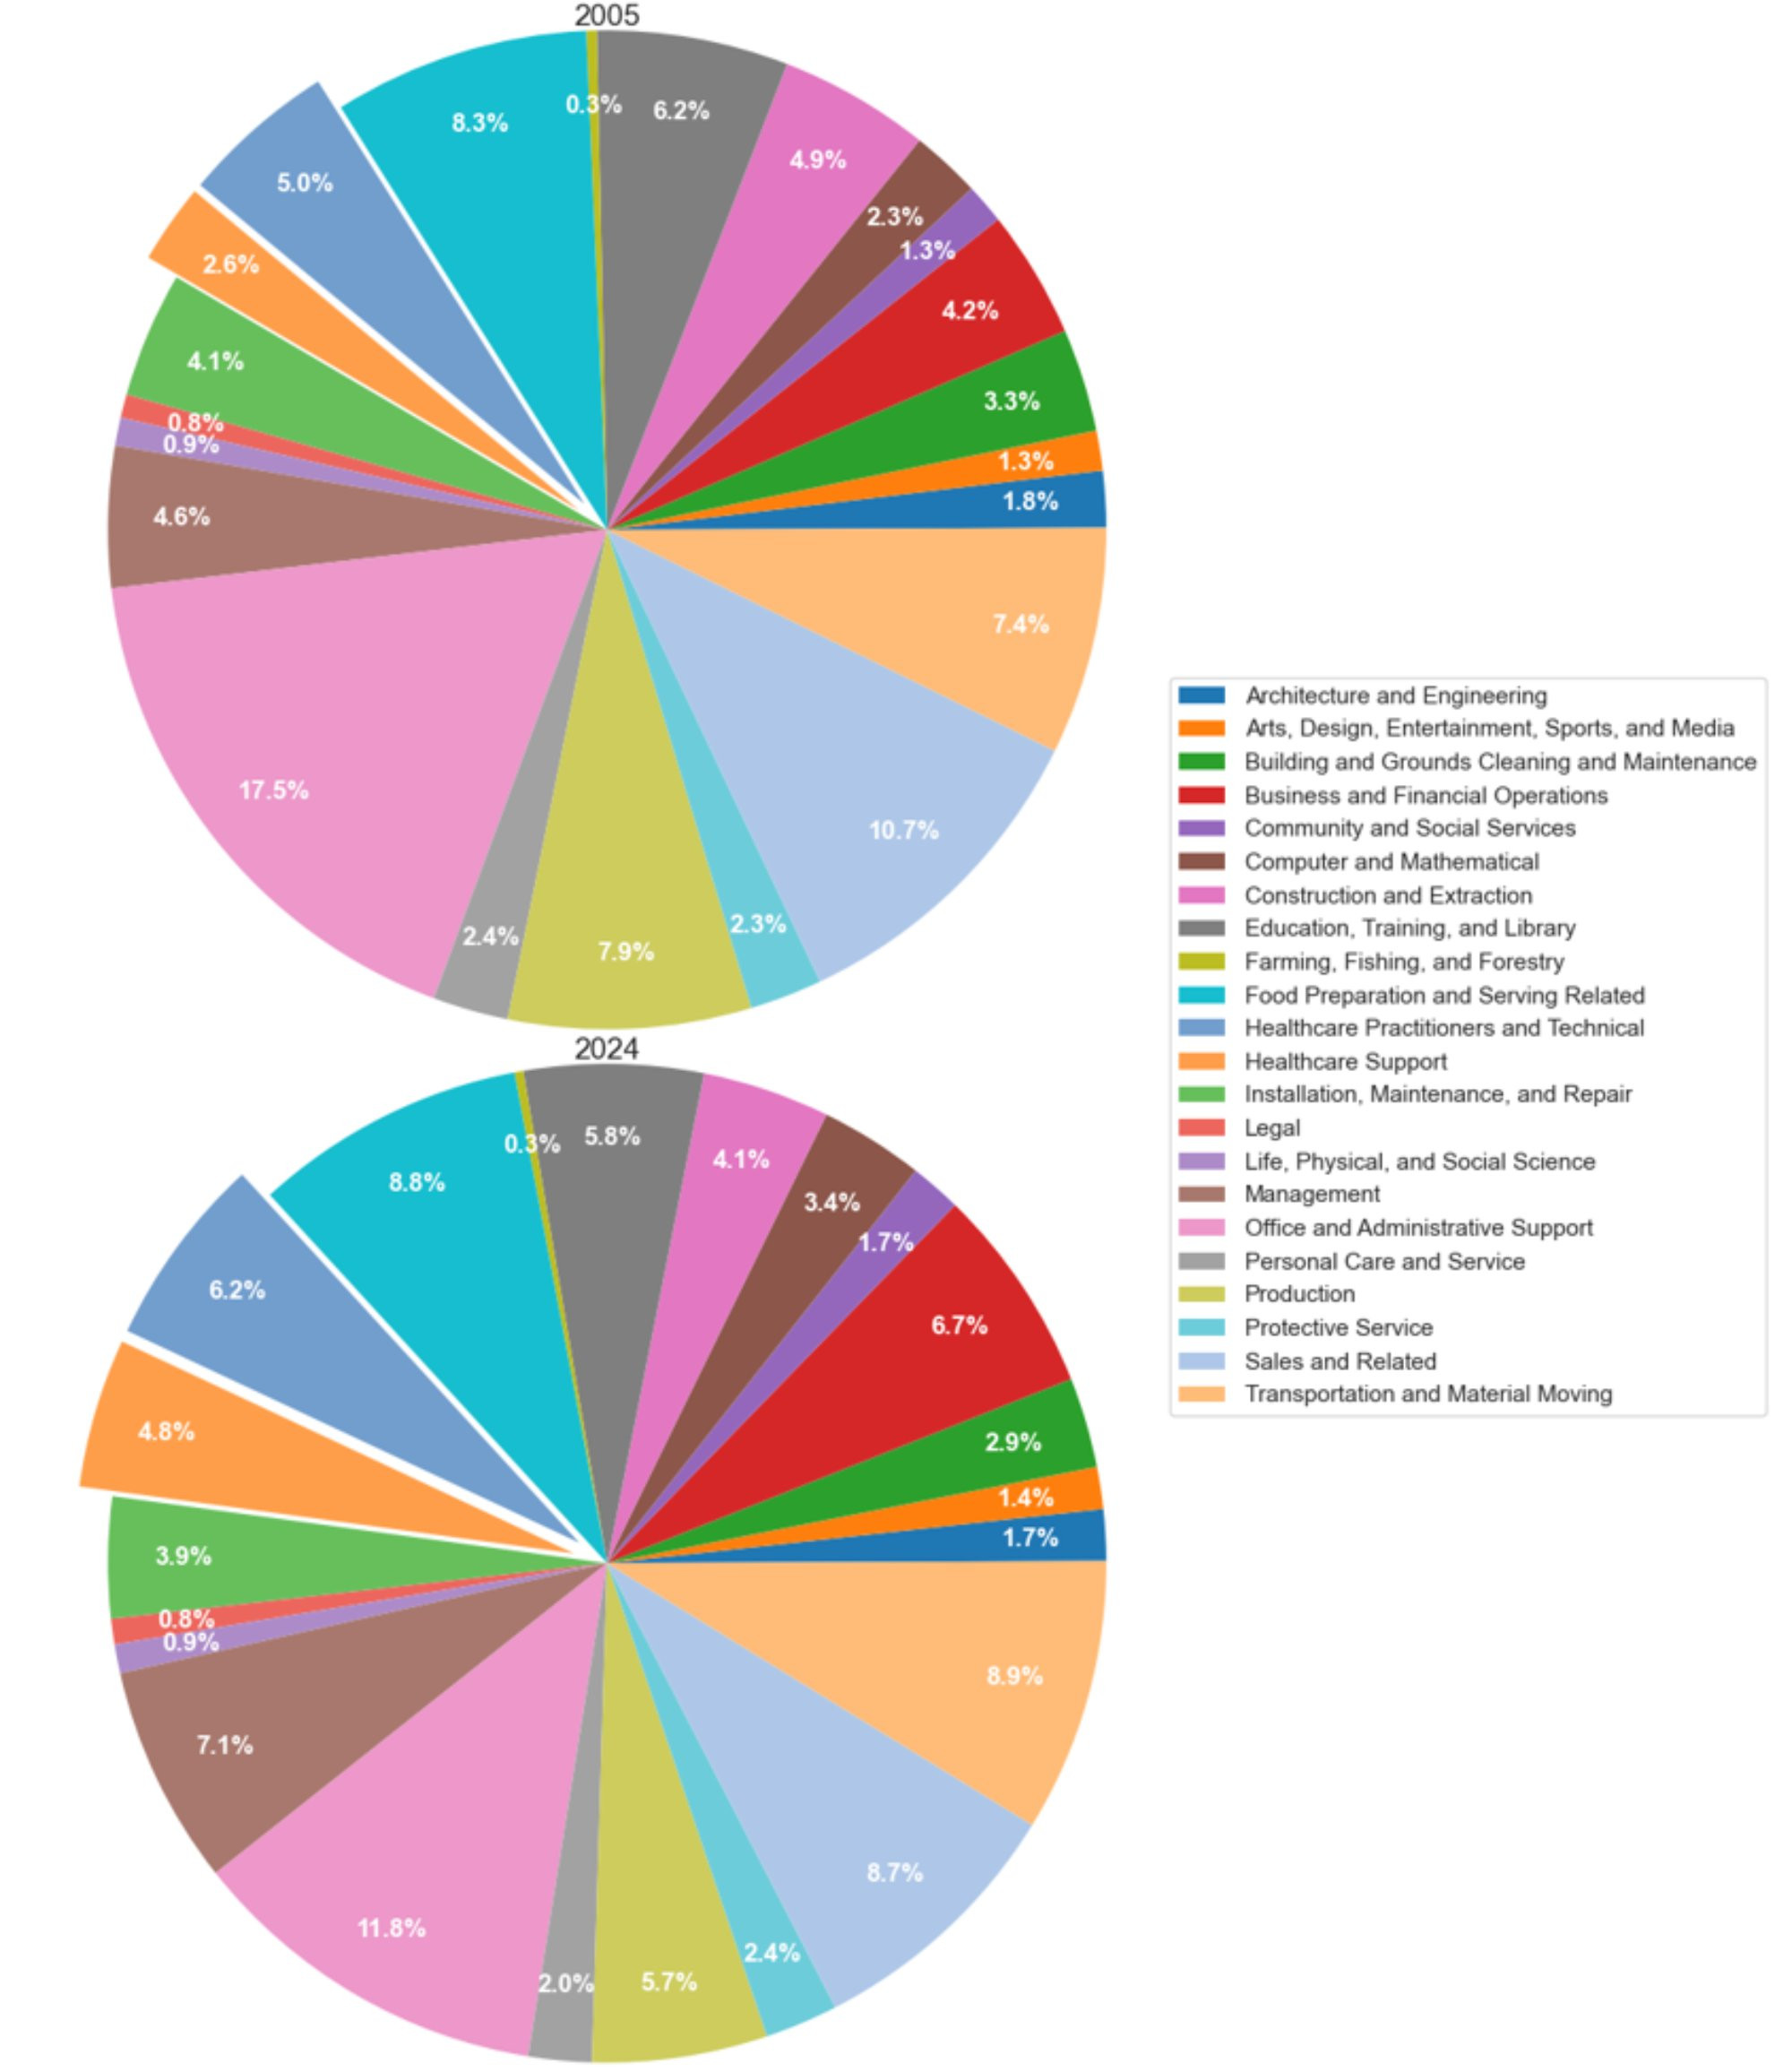
Description: Figure 3 shows the employment share of each major industry in the U.S. from 2005 to 2024. Healthcare’s employment share grew from 7.6 percent to 11 percent during this period. Employment in healthcare jobs increased by 44.7 percent between 2005 and 2024. Today, 1 in 10 workers is employed in U.S. healthcare occupations.
Source: U.S. Bureau of Labor Statistics
Figure 4: Michigan Industry Size and Importance by Employment Level
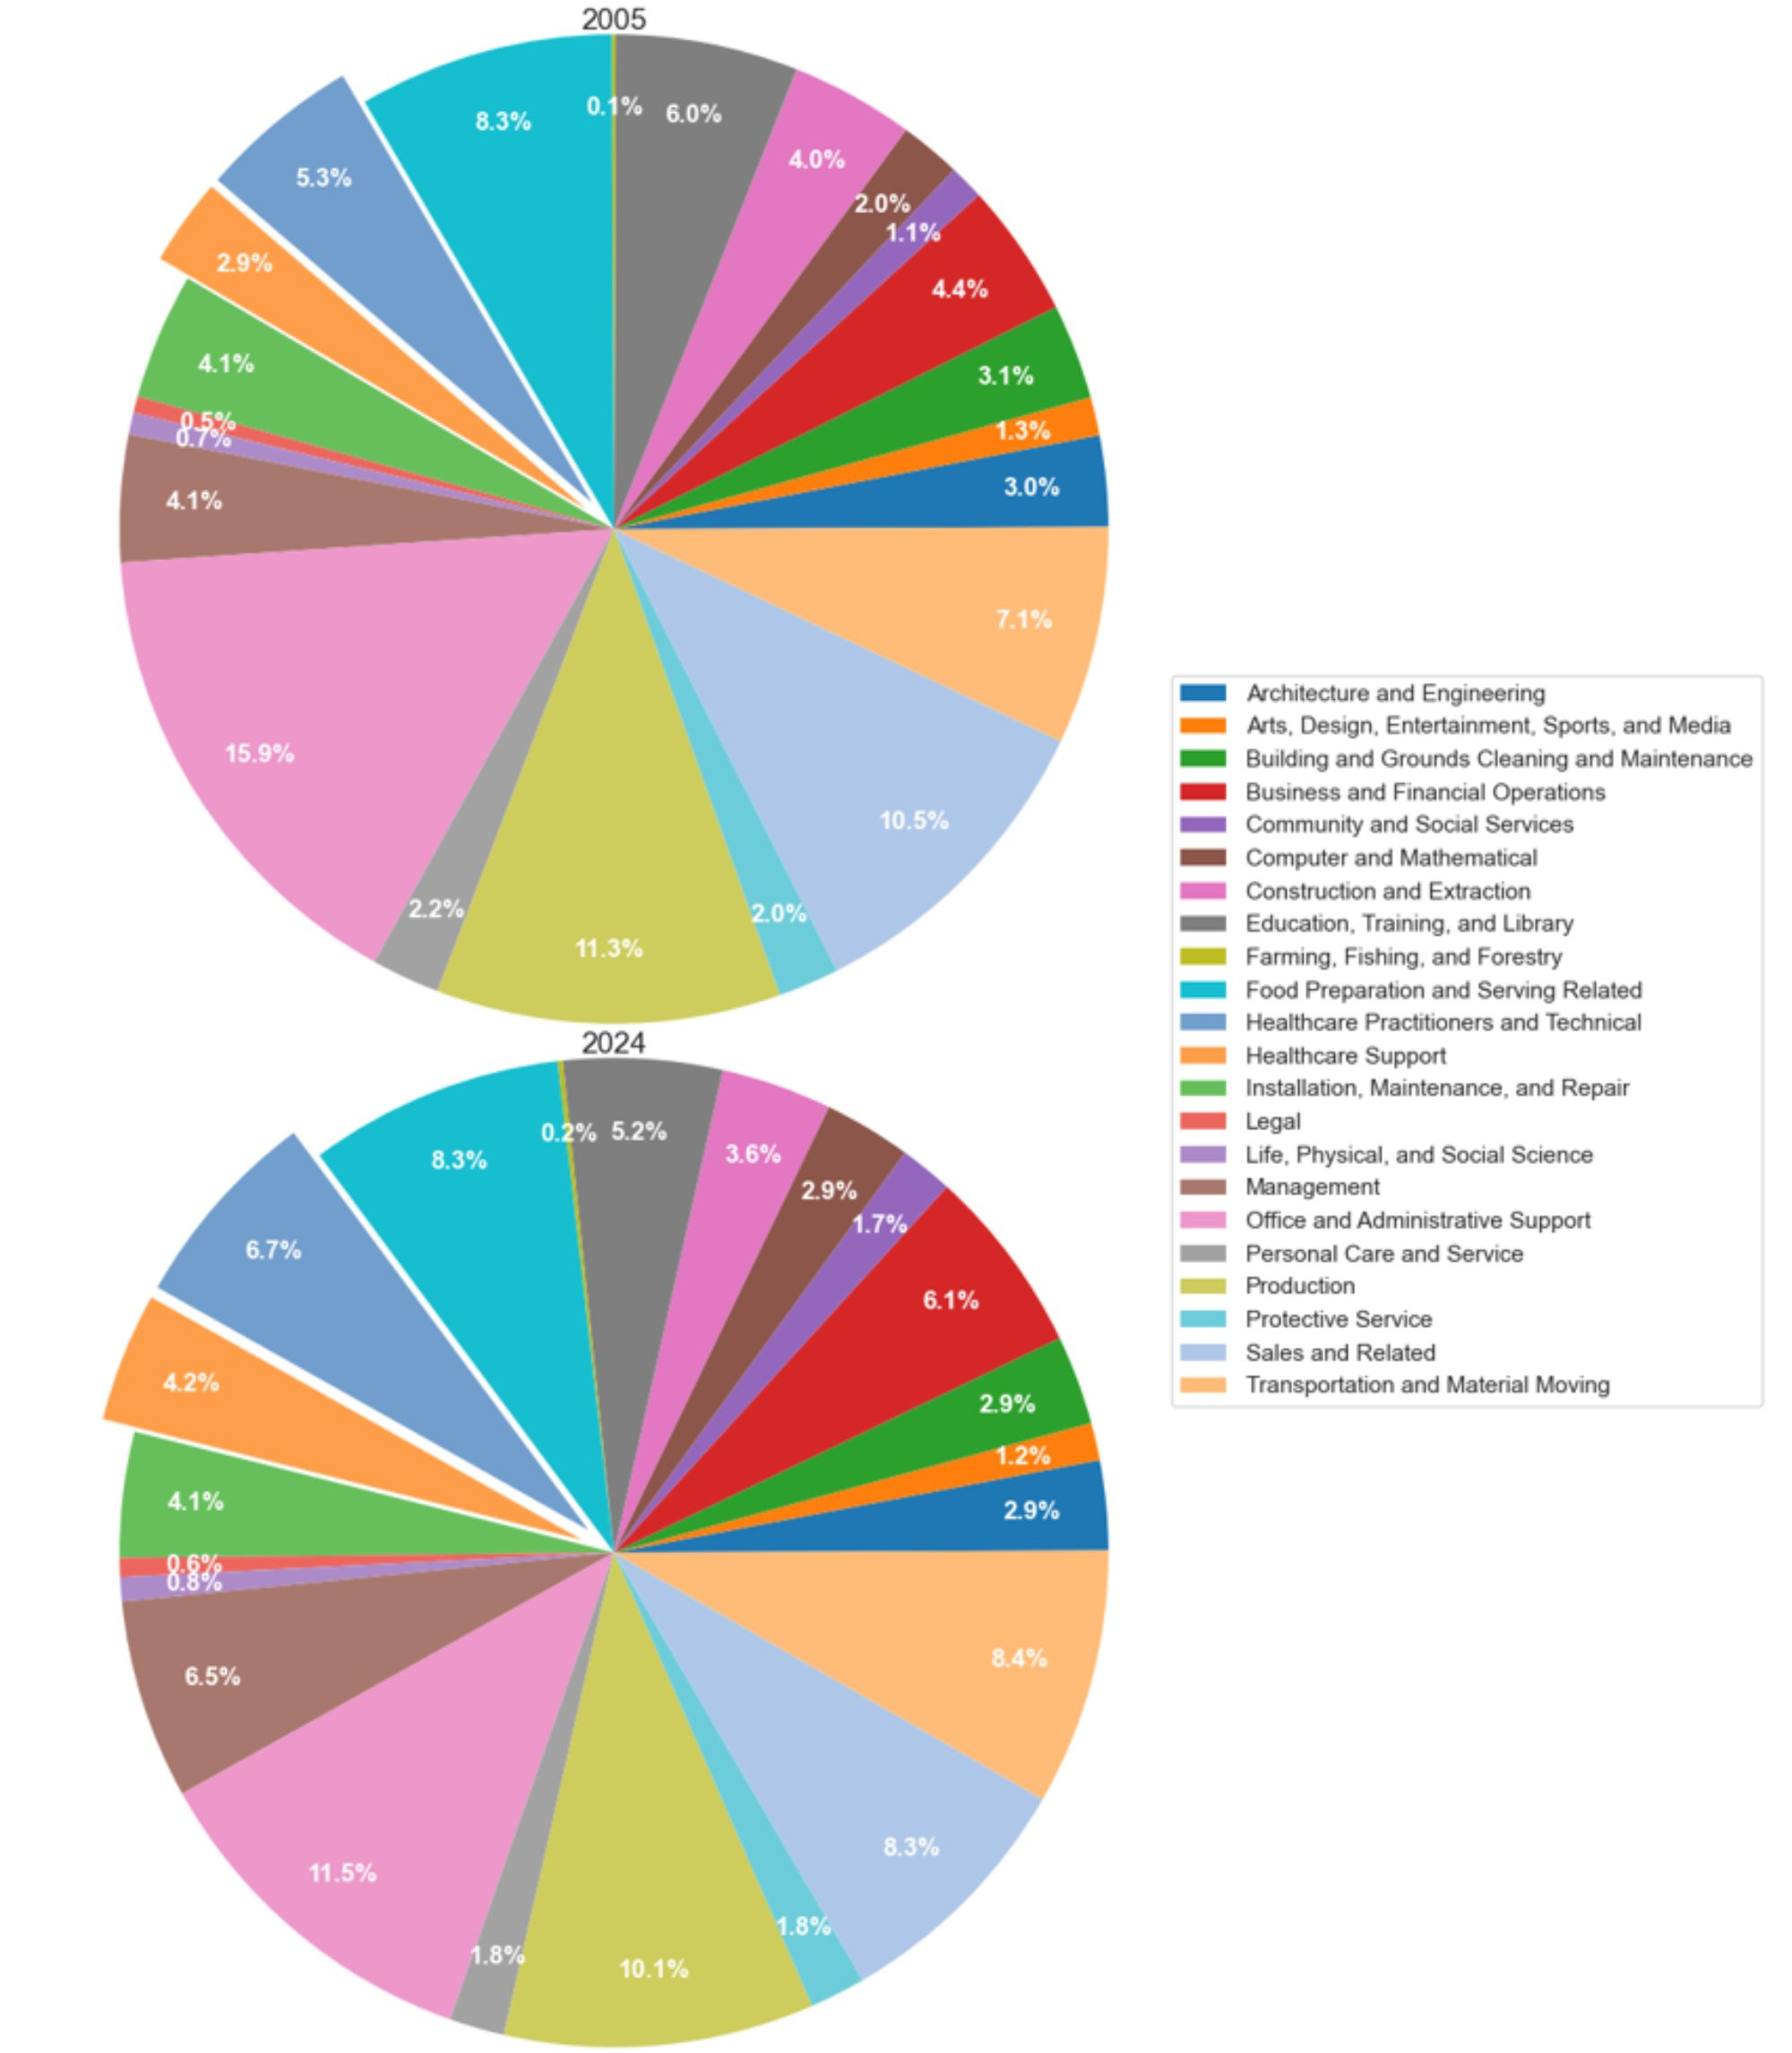
Description: Figure 4 shows the share of employment in each major industry in Michigan from 2005 to 2024. Healthcare’s employment share has grown from 8.2 percent to 10.9 percent during this period. Employment in healthcare occupations has increased by 32.9 percent between 2005 and 2024. Currently, 1 in 10 workers in Michigan works in healthcare occupations.
Source: Michigan Department of Technology, Management, and Budget
Figure 5: Grand Rapids Industry Size and Importance by Employment Level
Description: Figure 5 shows the share of employment in each major industry in Grand Rapids from 2005 to 2024. Healthcare’s employment share has grown from 7.6 percent to 10.4 percent during this period. Employment in healthcare occupations has increased by 36.8 percent between 2005 and 2024. Currently, 1 in 10 workers in Grand Rapids works in healthcare occupations.
Source: Michigan Department of Technology, Management, and Budget
Figure 6: Detroit Industry Size and Importance by Employment Level
Description: Figure 6 shows the share of employment in each major industry in Detroit from 2005 to 2024. Healthcare’s employment share has grown from 7.6 percent to 11 percent during this period. Employment in healthcare occupations has increased by 44.7 percent between 2005 and 2024. Currently, 1 in 10 workers in Detroit works in healthcare occupations.
Source: Michigan Department of Technology, Management, and Budget
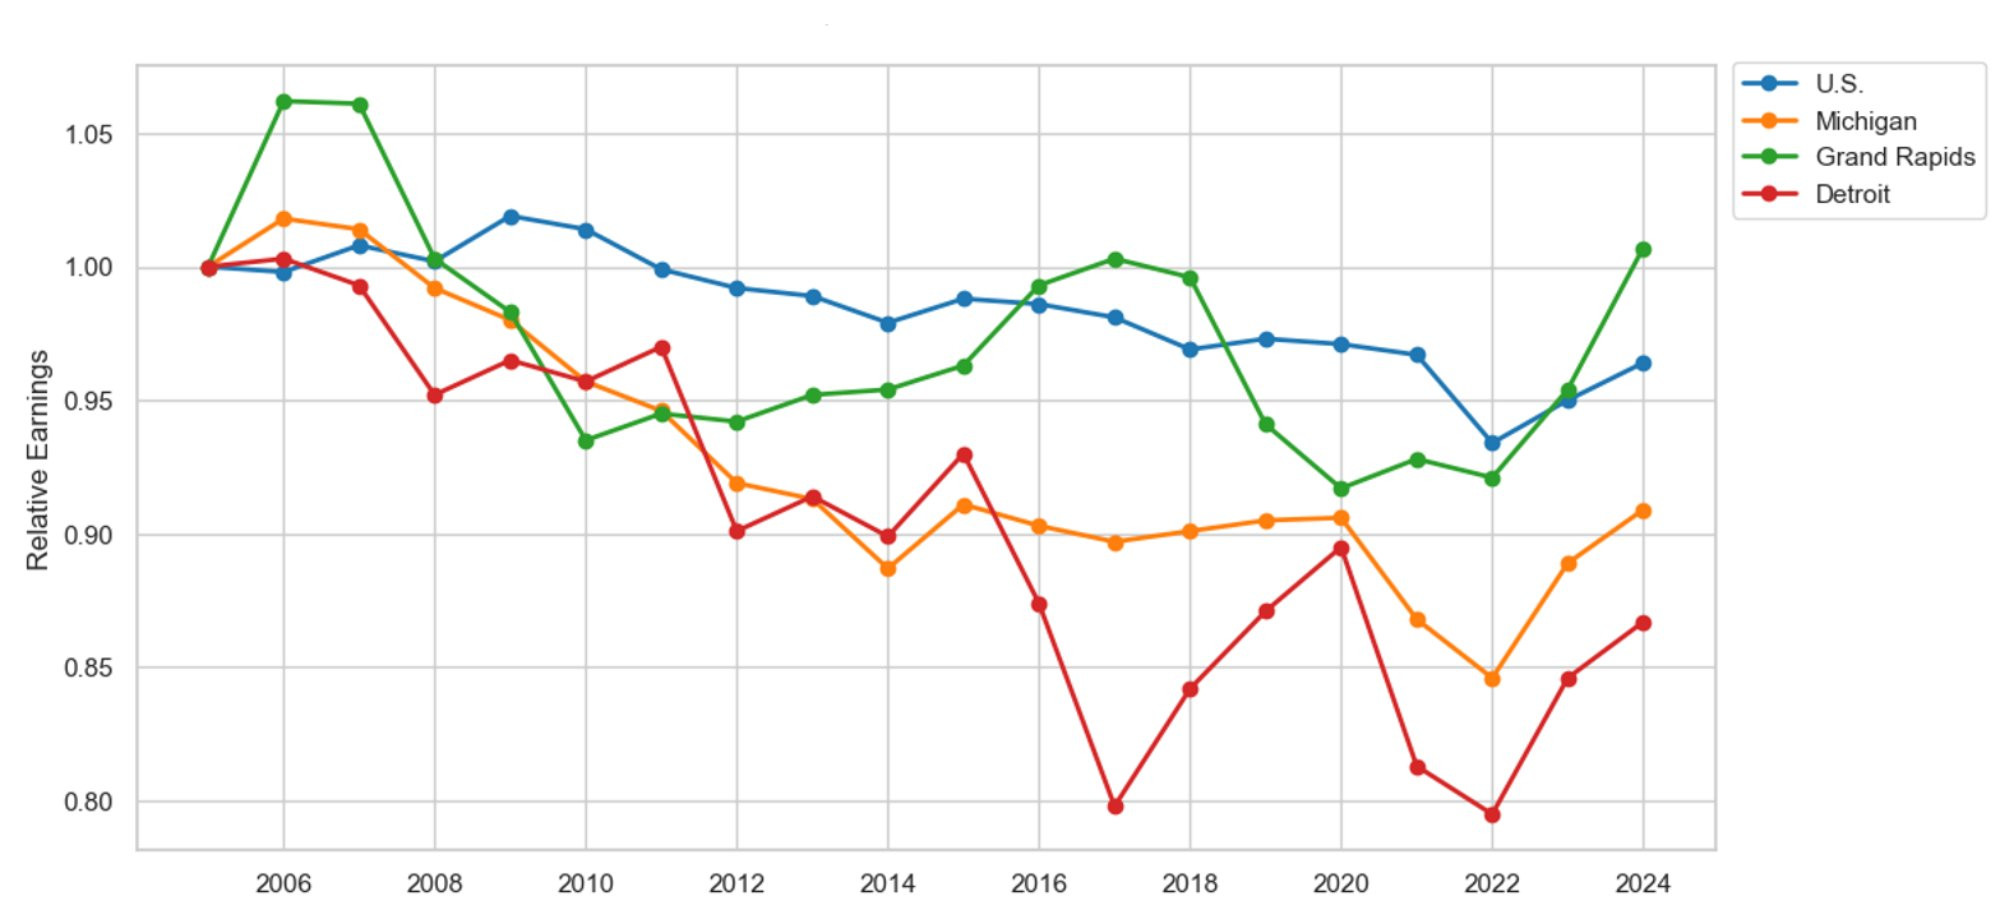
Figure 7 focuses on employment of healthcare practitioners and technical occupations in the U.S., Michigan, Grand Rapids, and Detroit relative to the start of the Great Recession in 2005. Since 2005, employment growth in Grand Rapids has persistently outpaced the national average. For example, by 2024, the number of healthcare practitioners and technical workers had increased by 110.1 percent in Grand Rapids. In comparison, healthcare employment had risen by 46.5 percent nationally during the same period. Also evident in this graph is that healthcare employment was largely unaffected by the Great Recession, continuing to grow in both East and West Michigan. By comparison, healthcare employment growth in Detroit lagged the national and state average until 2017, when Detroit observed a sharp spike in healthcare employment that has persisted to this day.
Figure 7: Healthcare Practitioner and Technical Occupation Employment Relative to 2005
Description: Figure 7 highlights the employment changes in healthcare practitioner and technical occupations in the U.S., Michigan, Grand Rapids, and Detroit since the start of the Great Recession in 2005. Healthcare employment growth in Grand Rapids outpaced the national average, indicating an above-average recovery from the Great Recession. Meanwhile, healthcare employment growth in Detroit lagged the national average, indicating a below-average recovery from the Great Recession.
Source: U.S. Bureau of Labor Statistics, Michigan Department of Technology, Management, and Budget
Figure 8 presents the relative inflation-adjusted earnings of healthcare practitioners and technical occupations in the U.S., Michigan, Grand Rapids, and Detroit since 2005. Since 2005, the inflation-adjusted incomes of healthcare practitioners and technical workers in Grand Rapids and Detroit have not kept pace with the national average. The inflation-adjusted earnings of healthcare workers have increased by 10.7 percent nationally. Meanwhile, the inflation-adjusted incomes of Grand Rapids-based healthcare workers have increased by only 3.9 percent during the same period, while earnings in Detroit have fallen by 9.6 percent. Figures 7 and 8 illustrate that healthcare providers in Grand Rapids and Detroit are getting more bang for their buck, paying less for talent than the national average, while attracting talent far beyond what is observed nationally. However, this finding also sounds a warning alarm; if pay does not keep pace with the national average, talent may find residence elsewhere. For example, suppose that national pay levels shape labor supply’s earnings expectations. In that case, the earnings observed in Grand Rapids and Detroit are not keeping pace with those expectations, which may prompt healthcare workers to seek employment elsewhere.
Figure 8: Healthcare Practitioner and Technical Occupation Inflation-Adjusted Earnings Relative to 2005
Description: Figure 8 shows the change in inflation-adjusted earnings relative to 2005 for healthcare practitioner and technical occupations in the U.S., Michigan, Grand Rapids, and Detroit. Healthcare earnings in Grand Rapids and Detroit did not keep pace with the national average, indicating a below-average recovery from the Great Recession.
Source: U.S. Bureau of Labor Statistics, Michigan Department of Technology, Management, and Budget
Figure 9 reproduces Figure 7 using healthcare support occupations in the U.S., Michigan, Grand Rapids, and Detroit since the beginning of the Great Recession in 2005. Employment in healthcare support occupations grew in tandem with the national average in both Grand Rapids and Detroit through 2017. Similar to the story told in Figure 7, Detroit-based healthcare support occupations observed a spike in employment in 2017, which has persisted to this day. Meanwhile, healthcare support employment growth in Grand Rapids now lags the national average. Healthcare support occupations have increased by 280.6 percent in Detroit since 2005, 121.4 percent nationally, and by 83.3 percent in Grand Rapids.
Figure 9: Healthcare Support Occupation Employment Relative to 2005
Description: Figure 9 highlights the employment changes in healthcare support occupations in the U.S., Michigan, Grand Rapids, and Detroit since the start of the Great Recession in 2005. Healthcare support employment growth in Grand Rapids and Detroit lagged the national average, indicating a below-average recovery from the Great Recession.
Source: U.S. Bureau of Labor Statistics, Michigan Department of Technology, Management, and Budget
Figure 10 presents the inflation-adjusted earnings measure for healthcare support occupations in the U.S., Michigan, Grand Rapids, and Detroit since the start of the Great Recession in 2005. Similar to Figure 8, the inflation-adjusted earnings of healthcare support workers have lagged the national average in Grand Rapids and Detroit. For example, while healthcare support occupations have observed a 3.5 percent increase in inflation-adjusted earnings nationally, their incomes have risen by only 1.1 percent in Grand Rapids and have actually fallen by 2.9 percent in Detroit. Figures 9 and 10 yield the same peculiar finding observed in Figures 7 and 8: healthcare support occupations grew in Grand Rapids and Detroit despite a pay system that does not keep pace with earnings expectations. How long will this trend last? Can we reasonably assume this trend will persist?
Figure 10: Healthcare Support Occupation Inflation-Adjusted Earnings Relative to 2005
Description: Figure 10 shows the change in inflation-adjusted earnings relative to 2005 for healthcare support occupations in the U.S., Michigan, Grand Rapids, and Detroit. Healthcare support earnings in Grand Rapids and Detroit did not keep pace with the national average, indicating a below-average recovery from the Great Recession.
Source: U.S. Bureau of Labor Statistics, Michigan Department of Technology, Management, and Budget
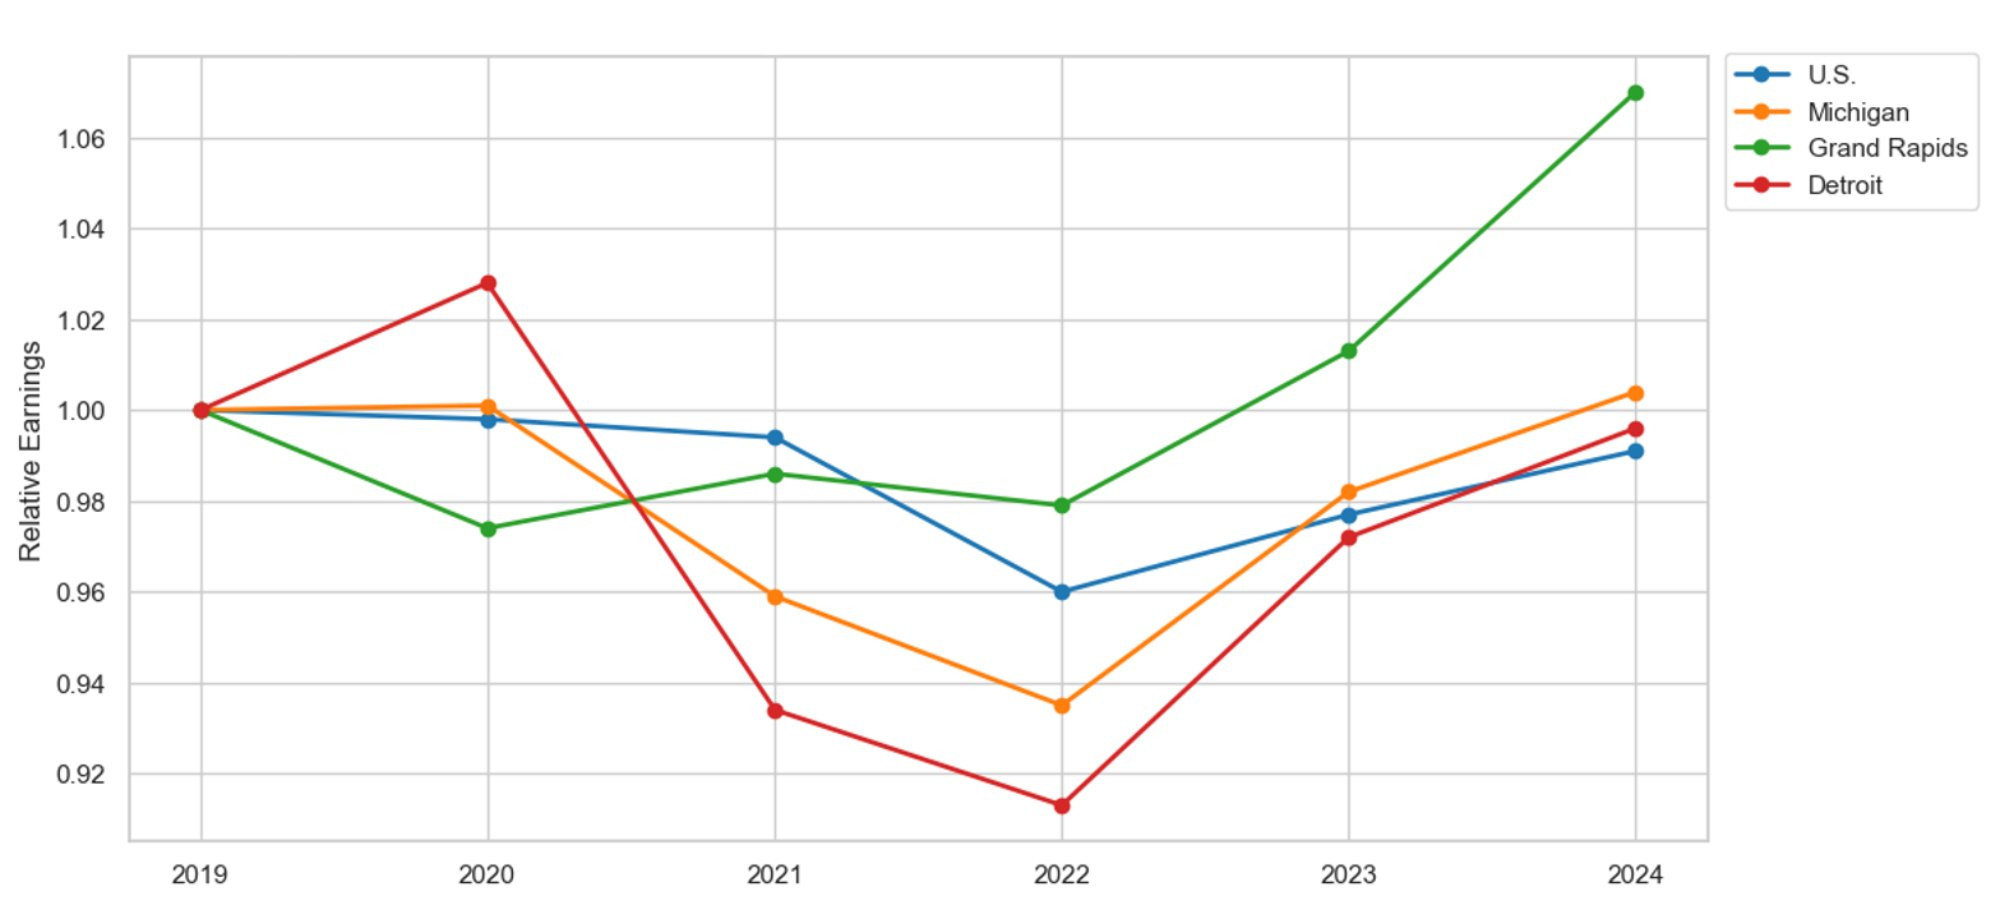
Figure 11 studies employment growth among healthcare practitioners and technical workers for the U.S., Michigan, Grand Rapids, and Detroit relative to the start of the COVID-19 pandemic in 2019. How has employment in healthcare occupations evolved since the onset of the pandemic? Have healthcare providers recovered since the beginning of the pandemic? Aggregate data on healthcare practitioners and technical workers suggest that Grand Rapids healthcare providers failed to experience hardship during the COVID-19 pandemic. For example, healthcare employment never decreased during the pandemic in West Michigan. Since the onset of the pandemic, healthcare employment in Grand Rapids has grown by 12.1 percent, compared to 10.6 percent nationally. Meanwhile, Detroit employment did not return to its pre-pandemic level until mid-2022, and by 2024, healthcare employment had only grown by 2 percent, well below the national average.
Figure 11: Healthcare Practitioner and Technical Occupation Employment Relative to 2019
Description: Figure 11 highlights the employment changes in healthcare practitioner and technical occupations in the U.S., Michigan, Grand Rapids, and Detroit since the start of the COVID-19 pandemic in 2019. Healthcare employment growth in Grand Rapids outpaced the national average, indicating an above-average recovery from the COVID-19 pandemic. Meanwhile, healthcare employment growth in Detroit lagged the national average, indicating a below-average recovery from the COVID-19 pandemic.
Source: U.S. Bureau of Labor Statistics, Michigan Department of Technology, Management, and Budget
Figure 12 tracks the inflation-adjusted earnings of healthcare practitioners and technical workers in the U.S., Michigan, Grand Rapids, and Detroit since the beginning of the pandemic. Contrary to Figure 8, the inflation-adjusted earnings of Grand Rapids-based healthcare workers consistently outpaced the national average during the pandemic. By 2024, the incomes of healthcare workers in Grand Rapids will have increased by 9.6 percent, compared to the national increase of 2.5 percent, making it easier for healthcare providers to attract and retain talent in West Michigan. In comparison, Detroit’s wages have lagged the national average, rising by only 0.1 percent during the same period. That stagnant wage may explain Detroit’s difficulty in finding and retaining healthcare personnel. While Grand Rapids appears to be recovering nicely from the pandemic, is that sentiment shared across healthcare occupations, or is it found only in the aggregate data?
Figure 12: Healthcare Practitioner and Technical Occupation Inflation-Adjusted Earnings Relative to 2019
Description: Figure 12 shows the change in inflation-adjusted earnings relative to 2019 for healthcare practitioner and technical occupations in the U.S., Michigan, Grand Rapids, and Detroit. Healthcare earnings in Grand Rapids outpaced the national average, indicating an above-average recovery from the COVID-19 pandemic. Meanwhile, earnings growth in Detroit did not keep pace with the national average, indicating a below-average recovery from the COVID-19 pandemic.
Source: U.S. Bureau of Labor Statistics, Michigan Department of Technology, Management, and Budget
Figure 13 reproduces Figure 9 using healthcare support employment since the start of the COVID-19 pandemic in 2019. Employment growth among healthcare support workers in Grand Rapids and Detroit has not kept pace with the national average. For example, employment in healthcare support occupations has increased by 14.2 percent nationally. In comparison, healthcare support employment has risen by only 2.4 percent in Detroit during the same period and fallen by 2.9 percent in Grand Rapids. By 2021, healthcare support employment had recovered to its pre-pandemic level in Detroit, highlighting a quick recovery. Meanwhile, employment among Grand Rapids-based healthcare support personnel has yet to return to pre-pandemic levels, highlighting a slow recovery.
Figure 13: Healthcare Support Occupation Employment Relative to 2019
Description: Figure 13 highlights the employment changes in support occupations in the U.S., Michigan, Grand Rapids, and Detroit since the start of the COVID-19 pandemic in 2019. Healthcare support employment growth in Grand Rapids and Detroit lagged the national average, indicating a below-average recovery from the COVID-19 pandemic.
Source: U.S. Bureau of Labor Statistics, Michigan Department of Technology, Management, and Budget
Figure 14 reproduces Figure 10 by studying the inflation-adjusted earnings of healthcare support personnel since the start of the pandemic in 2019. Again, Grand Rapids appears immune to the pandemic's effects, tracking the national average well. By 2024, healthcare support earnings increased by roughly 4.1 percent nationally, and in West Michigan. Meanwhile, Detroit appears to lag the national average, not recovering from the pandemic until late 2022. By 2024, healthcare support personnel observed a 2.4 percent increase in real wages in Detroit, well below the national average. Taken together, Figures 13 and 14 highlight several significant findings about healthcare support workers. First, the increase in inflation-adjusted earnings is not leading to more healthcare support personnel in Grand Rapids. Second, Detroit’s low real wage growth may explain the stagnant nature of healthcare support employment since the onset of the pandemic.
Figure 14: Healthcare Support Occupation Inflation-Adjusted Earnings Relative to 2019
Description: Figure 14 shows the change in inflation-adjusted earnings relative to 2019 for healthcare practitioner and technical occupations in the U.S., Michigan, Grand Rapids, and Detroit. Healthcare earnings growth in Grand Rapids and Detroit did not keep pace with the national average, indicating a below-average recovery from the COVID-19 pandemic.
Source: U.S. Bureau of Labor Statistics, Michigan Department of Technology, Management, and Budget
West Michigan stands out nationally in terms of employment growth and changes to inflation-adjusted earnings. However, it is essential to note that not all occupations follow the industry average. Growth in some professions may be considerably higher or lower than the industry average. As a result, we disaggregate the data and turn our analysis to study the labor markets of different healthcare professions.
Healthcare Occupations
We avoid a lengthy discussion by focusing on the top 10 healthcare professions with the highest rates of employee turnover in West Michigan. For each profession, we present a sequence of four graphs: occupational replacements resulting from labor market exits and retirements; new job growth rates; and inflation-adjusted earnings relative to the onset of the Great Recession and the COVID-19 pandemic across all four geographical samples. We begin with one of West Michigan's most pressing healthcare professions, registered nurses (RNs).
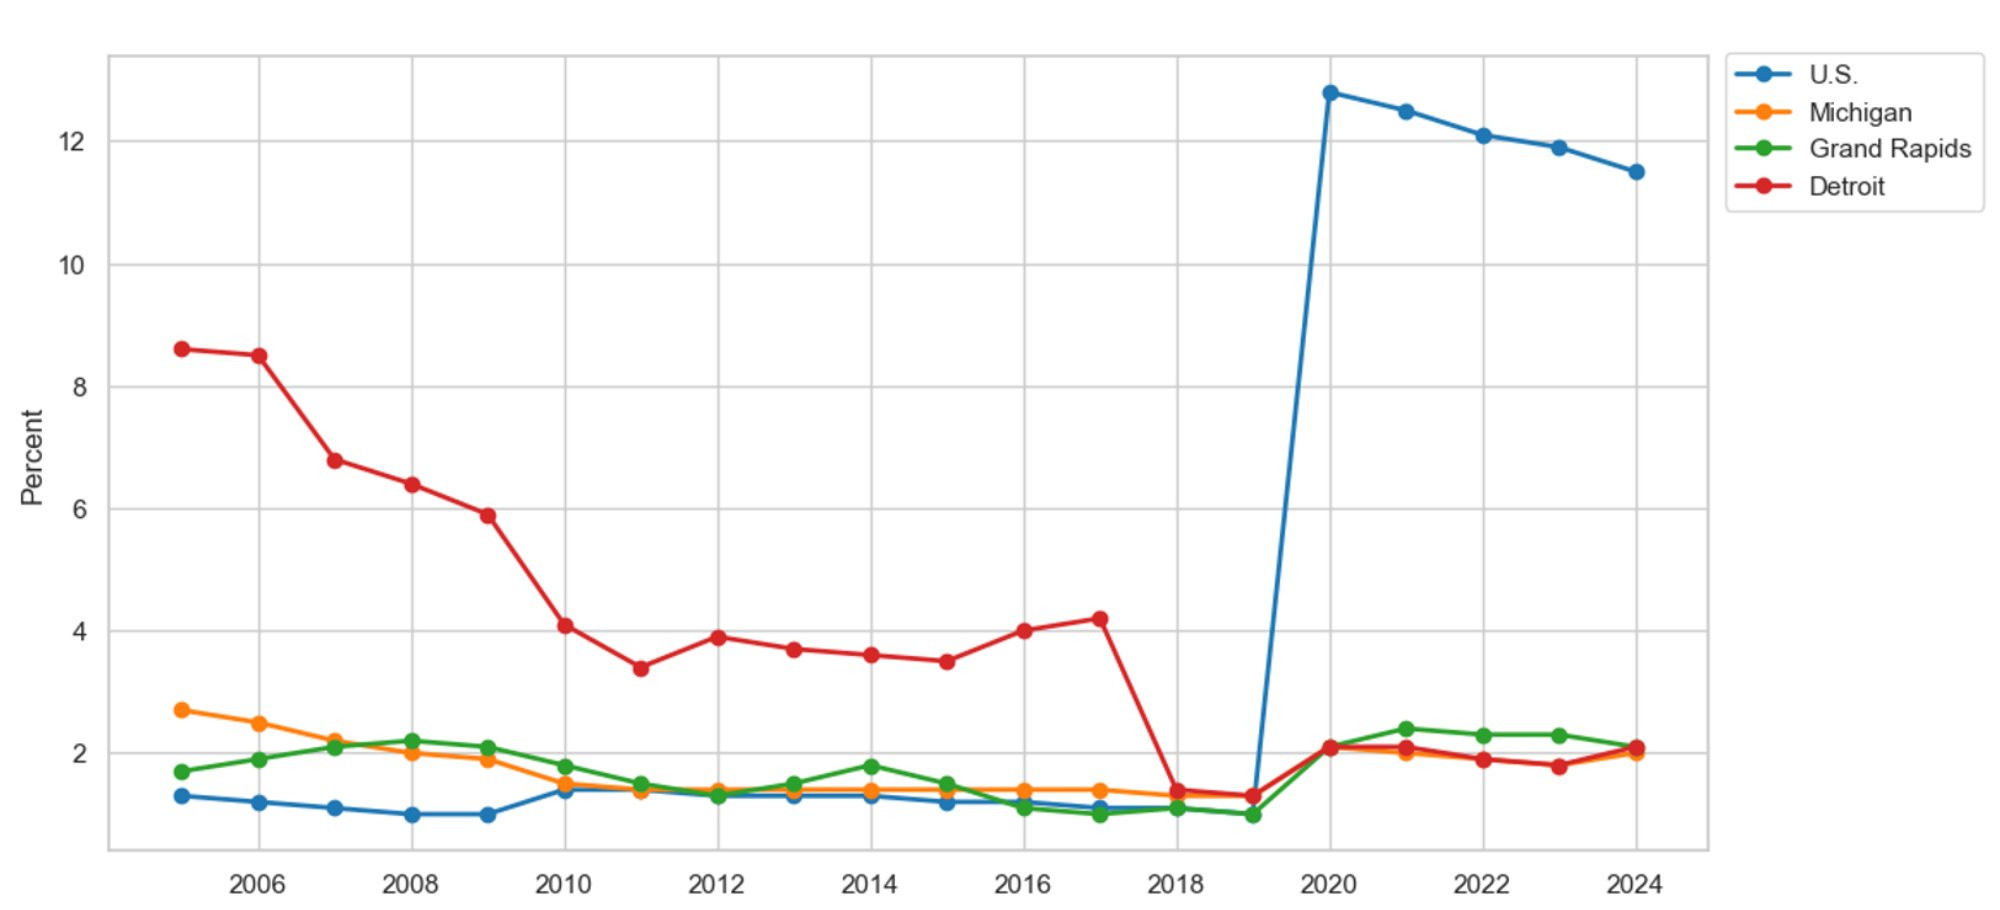
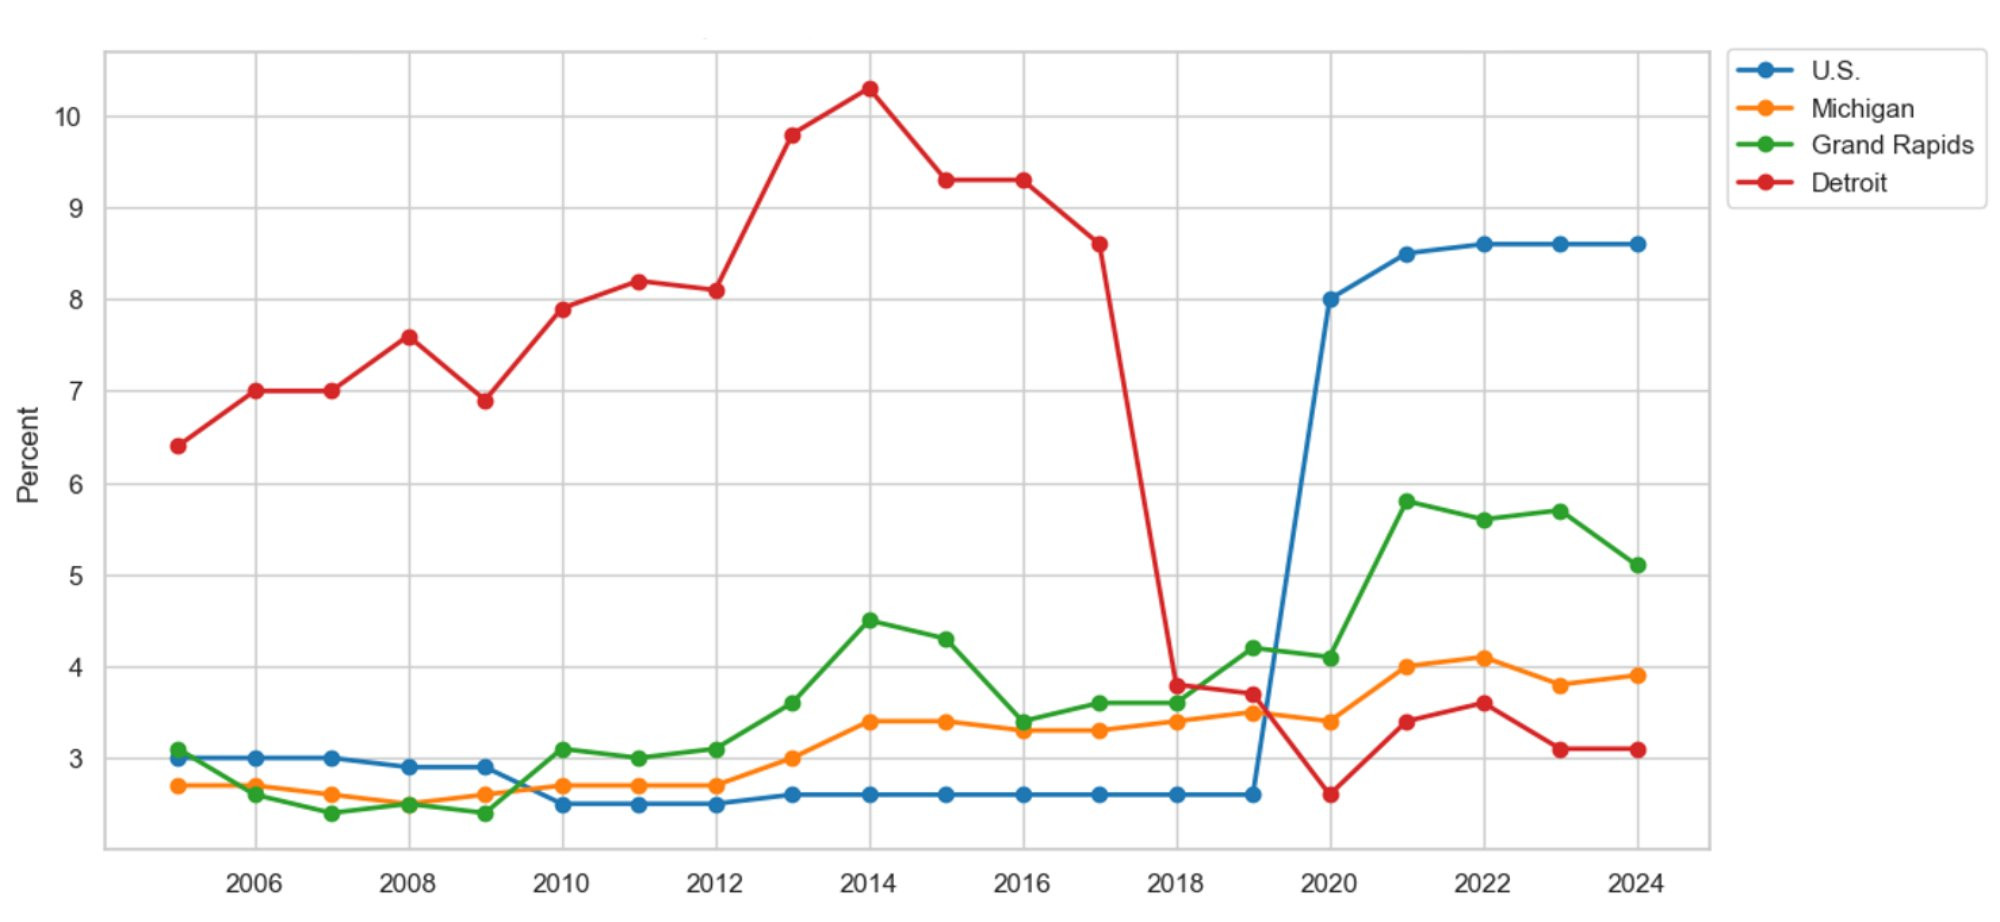
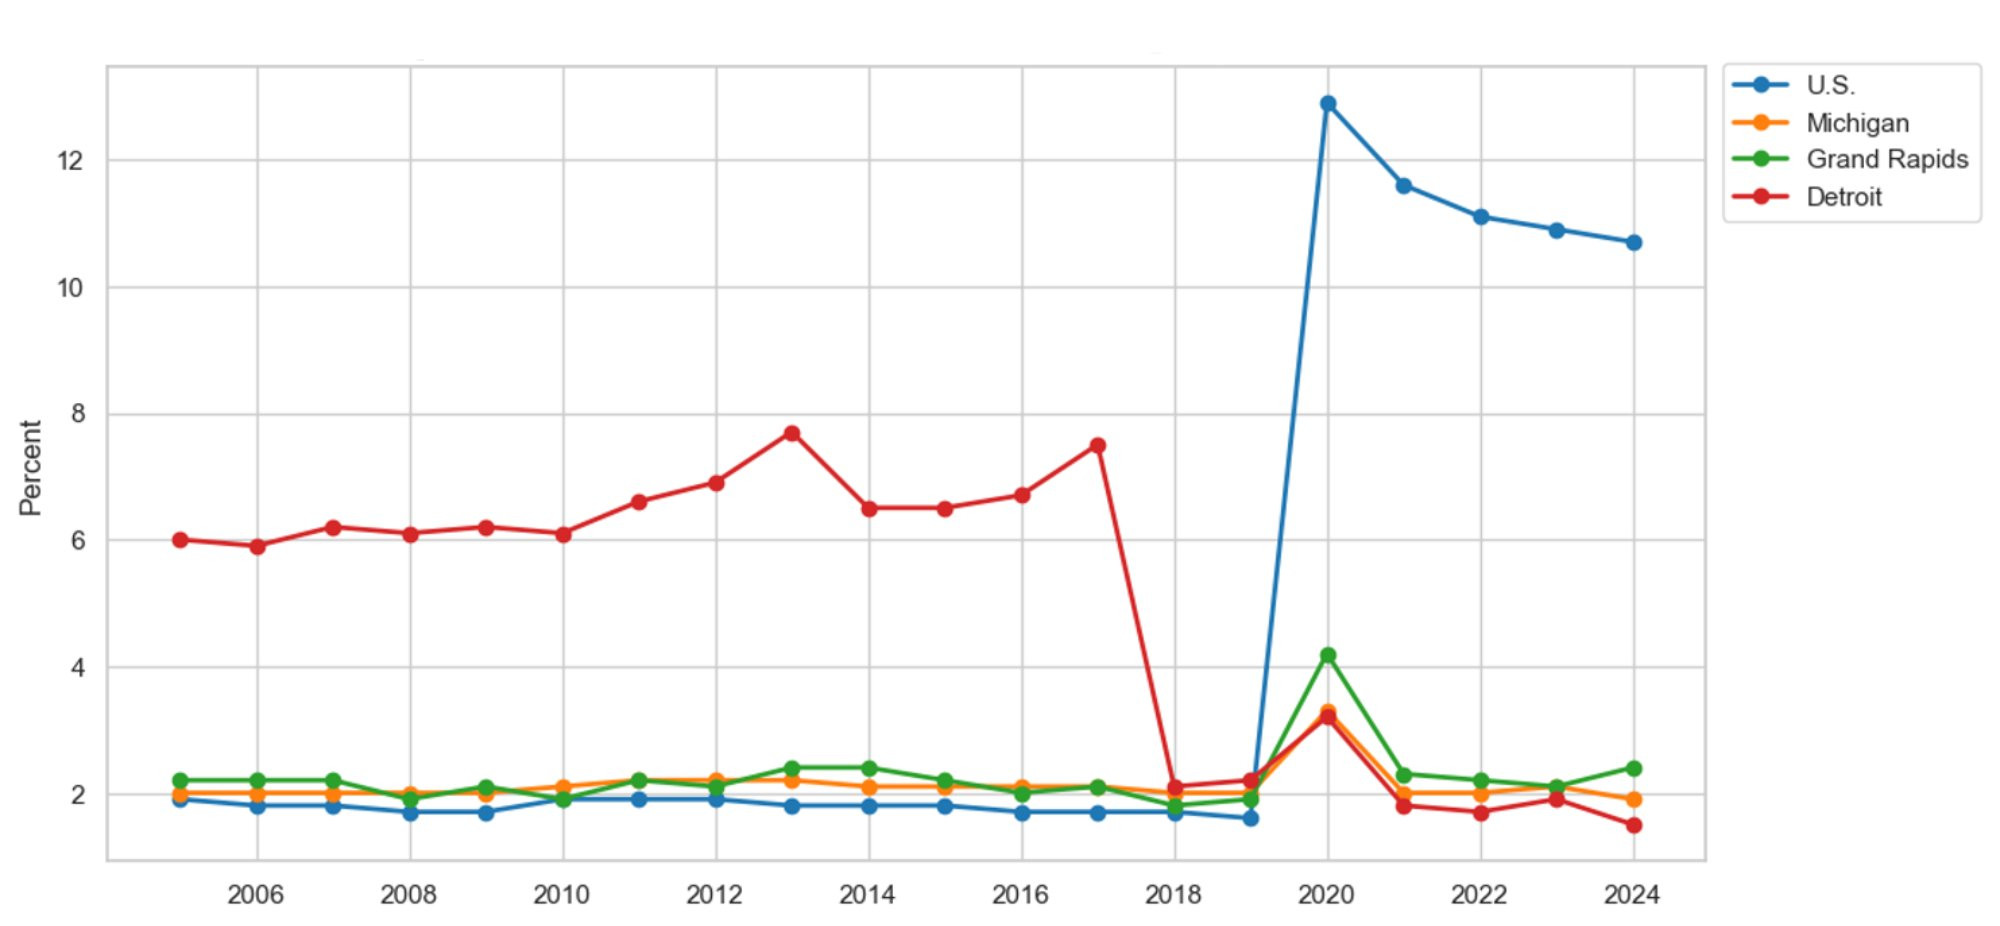
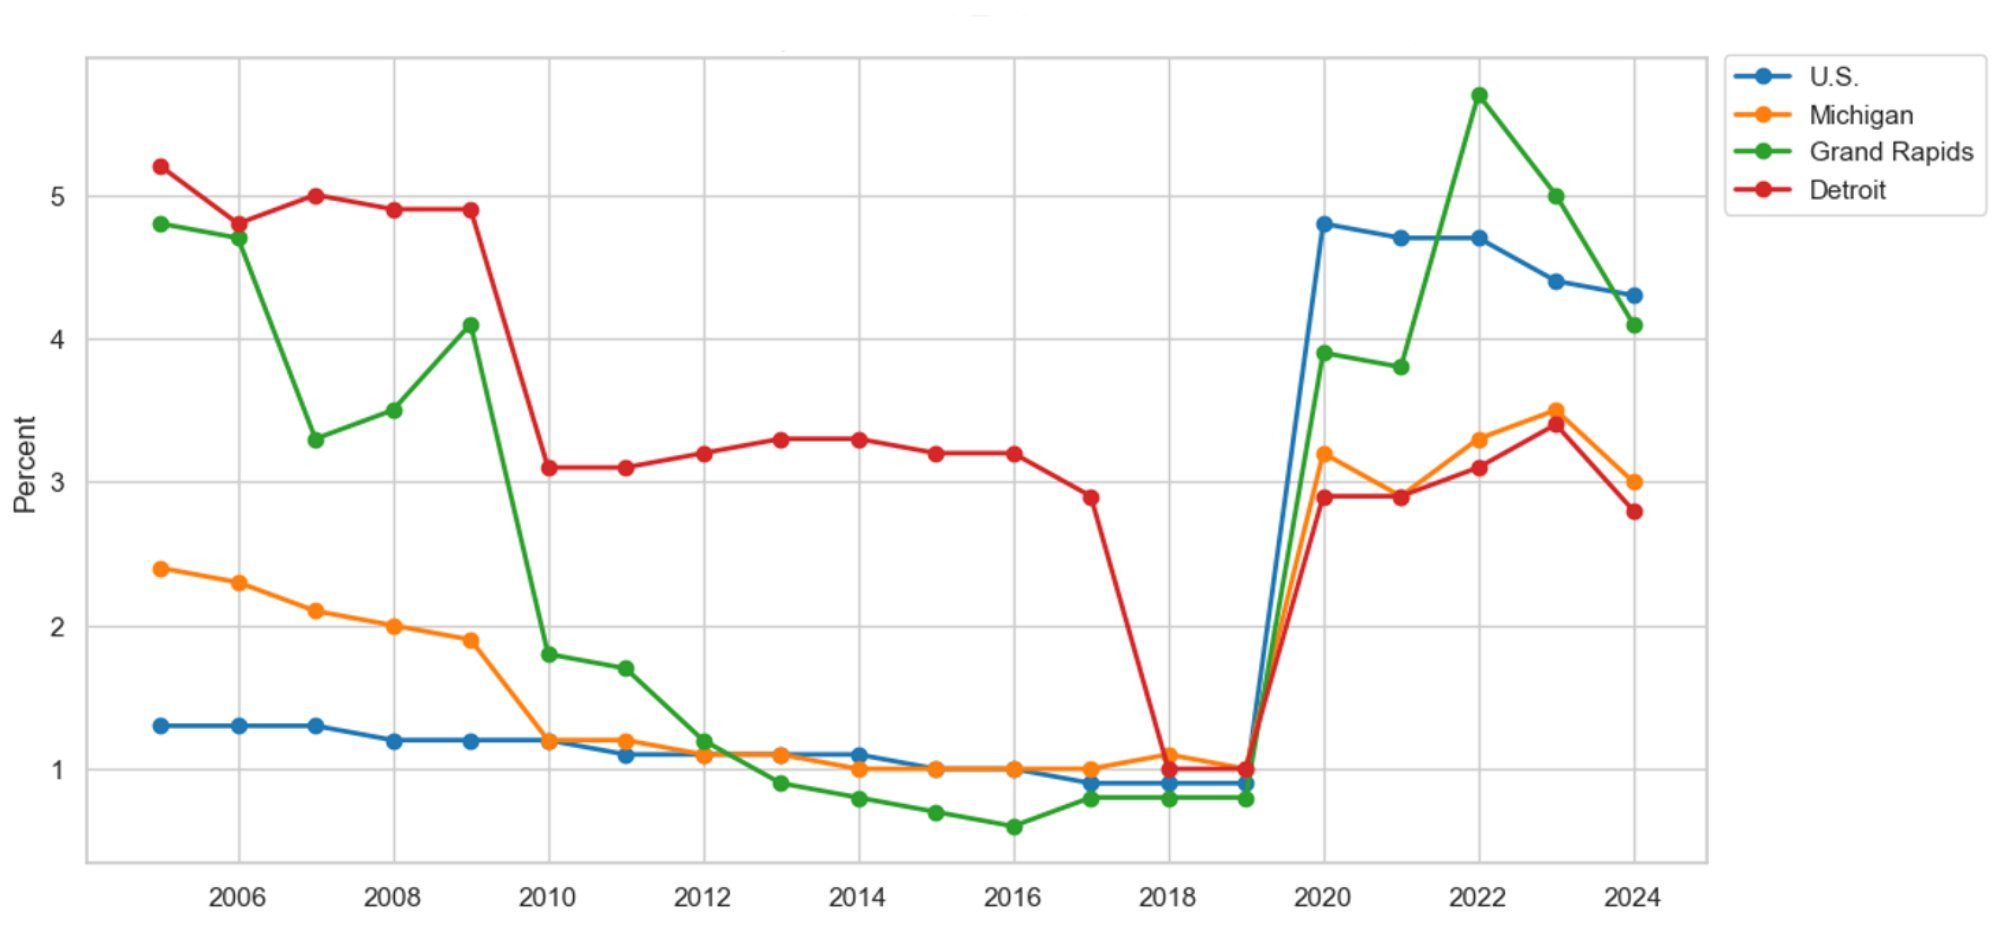
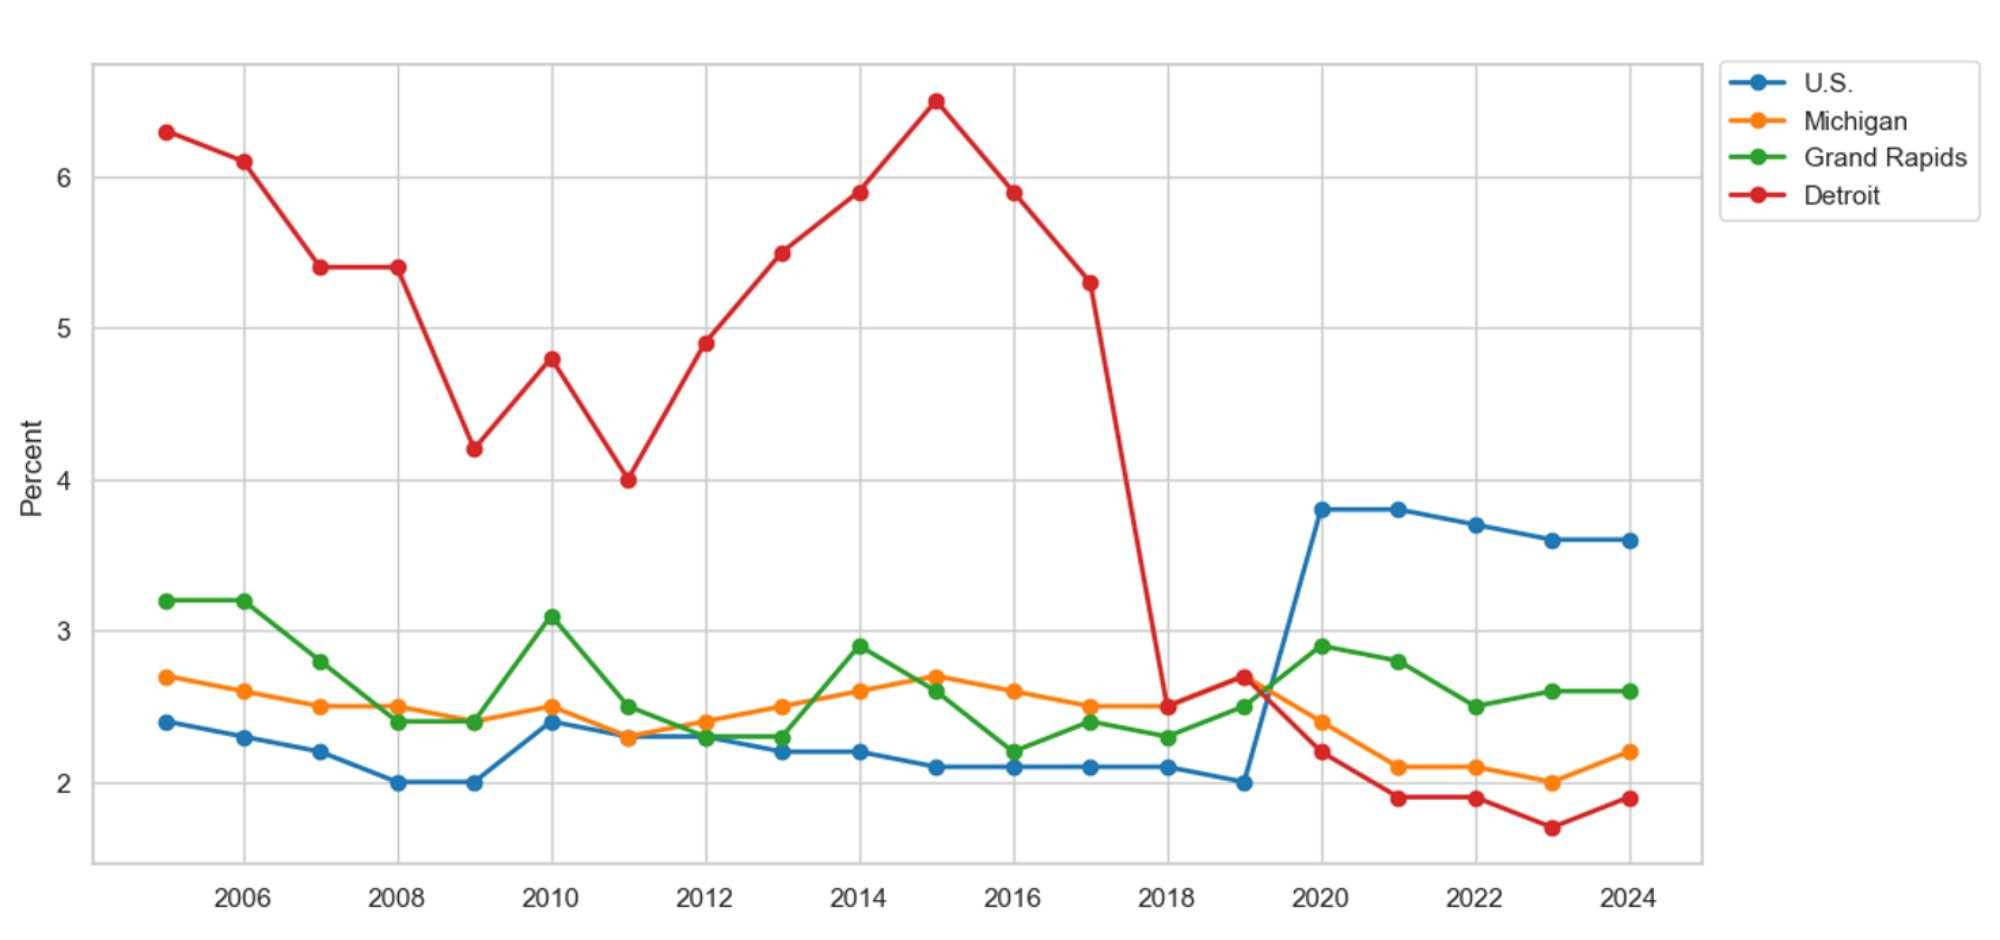
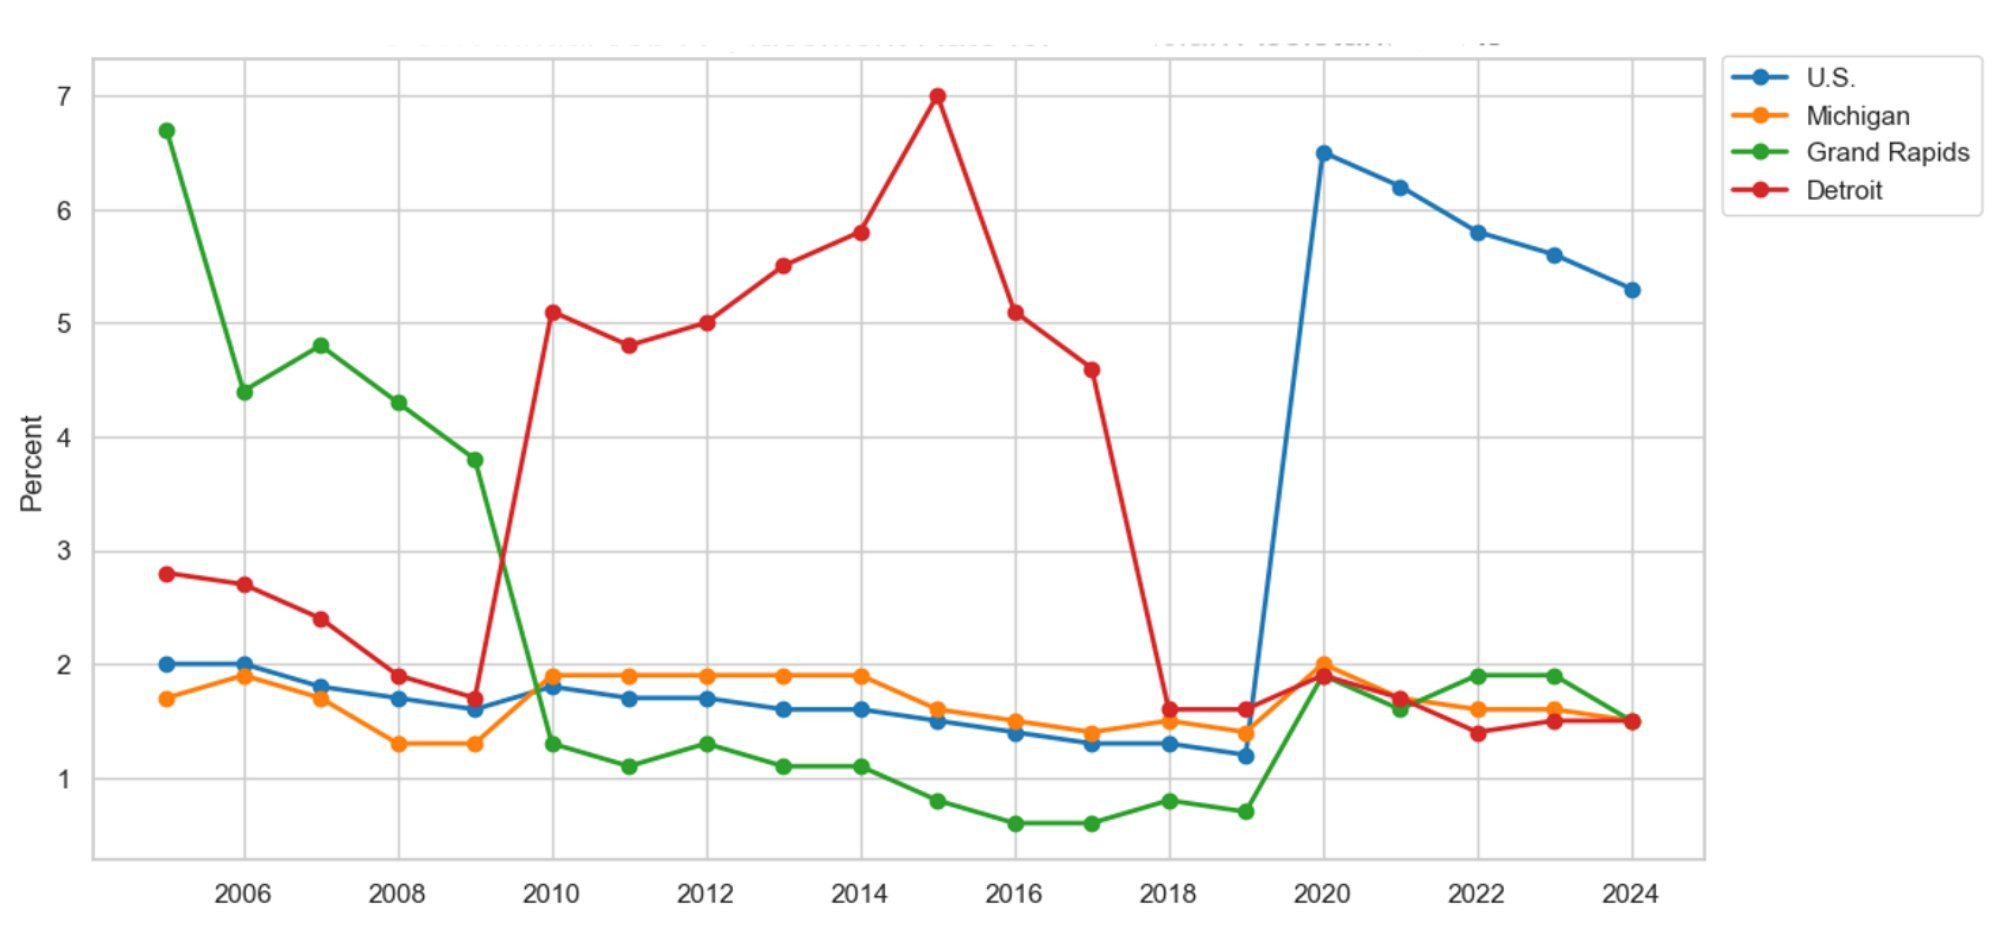
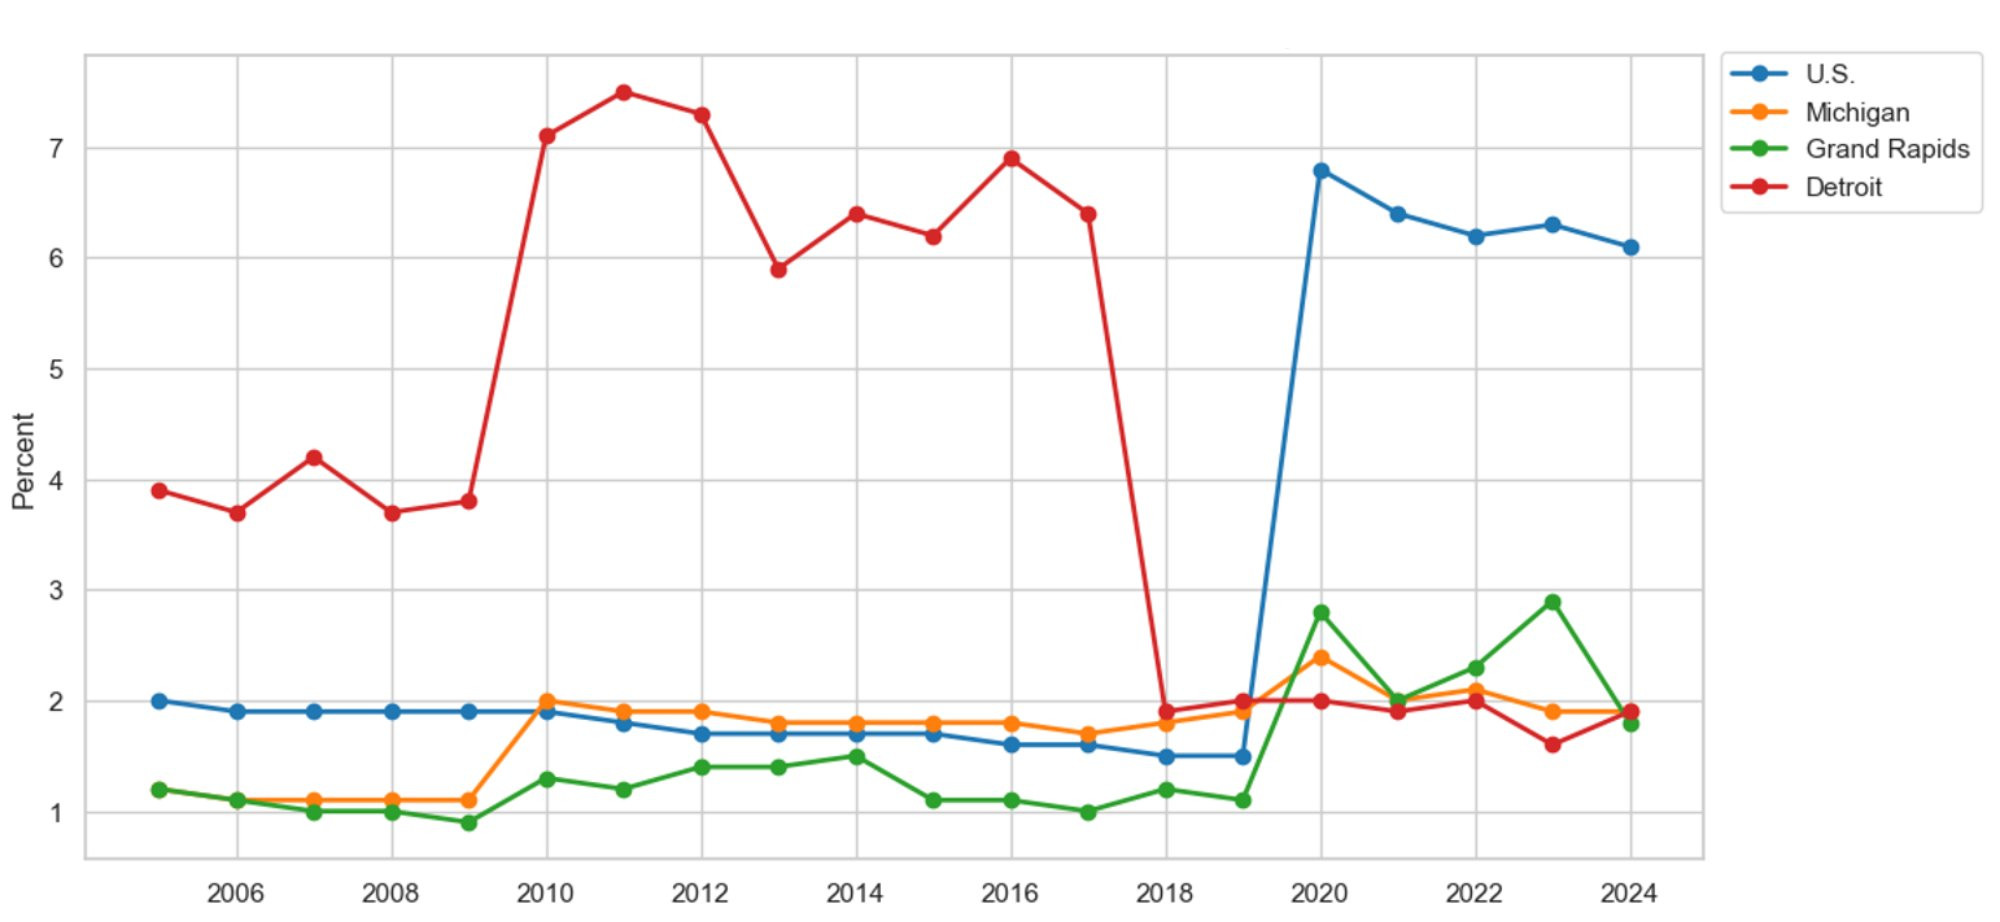
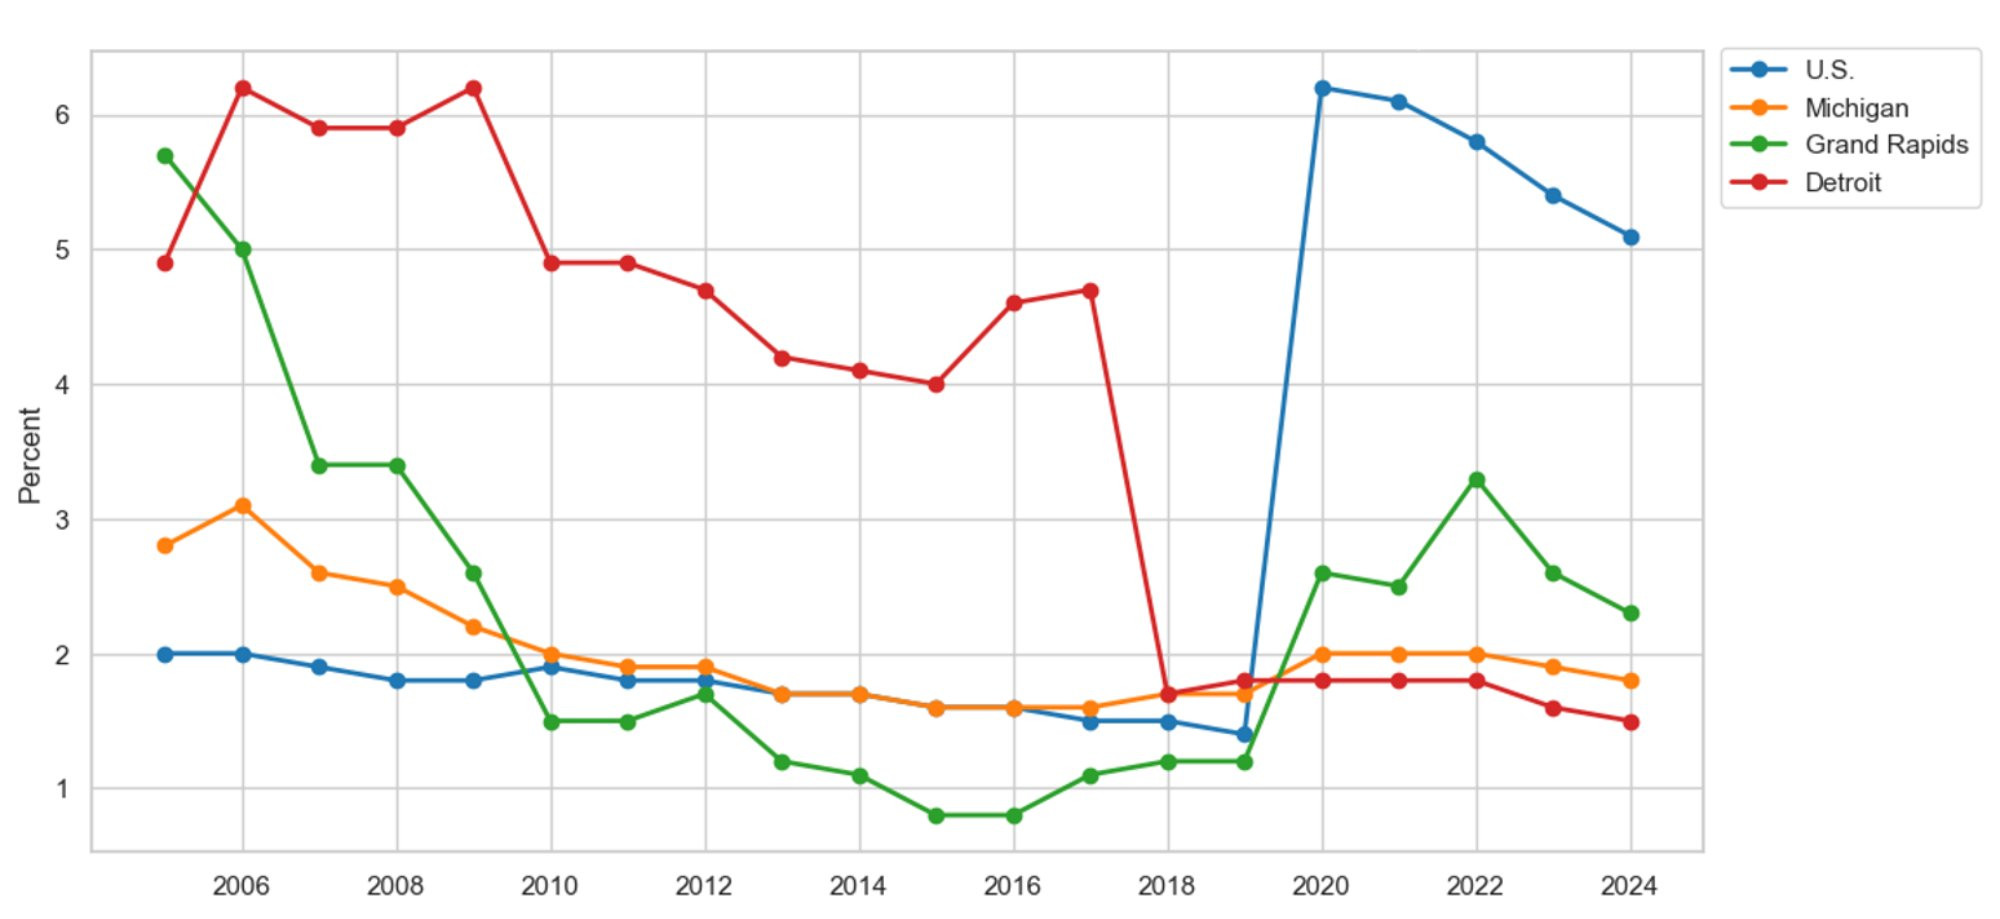
Figure 15 presents the annual job replacement rates for registered nurses (RNs) in the U.S., Michigan, Grand Rapids, and Detroit since the onset of the Great Recession in 2005. Replacements include persons exiting an occupation and not returning, including those seeking retirement. The number of replacements is then divided by total employment within that occupation to derive the replacement rate. We study workforce replacement to analyze the size of the workforce exiting an occupation, which is particularly important during the COVID-19 pandemic, when burnout plagued many healthcare occupations, including RNs. For example, since the onset of the COVID-19 pandemic in 2020, the national replacement rate has been twice as high as the rates observed in Grand Rapids and Detroit. In 2024, the average healthcare provider lost 5.1 percent of its RNs to occupational exits and retirements. However, the replacement rate in Grand Rapids and Detroit was only 2.4 and 2.1 percent, respectively. In other words, Grand Rapids and Detroit lost fewer workers than the average U.S. healthcare provider. If replacements serve as a proxy for the RN shortage, then the RN scarcity observed in Grand Rapids and Detroit is less severe than the national average. While RN shortages exist in Grand Rapids and Detroit, they also exist nationwide. The RN shortage is not a Michigan phenomenon; it is a national problem.
Figure 15: Annual Job Replacement Rate for Nurses, RNs
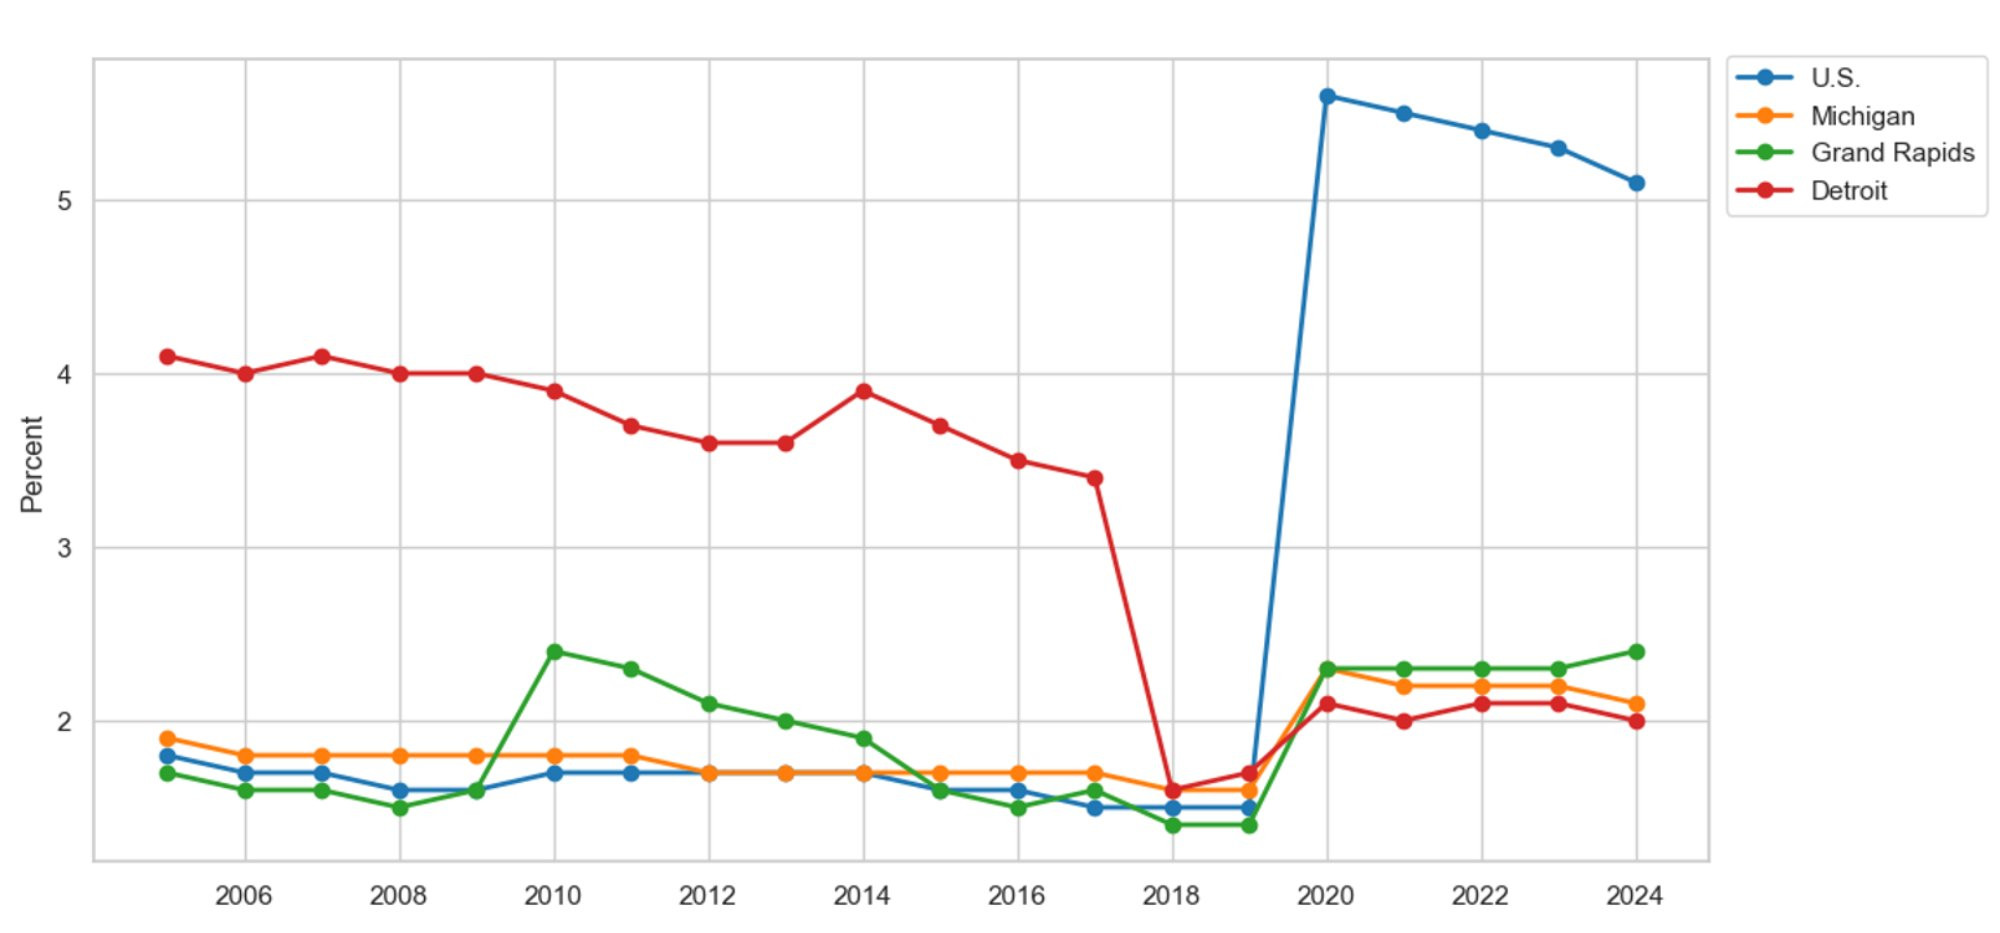
Description: Figure 15 shows the yearly replacement rate of registered nurses (RNs) due to occupational exits and retirements for the U.S., Michigan, Grand Rapids, and Detroit since 2005. The data reveal that during the Great Recession, which began in 2007, annual RN replacements from exits and retirements were higher than the national average in Grand Rapids and Detroit. Meanwhile, during the COVID-19 pandemic, RN replacements in Grand Rapids and Detroit did not keep pace with the national average. If annual replacements are used as an indicator of the RN shortage, the shortages in Grand Rapids and Detroit appear to be significantly lower than the national average.
Source: U.S. Bureau of Labor Statistics, Michigan Department of Technology, Management, and Budget
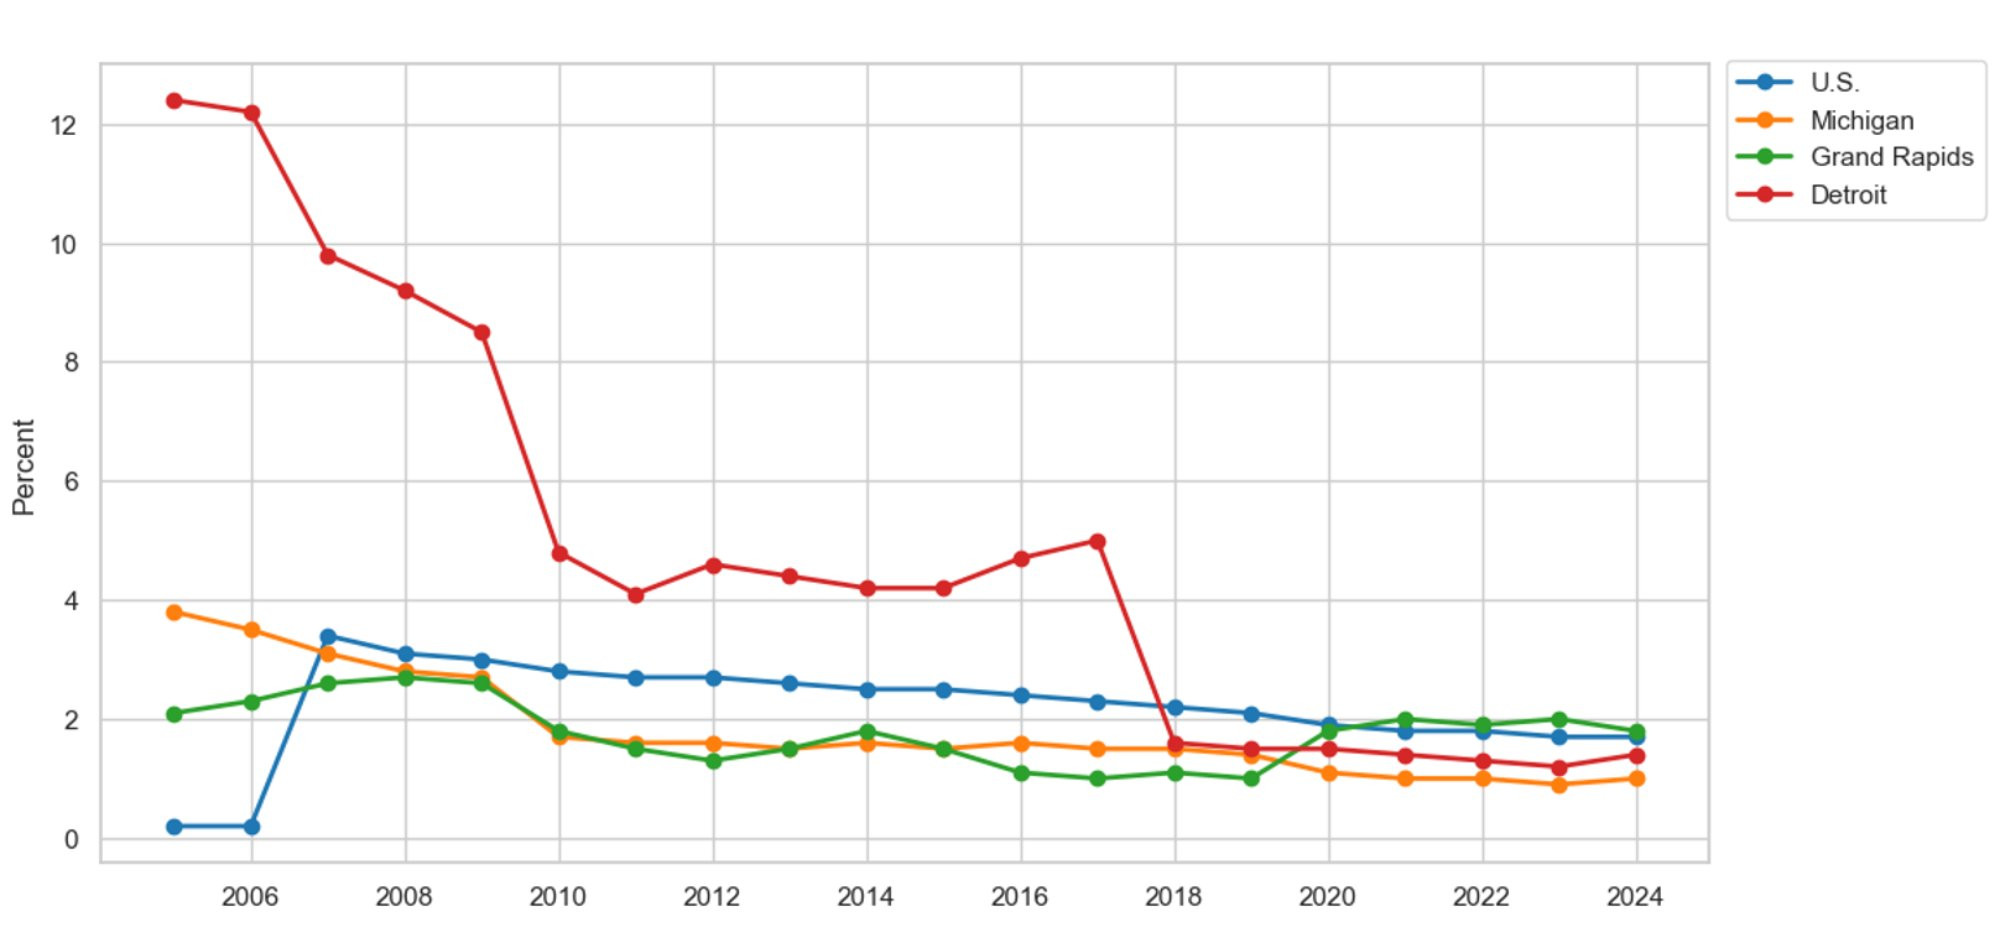
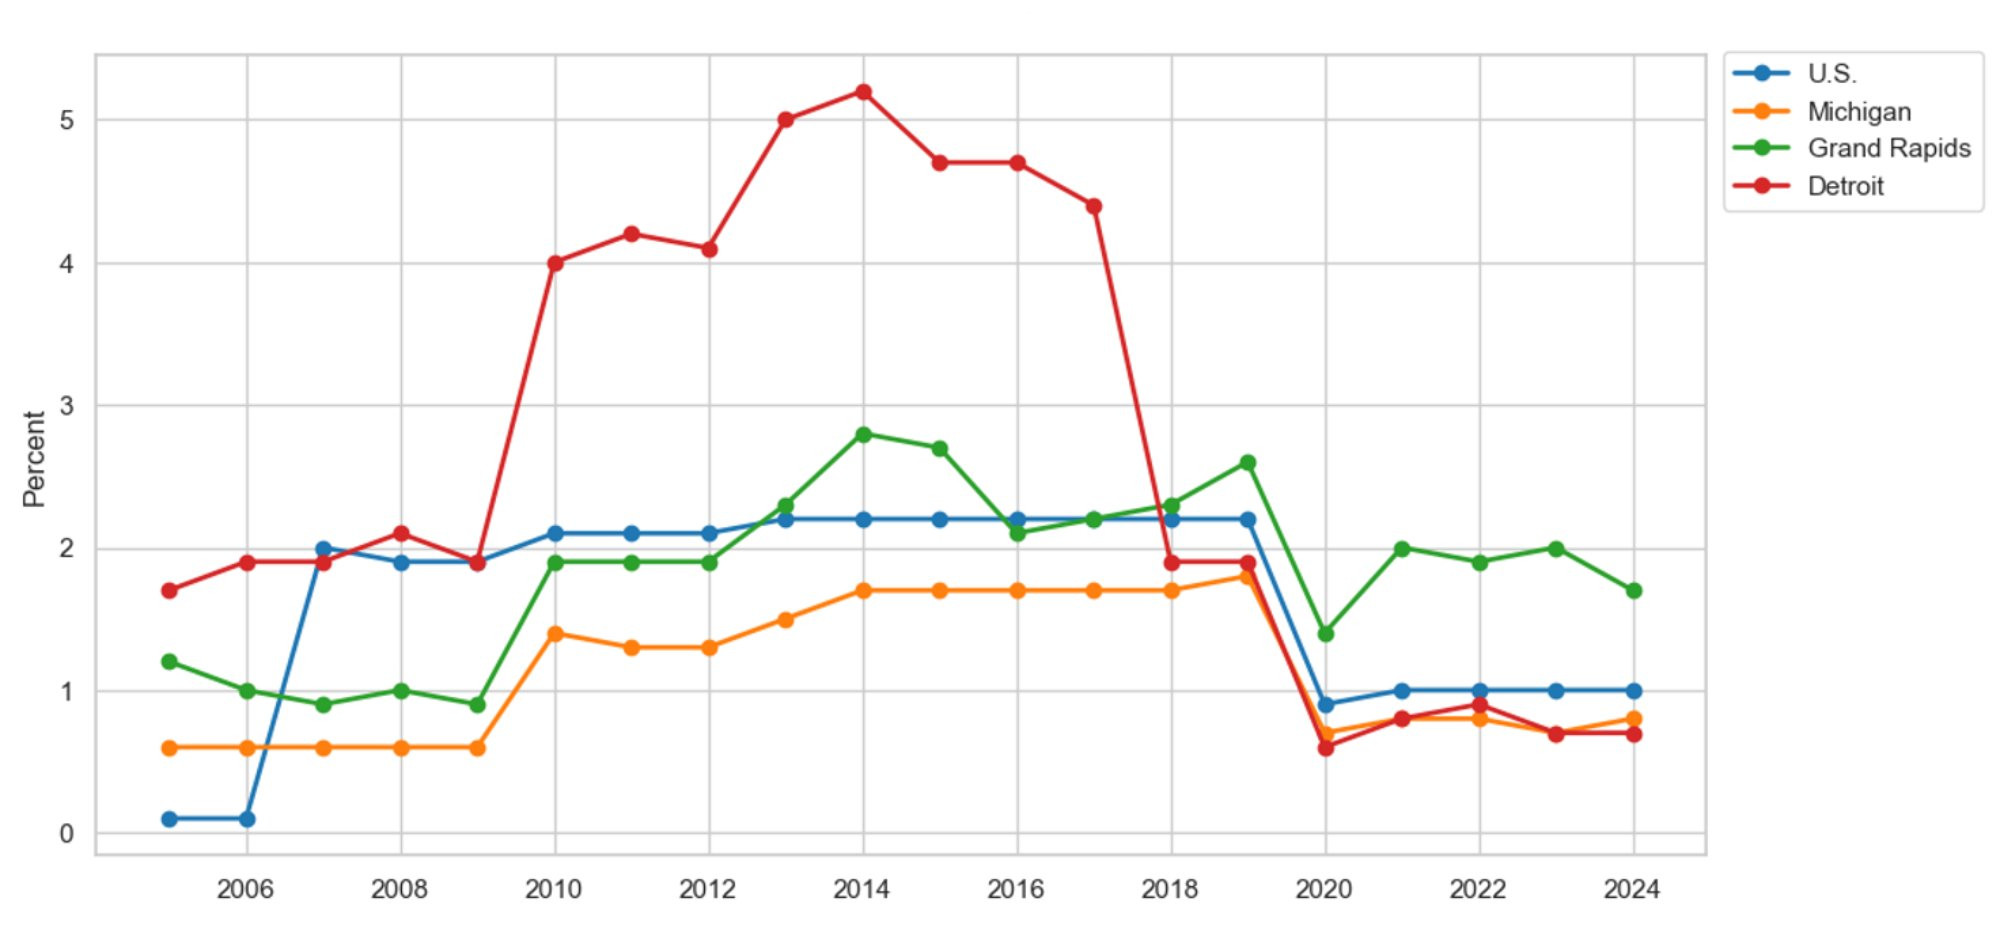
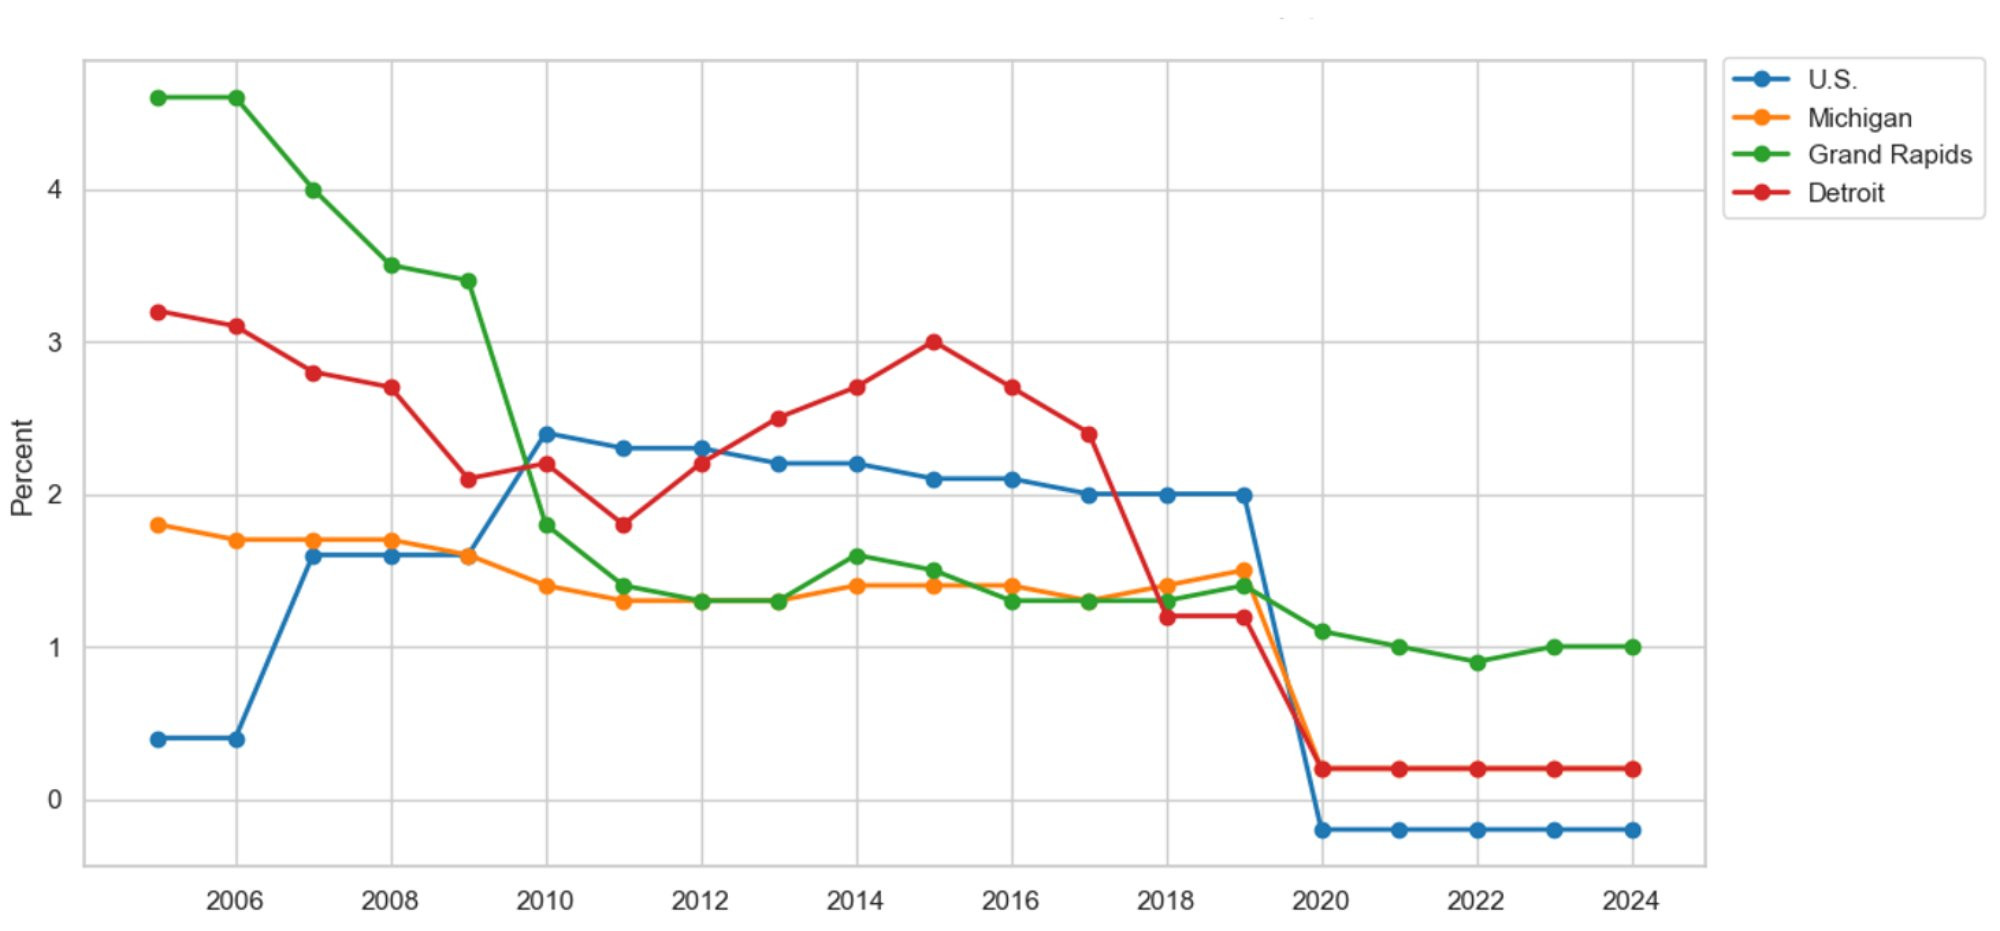
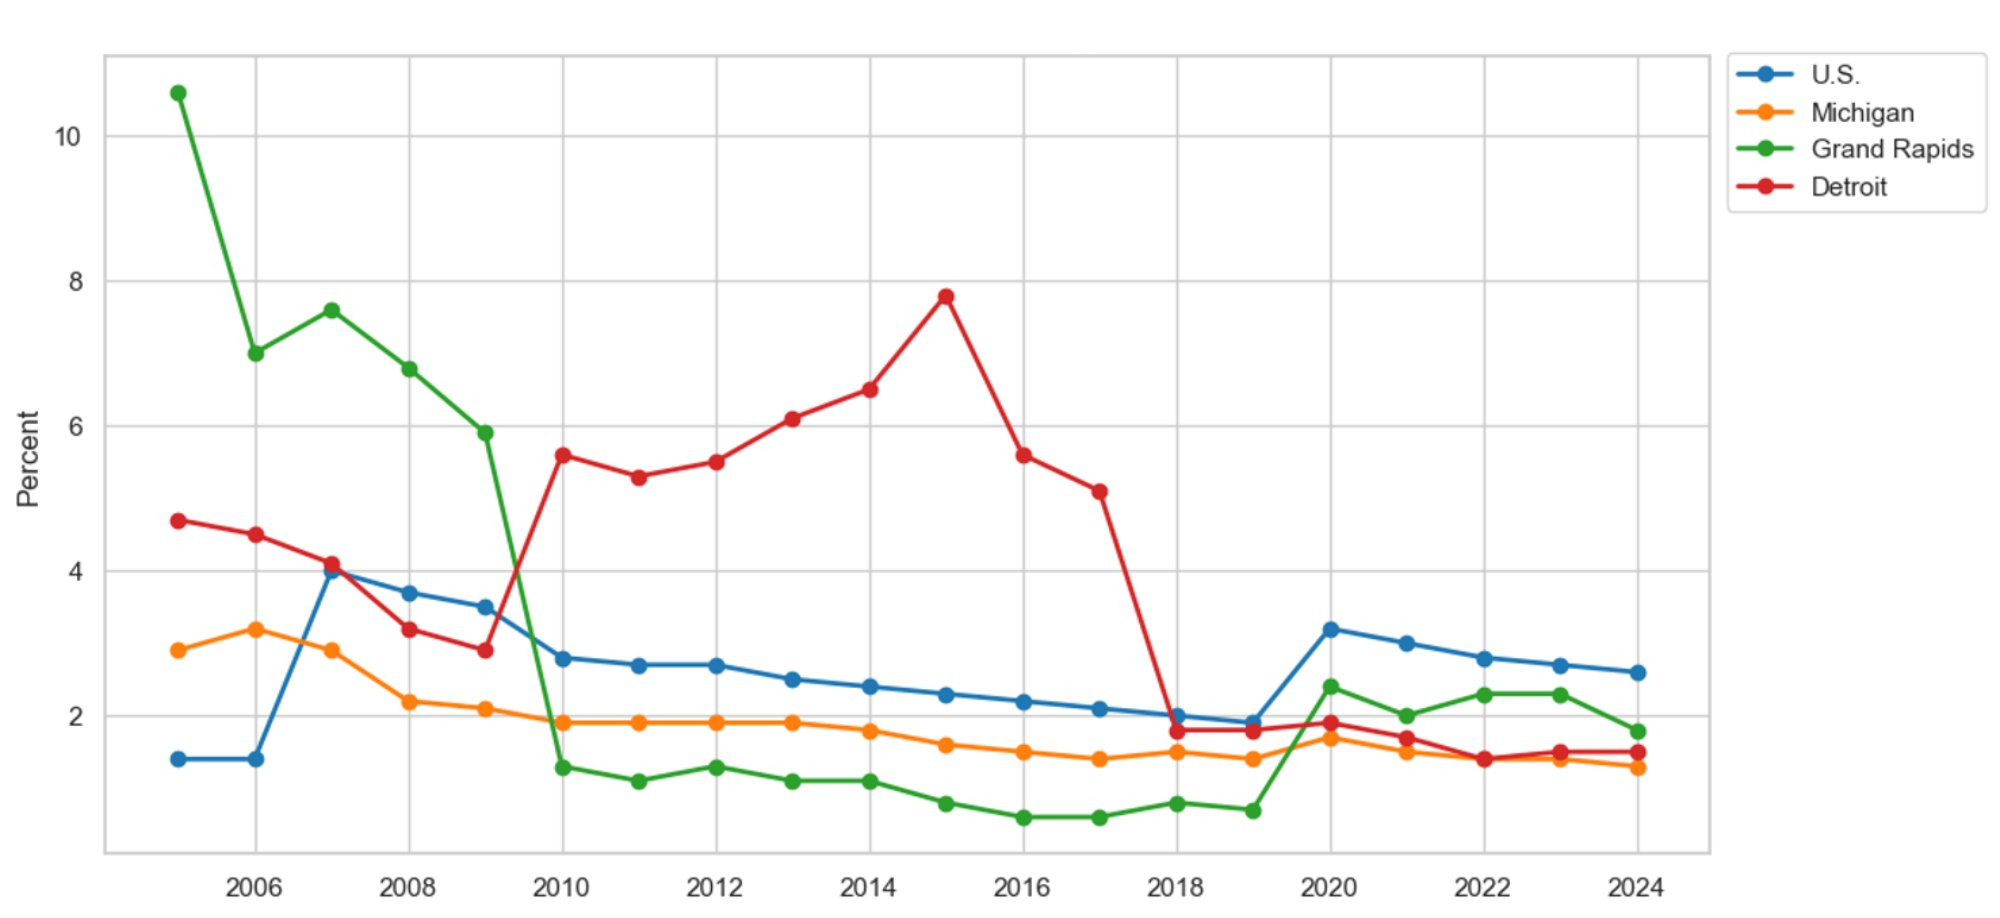
Figure 16 depicts the new job growth rates for RNs in the U.S., Michigan, Grand Rapids, and Detroit, from the onset of the Great Recession in 2005. Again, we focus on the pandemic, beginning in 2019, to say something about the RN shortage observed during the pandemic. The new job growth rate is derived by dividing new openings by total employment within an occupation. Since the onset of the COVID-19 pandemic, RN job growth in Grand Rapids and Detroit has exceeded the national average. For example, in 2024, Grand Rapids added 2.4 percent more RNs to its payroll, well above the national average of 0.8 percent and the 1 percent increase in Detroit. If new RN job openings proxy for the RN shortage, then the RN shortage observed in Grand Rapids fares far better than the average U.S. healthcare provider.
Figure 16: Annual New Job Growth for Nurses, RNs
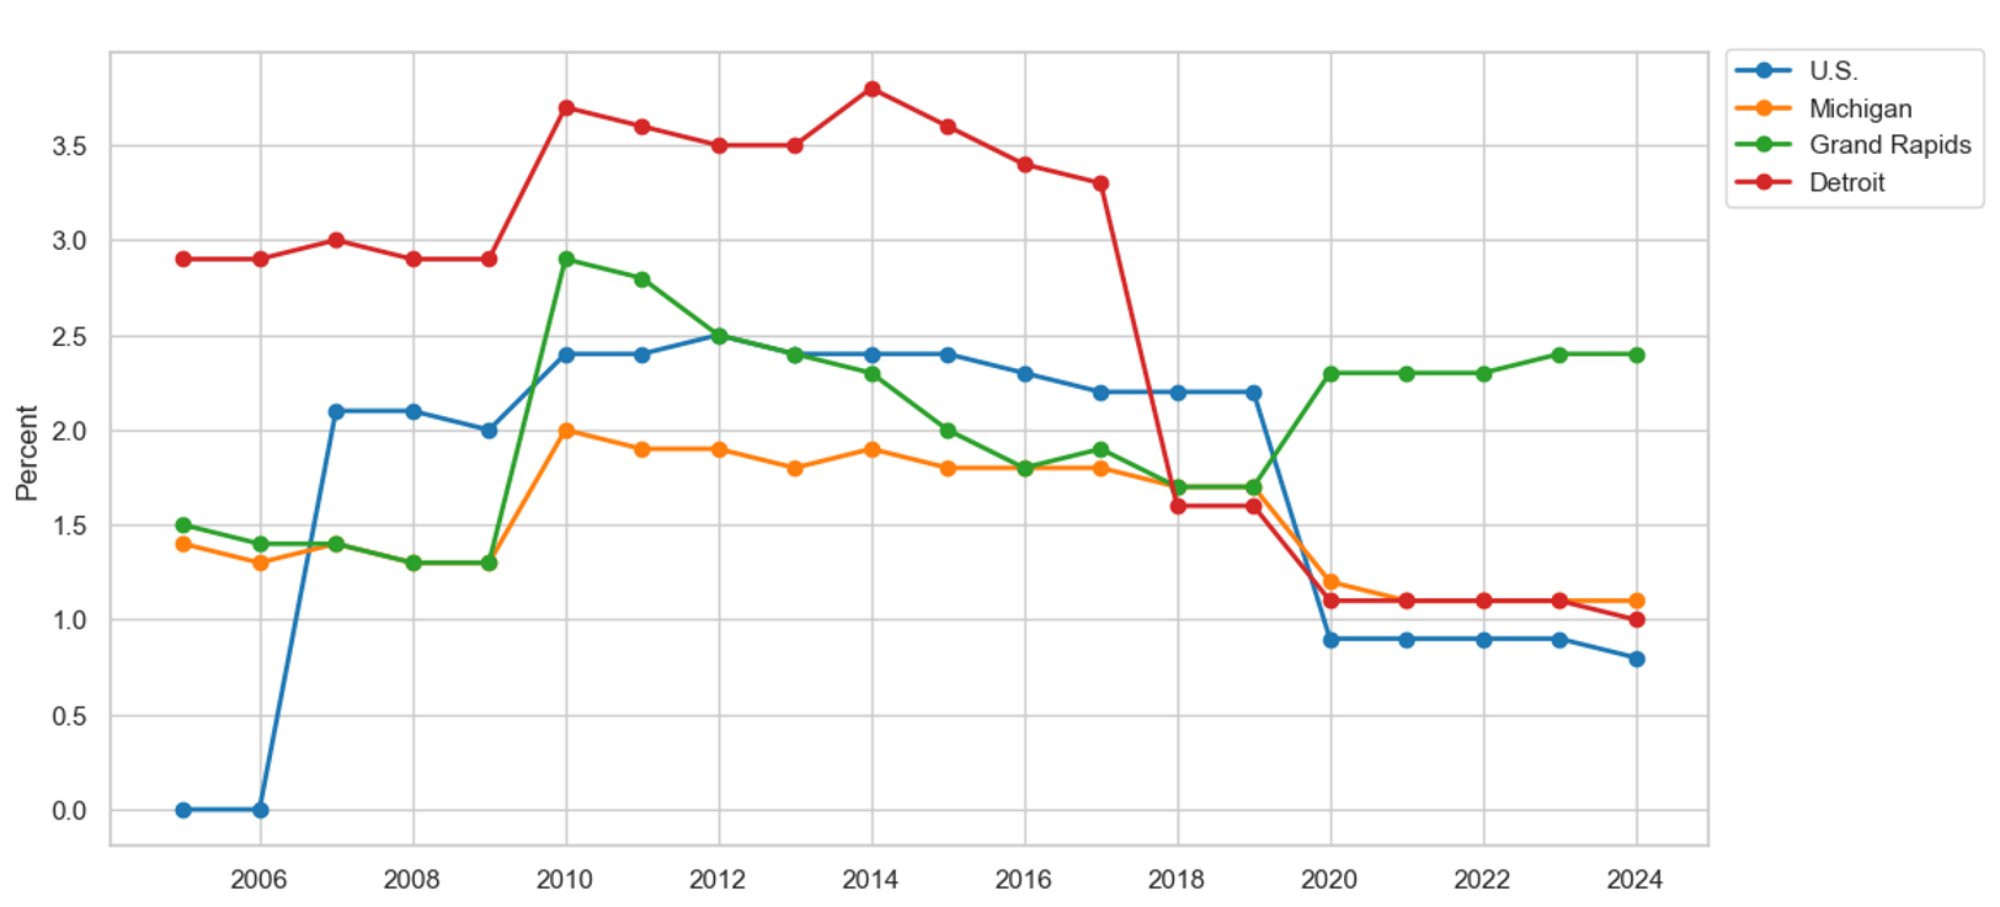
Description: Figure 16 shows the yearly new job growth rate of registered nurses (RNs) for the U.S., Michigan, Grand Rapids, and Detroit since 2005. The data reveal that during the Great Recession, which began in 2007, annual new job growth for RNs was higher than the national average in Detroit but lower in Grand Rapids. Meanwhile, during the COVID-19 pandemic, RN job growth in Grand Rapids and Detroit outpaced the national average. If new job growth is used as an indicator for RN shortages, the shortages in Grand Rapids and Detroit appear to be smaller than the national average.
Source: U.S. Bureau of Labor Statistics, Michigan Department of Technology, Management, and Budget
The current nursing shortage is not a local problem; it is a national issue. Additionally, current research indicates that the nursing shortage in Michigan is less severe than the national average (Burger, 2025; Robinson, 2025). A shortage need not imply a bad thing. Let’s rewrite the narrative and think about how a labor shortage forms in a marketplace. When healthcare demand rises, higher hospital utilization forces healthcare providers to turn to the labor market, thereby increasing labor demand. At the prevailing wage, an increase in labor demand creates a labor market shortage because nominal wages are sticky and readjust once a year. However, the shortage forms from increased utilization, which raises the profits of healthcare providers; an excellent thing for hospital personnel. So, how can healthcare providers alleviate the shortage? What do healthcare providers control in the labor market? The prevailing wage rate. A shortage forms because wages do not adjust upward fast enough or high enough. That is, if an RN shortage persists, it’s because inflation-adjusted earnings have not increased enough to attract new labor or retain existing employment. This is a common theme present in this section.
Figures 17 and 18 present the inflation-adjusted earnings of RNs in the U.S., Michigan, Grand Rapids, and Detroit relative to the start of the Great Recession in 2005 and the COVID-19 pandemic in 2019. Both figures suggest that the inflation-adjusted earnings of RNs in Grand Rapids and Detroit have not kept pace with the national average. If the national average sets earnings expectations, then Grand Rapids and Detroit have fallen short of expectations. For example, since the onset of the Great Recession, the inflation-adjusted earnings of RN have increased by 7.7 percent nationally. However, real wages for RNs in Grand Rapids increased by only 2.4 percent, while they decreased by 2.3 percent in Detroit during the same period. Meanwhile, since the beginning of the pandemic, the inflation-adjusted earnings of RNs have increased by 3.6 percent nationally. However, during the same period, real RN wage growth has only increased by 2.4 percent in Grand Rapids and decreased by 0.4 percent in Detroit. It is tough to attract and retain talent if earnings expectations are not met.
Figure 17: Relative Inflation-Adjusted Earnings for Nurses, RNs Since 2005
Description: Figure 17 illustrates relative inflation-adjusted earnings among registered nurses (RNs) for the U.S., Michigan, Grand Rapids, and Detroit since the start of the Great Recession in 2005. Inflation-adjusted earnings in Grand Rapids and Detroit lagged the national average during the Great Recession, indicating a below-average recovery in RN earnings. If the national average sets labor-market earnings expectations, then healthcare providers in Grand Rapids and Detroit would have found it hard to attract and retain RNs under their pay schemes.
Source: U.S. Bureau of Labor Statistics, Michigan Department of Technology, Management, and Budget
Figure 18: Relative Inflation-Adjusted Earnings for Nurses, RNs Since 2019
Description: Figure 18 illustrates relative inflation-adjusted earnings among registered nurses (RNs) for the U.S., Michigan, Grand Rapids, and Detroit since the start of the COVID-19 pandemic in 2019. Inflation-adjusted earnings in Grand Rapids and Detroit lagged the national average during the pandemic, indicating a below-average recovery in RN earnings. If the national average sets labor-market earnings expectations, then healthcare providers in Grand Rapids and Detroit would have found it hard to attract and retain RNs under their pay schemes.
Source: U.S. Bureau of Labor Statistics, Michigan Department of Technology, Management, and Budget
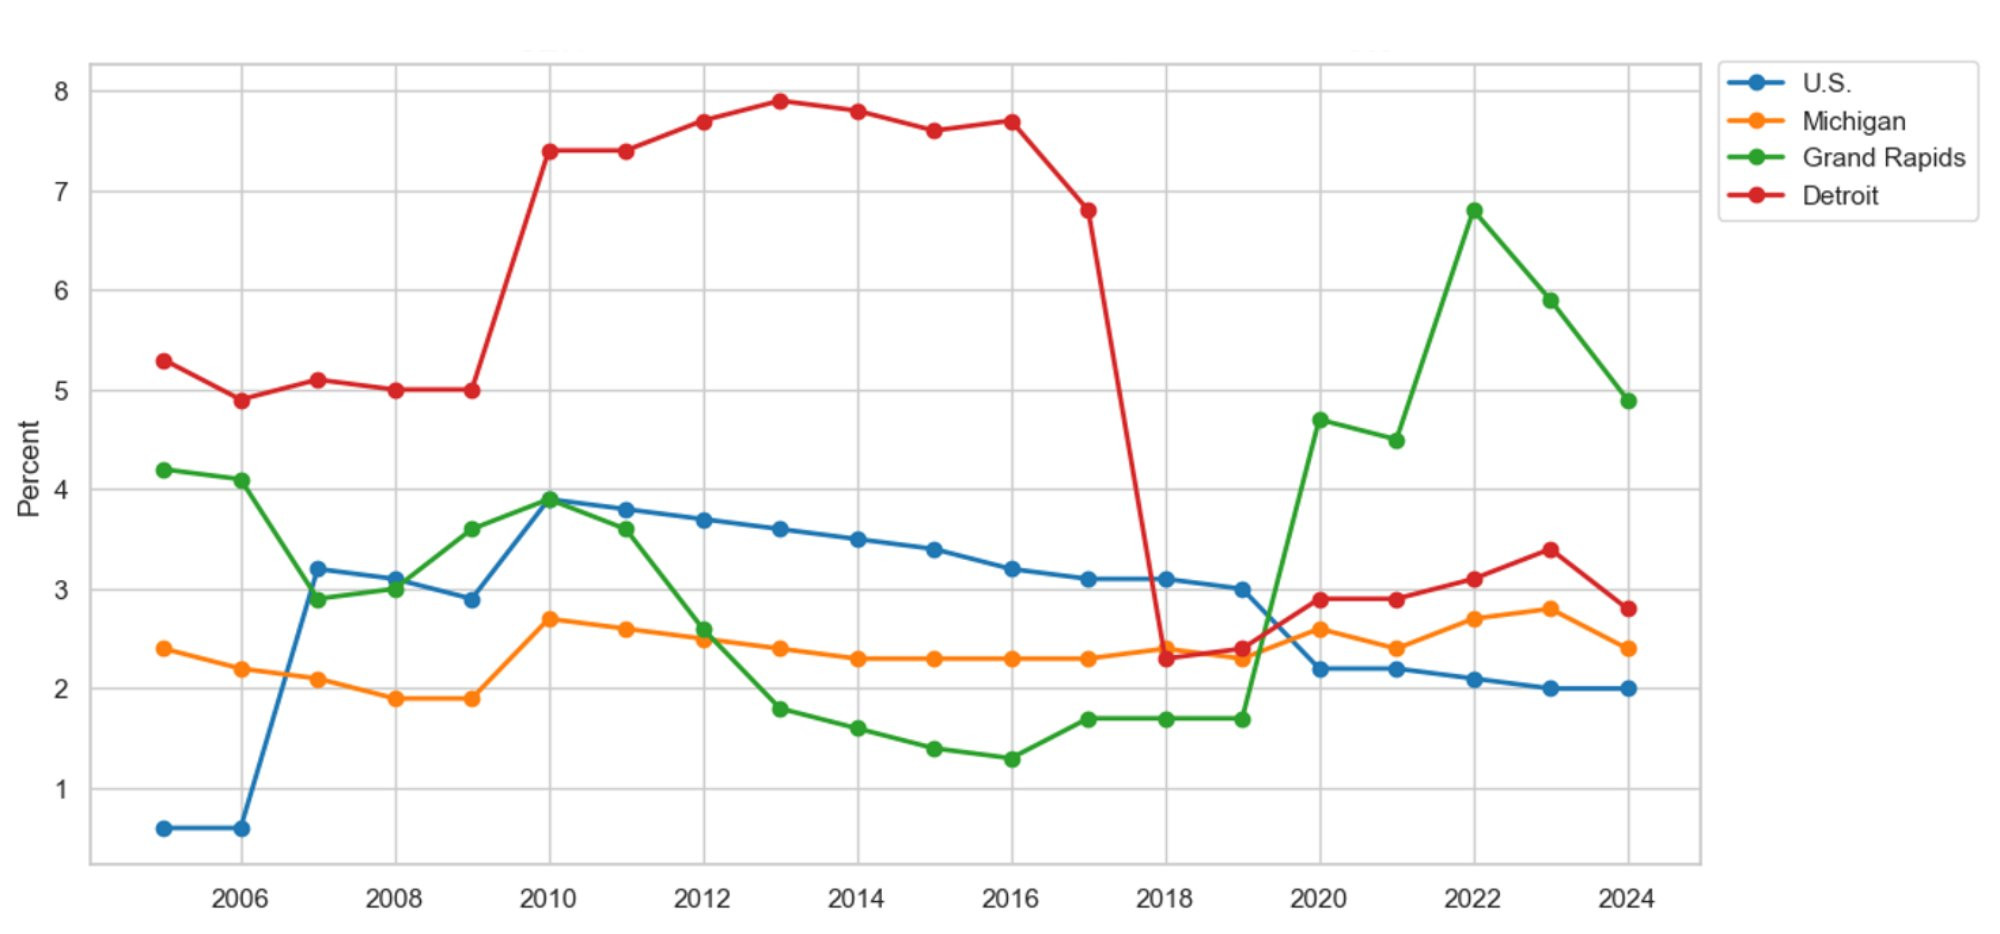
Figure 19 presents the annual replacement rates for medical assistants in the U.S., Michigan, Grand Rapids, and Detroit since the beginning of the Great Recession in 2005. Again, we focus on the COVID-19 pandemic starting in 2019 to say something about recent labor market shortages. Since the onset of the pandemic, replacements stemming from occupational exits and retirements have been, on average, five times higher than those observed in Grand Rapids and Detroit. For example, in 2024, the average U.S. healthcare provider lost 11.5 percent of its workforce due to turnover. Meanwhile, during the same period, the average healthcare provider in Grand Rapids and Detroit lost 2.1 percent of its labor force to occupational exits and retirements. If replacements serve as a proxy for the current shortage of medical assistants, then the results suggest that the shortage in Grand Rapids and Detroit is less severe than the one observed nationally.
Figure 19: Annual Job Replacement Rate for Medical Assistants
Description: Figure 19 shows the yearly replacement rate of medical assistants due to occupational exits and retirements for the U.S., Michigan, Grand Rapids, and Detroit since 2005. The data reveal that during the Great Recession, which began in 2007, annual medical assistant replacements due to exits and retirements were higher than the national average in Grand Rapids and Detroit. Meanwhile, during the COVID-19 pandemic beginning in 2020, medical assistant replacement in Grand Rapids and Detroit did not keep pace with the national average. If annual replacements are used as an indicator of the medical assistant shortage, the shortages in Grand Rapids and Detroit appear to be significantly lower than the national average.
Source: U.S. Bureau of Labor Statistics, Michigan Department of Technology, Management, and Budget
Figure 20 depicts new job growth among medical assistants in the U.S., Michigan, Grand Rapids, and Detroit since the onset of the Great Recession in 2005. We chose to focus on the shortage of medical assistants since the beginning of the COVID-19 pandemic in 2019. We find that the new job growth rates among medical assistants in Grand Rapids and Detroit compare to the national average. For example, healthcare providers in Grand Rapids and Detroit increased the number of medical assistants on payroll by 1.8 percent and 1.4 percent in 2024. In comparison, the average U.S. healthcare provider employed 1.7 percent more medical assistants during the same period. In other words, treating new job growth as a measure of the labor market shortage of medical assistants suggests that the shortage observed in East and West Michigan is comparable to the shortage observed nationally.
Figure 20: Annual New Job Growth for Medical Assistants
Description: Figure 20 shows the yearly new job growth rate of medical assistants for the U.S., Michigan, Grand Rapids, and Detroit since 2005. The data reveal that during the Great Recession, which began in 2007, annual new job growth for medical assistants was higher than the national average in Detroit but lower in Grand Rapids. Meanwhile, during the COVID-19 pandemic, new job growth for medical assistants in Grand Rapids outpaced the national average, but lagged behind it in Detroit. If new job growth is used as an indicator for medical assistant shortages, the shortages in Grand Rapids appear to be smaller than the national average, but larger in Detroit.
Source: U.S. Bureau of Labor Statistics, Michigan Department of Technology, Management, and Budget
Figures 21 and 22 present the inflation-adjusted earnings of medical assistants in the U.S., Michigan, Grand Rapids, and Detroit relative to the beginning of the Great Recession in 2005 and the onset of the COVID-19 pandemic in 2019. Nationally, the inflation-adjusted earnings of medical assistants were unaffected by the Great Recession. That is, the real earnings of the average U.S. medical assistant continuously grew from 2005 to 2011. Meanwhile, the inflation-adjusted incomes of medical assistants in Grand Rapids and Detroit fell during the same period. For example, by 2011, the real earnings of medical assistants decreased by 4.5 percent and 5.2 percent in Grand Rapids and Detroit. To date, the inflation-adjusted incomes of Grand Rapids- and Detroit-based medical assistants have not fully recovered from the Great Recession. Data from the COVID-19 pandemic highlights a similar finding. While real wages have increased by 2 percent nationally since the onset of the pandemic, they have fallen by 1.4 percent and 3.7 percent in Grand Rapids and Detroit, respectively. If labor market participants set their wage expectations in accordance with the national data, then the inflation-adjusted earnings of medical assistants have not kept pace with the national average. Taken together, Figures 19 through 22 highlight a “bang for the buck” effect: Grand Rapids attracts and retains medical assistants better than the national average while simultaneously paying less for labor.
Figure 21: Relative Inflation-Adjusted Earnings for Medical Assistants Since 2005
Description: Figure 21 illustrates relative inflation-adjusted earnings among medical assistants for the U.S., Michigan, Grand Rapids, and Detroit since the start of the Great Recession in 2005. Inflation-adjusted earnings in Grand Rapids and Detroit lagged the national average during the Great Recession, indicating a below-average recovery in medical assistant earnings. If the national average sets labor-market earnings expectations, then healthcare providers in Grand Rapids and Detroit would have found it hard to attract and retain medical assistants under their pay schemes.
Source: U.S. Bureau of Labor Statistics, Michigan Department of Technology, Management, and Budget
Figure 22: Relative Inflation-Adjusted Earnings for Medical Assistants Since 2019
Description: Figure 22 illustrates relative inflation-adjusted earnings among medical assistants for the U.S., Michigan, Grand Rapids, and Detroit since the start of the COVID-19 pandemic in 2019. Inflation-adjusted earnings in Grand Rapids lagged the national average during the pandemic, indicating a below-average recovery in medical assistant earnings. However, inflation-adjusted earnings in Detroit initially exceeded the national average, only to fall below those in Grand Rapids. If the national average sets labor-market earnings expectations, then healthcare providers in Grand Rapids and Detroit would have found it hard to attract and retain medical assistants under their pay schemes.
Source: U.S. Bureau of Labor Statistics, Michigan Department of Technology, Management, and Budget
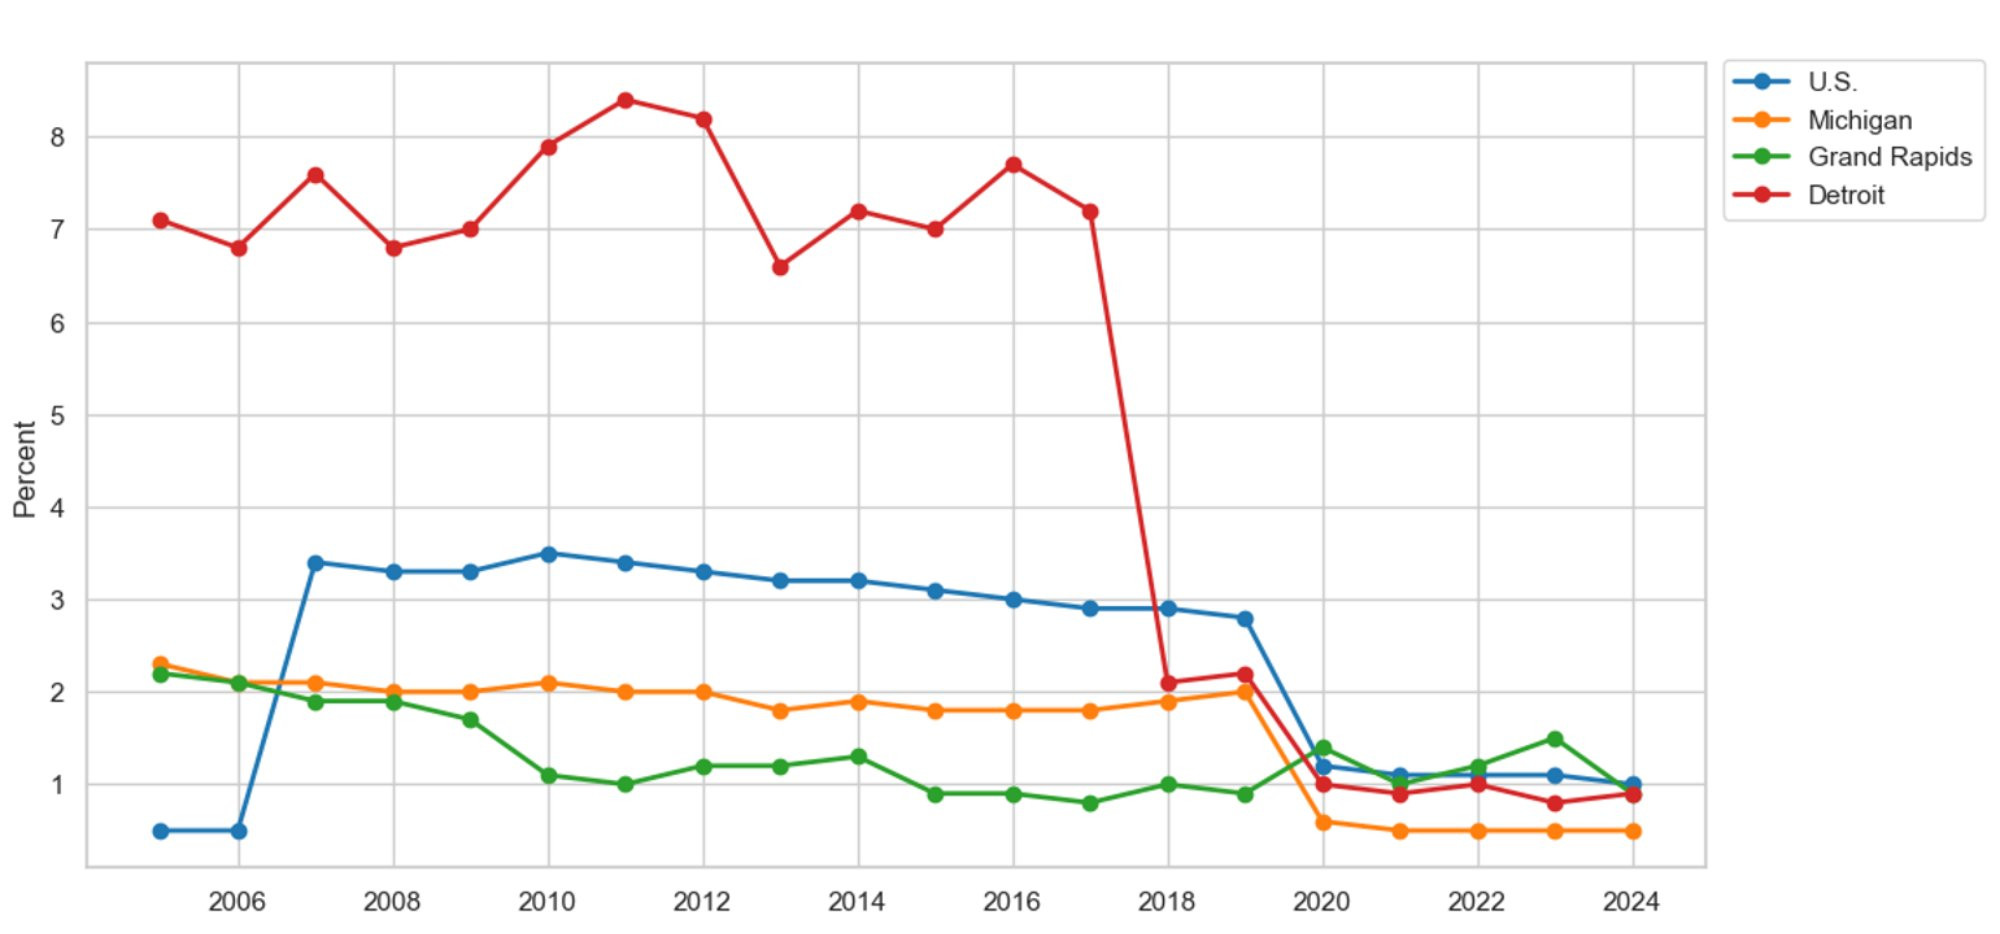
Figure 23 graphs the annual replacement rates for licensed practical nurses (LPNs) and licensed vocational nurses (LVNs) since the onset of the Great Recession in 2005 for the U.S., Michigan, Grand Rapids, and Detroit. We focus our analysis on the most recent data since the beginning of the COVID-19 pandemic in 2019 to study the current nursing shortage. In 2024, the annual replacement rate stemming from occupational exits and retirements was 8.6 percent nationwide. Meanwhile, healthcare providers in East and West Michigan lost 5.1 percent and 3.1 percent of their LPNs and LVNs to exits and retirements during the same period. Again, the data suggest that healthcare providers in Grand Rapids and Detroit can better retain nurses than the average U.S. healthcare provider.
Figure 23: Annual Job Replacement Rate for Nurses, LPNs and LVNs
Description: Figure 23 shows the yearly replacement rate of licensed practical nurses (LPNs) and licensed vocational nurses (LVNs) due to occupational exits and retirements for the U.S., Michigan, Grand Rapids, and Detroit since 2005. The data reveal that during the Great Recession, which began in 2007, the annual LVN and LPN replacements from exits and retirements were higher than the national average in Detroit but lower in Grand Rapids. Meanwhile, during the COVID-19 pandemic beginning in 2020, LVN and LPN replacement in Grand Rapids and Detroit did not keep pace with the national average. If annual replacements are used as an indicator of LVN and LPN shortages, then the shortages in Grand Rapids and Detroit appear to be significantly lower than the national average.
Source: U.S. Bureau of Labor Statistics, Michigan Department of Technology, Management, and Budget
Figure 24 presents the new job growth rate for LPNs and LVNs in the U.S., Michigan, Grand Rapids, and Detroit since the onset of the Great Recession in 2005. Emphasizing the recent shortage since the beginning of the COVID-19 pandemic in 2019, we find that the new job growth rates for LPNs and LVNs in Grand Rapids outpace the national average. For example, in 2024, Grand Rapids-based healthcare providers attracted 1.7 percent more LPNs and LVNs. In comparison, the average U.S. healthcare provider only attracted 1 percent more nurses during the same period. Additionally, we find that Detroit-based healthcare providers are lagging the national average in attracting new talent. For example, in 2024, the average Detroit-based healthcare provider increased LVP and LVN employment by 0.7 percent. If new job growth serves as a proxy for attracting new talent, then Grand Rapids appears more proficient at attracting new talent than the national average. Meanwhile, Detroit appears less proficient at attracting new talent.
Figure 24: Annual New Job Growth for Nurses, LPNs and LVNs
Description: Figure 24 shows the yearly new job growth rate of licensed practical nurses (LPNs) and licensed vocational nurses (LVNs) for the U.S., Michigan, Grand Rapids, and Detroit since 2005. The data reveal that during the Great Recession, which began in 2007, annual new job growth for LVNs and LPNs was comparable to the national average in Detroit but lower in Grand Rapids. Meanwhile, during the COVID-19 pandemic, new job growth for LPNs and LVNs in Grand Rapids outpaced the national average, but lagged it in Detroit. If new job growth is used as an indicator for LPN and LVN shortages, the shortages in Grand Rapids appear to be smaller than the national average, but larger in Detroit.
Source: U.S. Bureau of Labor Statistics, Michigan Department of Technology, Management, and Budget
Figures 25 and 26 present the relative inflation-adjusted earnings of LPNs and LVNs in the U.S., Michigan, Grand Rapids, and Detroit since the beginning of the Great Recession in 2005 and the COVID-19 pandemic in 2019. The data indicate that the average U.S. and Detroit-based LPN and LVN was largely immune to the Great Recession. For example, the real wages of U.S. and Detroit-based nurses increased throughout the Great Recession from 2007 to 2009. Meanwhile, Grand Rapids-based healthcare providers were adversely affected by the Great Recession. For example, by 2008, nursing incomes in Grand Rapids had fallen by 7.4 percent, and real wages did not rebound to their pre-recession levels until 2019. However, data from the COVID-19 pandemic tells an inspiring story for West Michigan healthcare providers, but highlights a problem for Detroiters. For example, inflation-adjusted wages for LPNs and LVNs in Grand Rapids and Detroit increased by 10.9 percent and 2 percent, respectively, by 2024. In comparison, during the same period, nursing wages increased by 7.8 percent nationally. These findings suggest that West Michigan healthcare providers may find it easier to attract and retain talent under their current compensation schemes, as corroborated by Figures 23 and 24. In comparison, East Michigan healthcare providers may find it challenging to attract new nurses under their current compensation scheme, as shown in Figure 24.
Figure 25: Relative Inflation-Adjusted Earnings for Nurses, LPNs and LVNs Since 2005
Description: Figure 25 illustrates relative inflation-adjusted earnings among licensed practical nurses (LPNs) and licensed vocational nurses (LVNs) for the U.S., Michigan, Grand Rapids, and Detroit since the start of the Great Recession in 2005. Inflation-adjusted earnings in Grand Rapids lagged the national average during the Great Recession, indicating a below-average recovery in LVN and LPN earnings. Meanwhile, Detroit's earnings during the Great Recession were comparable to the national average. If the national average sets labor-market earnings expectations, then healthcare providers in Grand Rapids would have found it hard to attract and retain LVNs and LPNs under its pay scheme. Meanwhile, Detroit would have found it easier to attract and retain LVNs and LPNs.
Source: U.S. Bureau of Labor Statistics, Michigan Department of Technology, Management, and Budget
Figure 26: Relative Inflation-Adjusted Earnings for Nurses, LPNs and LVNs Since 2019
Description: Figure 26 illustrates relative inflation-adjusted earnings among licensed practical nurses (LPNs) and licensed vocational nurses (LVNs) for the U.S., Michigan, Grand Rapids, and Detroit since the start of the COVID-19 pandemic in 2019. Inflation-adjusted earnings in Grand Rapids outpaced the national average during the pandemic, indicating an above-average recovery in LVN and LPN earnings. Meanwhile, Detroit's earnings during the pandemic were comparable to the national average, only to fall below it. If the national average sets labor-market earnings expectations, then healthcare providers in Grand Rapids would have found it easier to attract and retain LVNs and LPNs under its pay scheme. Meanwhile, Detroit would have found it harder to attract and retain LVNs and LPNs.
Source: U.S. Bureau of Labor Statistics, Michigan Department of Technology, Management, and Budget
Figure 27 graphs the replacement rates of dental assistants stemming from occupational exits and retirements for the U.S., Michigan, Grand Rapids, and Detroit since 2005. We focus on the most recent data to highlight the shortage of dental assistants since the onset of the COVID-19 pandemic in 2019. Since the start of the pandemic, the national replacement rate for dental assistants has been four times higher than the rates observed in Grand Rapids and Detroit. For example, the average U.S. healthcare provider lost 10.7 percent of its workforce due to occupational exits and retirements in 2024. In comparison, the average Grand Rapids- and Detroit-based healthcare provider only lost 2.4 and 1.5 percent of its labor force due to replacements during the same period. Suppose replacements proxy a healthcare provider's ability to retain talent, and we use it to say something about the shortage of dental assistants. In that case, the scarcity of dental assistants in Grand Rapids and Detroit is not as severe as the national shortage.
Figure 27: Annual Job Replacement Rate for Dental Assistants
Description: Figure 27 shows the yearly replacement rate of dental assistants due to occupational exits and retirements for the U.S., Michigan, Grand Rapids, and Detroit since 2005. The data reveal that during the Great Recession, which began in 2007, annual dental assistant replacements from exits and retirements were higher than the national average in Grand Rapids and Detroit. Meanwhile, during the COVID-19 pandemic beginning in 2020, dental assistant replacement in Grand Rapids and Detroit did not keep pace with the national average. If annual replacements are used as an indicator of dental assistant shortages, then the shortages in Grand Rapids and Detroit appear to be significantly lower than the national average.
Source: U.S. Bureau of Labor Statistics, Michigan Department of Technology, Management, and Budget
Figure 28 presents the new job growth rate for dental assistants in the U.S., Michigan, Grand Rapids, and Detroit since the onset of the Great Recession in 2005. Turning to data on the COVID-19 pandemic, we find that new job growth for dental assistants in Grand Rapids and Detroit lags the national average. For example, in 2024, the average U.S. healthcare provider added 1 percent more employees to their payroll. In comparison, new opportunities for dental assistants in Grand Rapids and Detroit grew by 0.8 percent and 0.5 percent, respectively, during the same period. Suppose new job growth proxies a healthcare provider’s ability to attract new talent, and we use it to say something about the shortage of dental assistants. In that case, the scarcity of dental assistants in Grand Rapids and Detroit is more severe than the national shortage.
Figure 28: Annual New Job Growth for Dental Assistants
Description: Figure 28 shows the yearly new job growth rate of dental assistants for the U.S., Michigan, Grand Rapids, and Detroit since 2005. The data reveal that during the Great Recession, which began in 2007, annual new job growth for dental assistants was comparable to the national average in Grand Rapids but higher in Detroit. Meanwhile, during the COVID-19 pandemic, new job growth for dental assistants in Grand Rapids and Detroit lagged the national average. If new job growth is used as an indicator for dental assistant shortages, the shortages in Grand Rapids and Detroit appear to be larger than the national average.
Source: U.S. Bureau of Labor Statistics, Michigan Department of Technology, Management, and Budget.
Figures 29 and 30 highlight the relative inflation-adjusted earnings of dental assistants in the U.S., Michigan, Grand Rapids, and Detroit since the onset of the Great Recession in 2005 and the COVID-19 pandemic in 2019. The national data on dental assistants highlights an immunity from the Great Recession. A comparable finding occurs in Grand Rapids. For example, the relative inflation-adjusted earnings of U.S. and Grand Rapids-based dental assistants increased throughout the Great Recession. Meanwhile, real wages for Detroit-based dental assistants decreased during the recession. An opposite story is unfolding in the COVID-19 data. Real wages for Detroit-based dental assistants surpassed the national average. In comparison, the real wages for Grand Rapids-based dental assistants lag the national average. For example, by 2024, the inflation-adjusted earnings of dental assistants increased by 0.8 percent in Detroit, but decreased by 3.3 percent and 12 percent in the U.S. and Grand Rapids, respectively. When taken together, Figures 27 through 30 suggest that Grand Rapids and Detroit may struggle to recruit new dental assistants under their current pay systems. However, Detroit is making progress on the pay front with its recent increases in inflation-adjusted wages.
Figure 29: Relative Inflation-Adjusted Earnings for Dental Assistants Since 2005
Description: Figure 29 illustrates relative inflation-adjusted earnings among dental assistants for the U.S., Michigan, Grand Rapids, and Detroit since the start of the Great Recession in 2005. In Detroit, inflation-adjusted earnings lagged the national average during the Great Recession, suggesting a below-average recovery in dental assistant earnings. Meanwhile, Grand Rapids’ earnings are comparable to the national average. If the national average sets labor-market earnings expectations, then healthcare providers in Detroit would have found it hard to attract and retain dental assistants under its pay scheme. Meanwhile, Grand Rapids would have found it easier to attract and retain dental assistants.
Source: U.S. Bureau of Labor Statistics, Michigan Department of Technology, Management, and Budget
Figure 30: Relative Inflation-Adjusted Earnings for Dental Assistants Since 2019
Description: Figure 30 illustrates relative inflation-adjusted earnings among dental assistants for the U.S., Michigan, Grand Rapids, and Detroit since the start of the COVID-19 pandemic in 2019. In Detroit, inflation-adjusted earnings outpaced the national average during the pandemic, suggesting an above-average recovery in dental assistant earnings. Meanwhile, Grand Rapids’ earnings were less than the national average during the same period. If the national average sets labor-market earnings expectations, then healthcare providers in Detroit would have found it easier to attract and retain dental assistants than those in Grand Rapids.
Source: U.S. Bureau of Labor Statistics, Michigan Department of Technology, Management, and Budget
Figure 31 graphs the annual job replacement rate for physical therapists stemming from occupational exits and retirements for the U.S., Michigan, Grand Rapids, and Detroit since the onset of the Great Recession in 2005. We focus on the most recent data to say something about the labor shortage since the start of the COVID-19 pandemic in 2019. The data paints a gloomy picture for Grand Rapids, which reports replacement rates comparable to, and sometimes exceeding, the national average. For example, in 2022, the replacement rate for Grand Rapids-based physical therapists was 5.7 percent. Meanwhile, in 2022, the average U.S. healthcare provider needed to replace approximately 4.7 percent of its workforce. In comparison, Detroit-based healthcare providers were only required to replace 3.1 percent of their labor force during the same period. Let's treat replacements as a proxy for a healthcare provider's ability to retain existing talent, and use that to say something about the recent shortage of physical therapists. The shortage in Grand Rapids is more severe than what is observed nationally. In comparison, Detroit’s shortage is less severe than the national average.
Figure 31: Annual Job Replacement Rate for Physical Therapists
Description: Figure 31 shows the yearly replacement rate of physical therapists due to occupational exits and retirements for the U.S., Michigan, Grand Rapids, and Detroit since 2005. The data reveal that during the Great Recession, which began in 2007, annual physical therapist replacements due to exits and retirements were higher than the national average in Grand Rapids and Detroit. Meanwhile, during the COVID-19 pandemic beginning in 2020, the rate of physical therapist replacement in Detroit did not keep pace with the national average. However, the rate of physical therapist replacement in Grand Rapids exceeded the national average. Suppose annual replacements are used as an indicator of dental assistant shortages. In that case, the shortage in Grand Rapids is more severe than the national average, while in Detroit, it appears to be significantly lower.
Source: U.S. Bureau of Labor Statistics, Michigan Department of Technology, Management, and Budget
Figure 32 presents the new job growth rate for physical therapists in the U.S., Michigan, Grand Rapids, and Detroit since the onset of the Great Recession in 2005. Again, we focus on the most recent developments in new job growth since the start of the COVID-19 pandemic to say something about the recent shortage in physical therapists. During the pandemic, new physical therapist job growth in Grand Rapids and Detroit outpaced the national average. For example, in 2024, Grand Rapids- and Detroit-based healthcare providers employed 4.9 percent and 2.8 percent more physical therapists, respectively. In comparison, the average U.S. healthcare provider only employed 2 percent more physical therapists. If we treat new job growth as a proxy for a healthcare provider’s ability to attract new talent and use it to say something about the recent physical therapist labor shortage, then the shortage in Grand Rapids and Detroit is not as severe as the one observed nationally.
Figure 32: Annual New Job Growth for Physical Therapists
Description: Figure 32 shows the yearly new job growth rate of physical therapists for the U.S., Michigan, Grand Rapids, and Detroit since 2005. The data reveal that during the Great Recession, which began in 2007, annual new job growth for physical therapists was comparable to the national average in Grand Rapids but higher in Detroit. Meanwhile, during the COVID-19 pandemic, new job growth for physical therapists in Grand Rapids and Detroit outpaced the national average. If new job growth is used as an indicator of physical therapist shortages, the shortages in Grand Rapids and Detroit appear to be smaller than the national average.
Source: U.S. Bureau of Labor Statistics, Michigan Department of Technology, Management, and Budget
Figures 33 and 34 illustrate the change in relative inflation-adjusted earnings for physical therapists in the U.S., Michigan, Grand Rapids, and Detroit since the onset of the Great Recession in 2005 and the start of the COVID-19 pandemic in 2019. The data highlights a quick recovery from the Great Recession of 2007 to 2009. For example, the average physical therapist's inflation-adjusted earnings increased throughout the recession in Grand Rapids and Detroit, slightly lagging the U.S. average. In comparison, the real incomes of physical therapists have decreased throughout the COVID-19 pandemic, beginning in 2019. For example, the real wages of physical therapists have decreased by 7.4 percent, 10.8 percent, and 11.8 percent in the U.S., Grand Rapids, and Michigan, respectively. The inflation-adjusted earnings of physical therapists have yet to return to their pre-pandemic levels. Taking Figures 31 through 34 together, we find that Grand Rapids-based healthcare providers appear to be attracting new physical therapists despite below-average inflation-adjusted pay increases. However, Grand Rapids-based healthcare providers seem to have difficulty retaining physical therapists, a difficulty that the below-average pay increases may also explain. In comparison, Detroit-based healthcare providers appear to be getting more bang for their buck, attracting and retaining new physical therapists for lower pay.
Figure 33: Relative Inflation-Adjusted Earnings for Physical Therapists Since 2005
Description: Figure 33 illustrates relative inflation-adjusted earnings among physical therapists for the U.S., Michigan, Grand Rapids, and Detroit since the start of the Great Recession in 2005. Inflation-adjusted earnings in Grand Rapids and Detroit lagged the national average during the Great Recession, indicating a below-average recovery in physical therapist earnings. If the national average sets labor-market earnings expectations, then healthcare providers in Grand Rapids and Detroit would have found it hard to attract and retain physical therapists under their pay schemes.
Source: U.S. Bureau of Labor Statistics, Michigan Department of Technology, Management, and Budget
Figure 34: Relative Inflation-Adjusted Earnings for Physical Therapists Since 2019
Description: Figure 34 illustrates relative inflation-adjusted earnings among physical therapists for the U.S., Michigan, Grand Rapids, and Detroit since the start of the COVID-19 pandemic in 2019. Inflation-adjusted earnings in Grand Rapids and Detroit lagged the national average during the pandemic, indicating a below-average recovery in physical therapist earnings. If the national average sets labor-market earnings expectations, then healthcare providers in Grand Rapids and Detroit would have found it hard to attract and retain physical therapists under their pay schemes.
Source: U.S. Bureau of Labor Statistics, Michigan Department of Technology, Management, and Budget
Figure 35 graphs the annual replacement rate for pharmacists due to occupational exits and retirements in the U.S., Michigan, Grand Rapids, and Detroit since the onset of the Great Recession in 2005. We focus on the most recent data to say something about the current labor shortage in pharmacists beginning at the start of the COVID-19 pandemic in 2019. Throughout the pandemic, the number of pharmacists leaving the occupation or retiring was higher nationally than in Grand Rapids or Detroit. For example, in 2024, the average U.S. healthcare provider had to replace 3.6 percent of its workforce. In comparison, the average Grand Rapids- and Detroit-based healthcare provider only had to replace 2.6 percent and 1.9 percent of its workforce due to occupational exits and retirements. Suppose we use replacements to discuss the recent pharmacist shortage. In that case, it appears that healthcare providers in Grand Rapids and Detroit can better retain existing workers, thereby reducing their shortage below the national average.
Figure 35: Annual Job Replacement Rate for Pharmacists
Description: Figure 35 shows the yearly replacement rate of pharmacists due to occupational exits and retirements for the U.S., Michigan, Grand Rapids, and Detroit since 2005. The data reveal that during the Great Recession, which began in 2007, annual pharmacist replacements due to exits and retirements were higher than the national average in Grand Rapids and Detroit. Meanwhile, during the COVID-19 pandemic beginning in 2020, pharmacist replacement in Grand Rapids and Detroit did not keep pace with the national average. Suppose annual replacements are used as an indicator of pharmacist shortages. In that case, the shortage in Grand Rapids and Detroit appears to be significantly lower than the national average.
Source: U.S. Bureau of Labor Statistics, Michigan Department of Technology, Management, and Budget
Figure 36 presents the new job growth rate for pharmacists in the U.S., Michigan, Grand Rapids, and Detroit since the start of the Great Recession in 2005. Again, we focus on the recent data to say something about the labor shortage among pharmacists. The data indicates that Grand Rapids- and Detroit-based healthcare providers are better able to attract new talent than the national average. For example, in 2024, the number of new pharmacist positions opening decreased by 0.2 percent nationally, but increased by 1 percent in Grand Rapids and 0.2 percent in Detroit. If we use new job growth rates to say something about the labor shortage among pharmacists, then the shortage in Grand Rapids and Detroit appears smaller than the national shortage.
Figure 36: Annual New Job Growth for Pharmacists
Description: Figure 36 shows the yearly new job growth rate of pharmacists for the U.S., Michigan, Grand Rapids, and Detroit since 2005. The data reveal that during the Great Recession, which began in 2007, annual new job growth for pharmacists was higher than the national average in Grand Rapids and Detroit. Meanwhile, during the COVID-19 pandemic, new job growth for pharmacists in Grand Rapids and Detroit outpaced the national average. If new job growth is used as an indicator of pharmacist shortages, the shortages in Grand Rapids and Detroit appear to be smaller than the national average.
Source: U.S. Bureau of Labor Statistics, Michigan Department of Technology, Management, and Budget
Figures 37 and 38 study the inflation-adjusted earnings of pharmacists in the U.S., Michigan, Grand Rapids, and Detroit relative to the start of the Great Recession in 2005 and the COVID-19 pandemic in 2019. The evolution of inflation-adjusted earnings suggests a quick recovery or immunity in earnings from the Great Recession. For example, inflation-adjusted earnings in Grand Rapids, like the national average, increased throughout the Great Recession, while Detroiters lagged slightly behind. Meanwhile, a different picture emerges when we turn to the pandemic data. For example, real wage growth in Grand Rapids has recently exceeded the national average. However, the inflation-adjusted incomes of pharmacists have decreased in the U.S., Grand Rapids, and Detroit since the beginning of the pandemic. By 2024, the inflation-adjusted earnings of pharmacists decreased by 10.9 percent, 8.7 percent, and 13.1 percent in the U.S., Grand Rapids, and Detroit, respectively. Taking Figures 35 through 38 together suggests that Grand Rapids- and Detroit-based are getting more bang for their buck on the pharmacist front. For example, both appear to be able to attract and retain talent better than the average healthcare provider, and do so at a lower price. Again, we ask the reader how long this trend can persist given the recent decreases in inflation-adjusted earnings.
Figure 37: Relative Inflation-Adjusted Earnings for Pharmacists Since 2005
Description: Figure 37 illustrates relative inflation-adjusted earnings among pharmacists for the U.S., Michigan, Grand Rapids, and Detroit since the start of the Great Recession in 2005. Inflation-adjusted earnings in Grand Rapids were comparable to the national average during the Great Recession, highlighting an average recovery in pharmacist earnings. Meanwhile, the inflation-adjusted earnings of pharmacists in Detroit exceeded the national average, indicating an above-average recovery in pharmacist earnings. If the national average sets labor-market earnings expectations, then healthcare providers in Detroit would have found it easier to attract and retain pharmacists under its pay scheme. However, Grand Rapids would face the same challenges as the average healthcare provider in attracting and retaining pharmacists.
Source: U.S. Bureau of Labor Statistics, Michigan Department of Technology, Management, and Budget
Figure 38: Relative Inflation-Adjusted Earnings for Pharmacists Since 2019
Description: Figure 38 illustrates relative inflation-adjusted earnings among pharmacists for the U.S., Michigan, Grand Rapids, and Detroit since the start of the COVID-19 pandemic in 2019. Inflation-adjusted earnings in Grand Rapids outpaced the national average during the pandemic, highlighting an above-average recovery in pharmacist earnings. Meanwhile, inflation-adjusted earnings for pharmacists in Detroit were below the national average, indicating a below-average recovery in pharmacist earnings. If the national average sets labor-market earnings expectations, then healthcare providers in Grand Rapids would have found it easier to attract and retain pharmacists than those in Detroit.
Source: U.S. Bureau of Labor Statistics, Michigan Department of Technology, Management, and Budget
Figure 39 graphs the annual replacement rate for physician assistants (PAs) stemming from occupational exits and retirements in the U.S., Michigan, Grand Rapids, and Detroit since the onset of the Great Recession in 2005. We focus on recent developments in replacement since the start of the COVID-19 pandemic in 2019 to provide context for the current shortage of PAs. Throughout the pandemic, PA replacement in Grand Rapids and Detroit has been lower than the national replacement rate. In 2024, the average healthcare provider needed to replace 5.3 percent of its PAs due to occupational exits and retirements. Meanwhile, Grand Rapids- and Detroit-based healthcare providers replaced 1.5 percent of their PAs due to exits and replacements. Suppose we use replacements as a proxy for the PA shortage. In that case, Grand Rapids and Detroit appear to retain existing talent more effectively, resulting in lower-than-average shortages.
Figure 39: Annual Job Replacement Rate for Physician Assistants, PAs
Description: Figure 39 shows the yearly replacement rate of physician assistants (PAs) due to occupational exits and retirements for the U.S., Michigan, Grand Rapids, and Detroit since 2005. The data reveal that during the Great Recession, which began in 2007, annual PA replacements due to exits and retirements were higher than the national average in Grand Rapids and Detroit. Meanwhile, during the COVID-19 pandemic beginning in 2020, PA replacement in Grand Rapids and Detroit did not keep pace with the national average. Suppose annual replacements are used as an indicator of PA shortages. In that case, the shortage in Grand Rapids and Detroit appears to be significantly lower than the national average.
Source: U.S. Bureau of Labor Statistics, Michigan Department of Technology, Management, and Budget
Figure 40 presents the new job growth rates for PAs in the U.S., Michigan, Grand Rapids, and Detroit since 2005. Again, we focus on the evolution of new job growth since the start of the COVID-19 pandemic in 2019 to say something about the recent PA shortage. Since the onset of the pandemic, new PA job growth in Grand Rapids and Detroit has lagged the U.S. average. For example, in 2024, healthcare providers in East and West Michigan grew PA employment by 1.5 percent and 1.8 percent, respectively. However, the average U.S. healthcare provider attracted 2.6 percent more PAs during the same period. If new job growth proxies for the ability to attract new talent, and we use it to say something about the recent labor shortage, then we find that the PA shortage in East and West Michigan is more severe than the national average.
Figure 40: Annual New Job Growth for Physician Assistants, PAs
Description: Figure 40 shows the yearly new job growth rate of physician assistants (PAs) for the U.S., Michigan, Grand Rapids, and Detroit since 2005. The data reveal that during the Great Recession, which began in 2007, annual new job growth for PAs was higher than the national average in Grand Rapids and lower in Detroit. Meanwhile, during the COVID-19 pandemic, new job growth for PAs in Grand Rapids and Detroit lagged the national average. If new job growth is used as an indicator of PA shortages, the shortages in Grand Rapids and Detroit appear to be larger than the national average.
Source: U.S. Bureau of Labor Statistics, Michigan Department of Technology, Management, and Budget
Figures 41 and 42 display the inflation-adjusted earnings measures for PAs in the U.S., Michigan, Grand Rapids, and Detroit relative to the start of the Great Recession in 2005 and the onset of the COVID-19 pandemic in 2019. Turning to the Great Recession, we find that the recovery in Grand Rapids and Detroit lagged the national average between 2007 and 2009. In fact, while national earnings measures grew during the Great Recession, the relative inflation-adjusted earnings of PAs decreased in East and West Michigan during the same period. The inflation-adjusted earnings of PAs in Grand Rapids did not return to pre-recession levels until 2013. To date, PA earnings in Detroit have not fully recovered. Turning to the COVID-19 pandemic, we find that PA inflation-adjusted earnings have consistently lagged the national average in Grand Rapids and Detroit. By 2024, real wages among PAs in Grand Rapids and Detroit will have fallen by 2.2 percent and 5.1 percent, respectively. In comparison, the national average dipped by 0.7 percent during the same period. Taking Figures 39 through 42 together, we find that healthcare providers in Grand Rapids and Detroit may find it harder to attract new talent due to their below-average pay systems. Meanwhile, these same healthcare providers are getting more bang for their buck on retaining their existing talent.
Figure 41: Relative Inflation-Adjusted Earnings for Physician Assistants, PAs Since 2005
Description: Figure 41 illustrates relative inflation-adjusted earnings among physician assistants (PAs) for the U.S., Michigan, Grand Rapids, and Detroit since the start of the Great Recession in 2005. Inflation-adjusted earnings in Grand Rapids and Detroit were lower than the national average during the Great Recession, highlighting a below-average recovery in PA earnings. If the national average sets labor-market earnings expectations, then healthcare providers in Grand Rapids and Detroit would have found it harder to attract and retain PAs under their pay schemes.
Source: U.S. Bureau of Labor Statistics, Michigan Department of Technology, Management, and Budget
Figure 42: Relative Inflation-Adjusted Earnings for Physician Assistants, PAs Since 2019
Description: Figure 42 illustrates relative inflation-adjusted earnings among physician assistants (PAs) for the U.S., Michigan, Grand Rapids, and Detroit since the start of the COVID-19 pandemic in 2019. Inflation-adjusted earnings in Grand Rapids and Detroit were lower than the national average during the pandemic, highlighting a below-average recovery in PA earnings. If the national average sets labor-market earnings expectations, then healthcare providers in Grand Rapids and Detroit would have found it harder to attract and retain PAs under their pay schemes.
Source: U.S. Bureau of Labor Statistics, Michigan Department of Technology, Management, and Budget
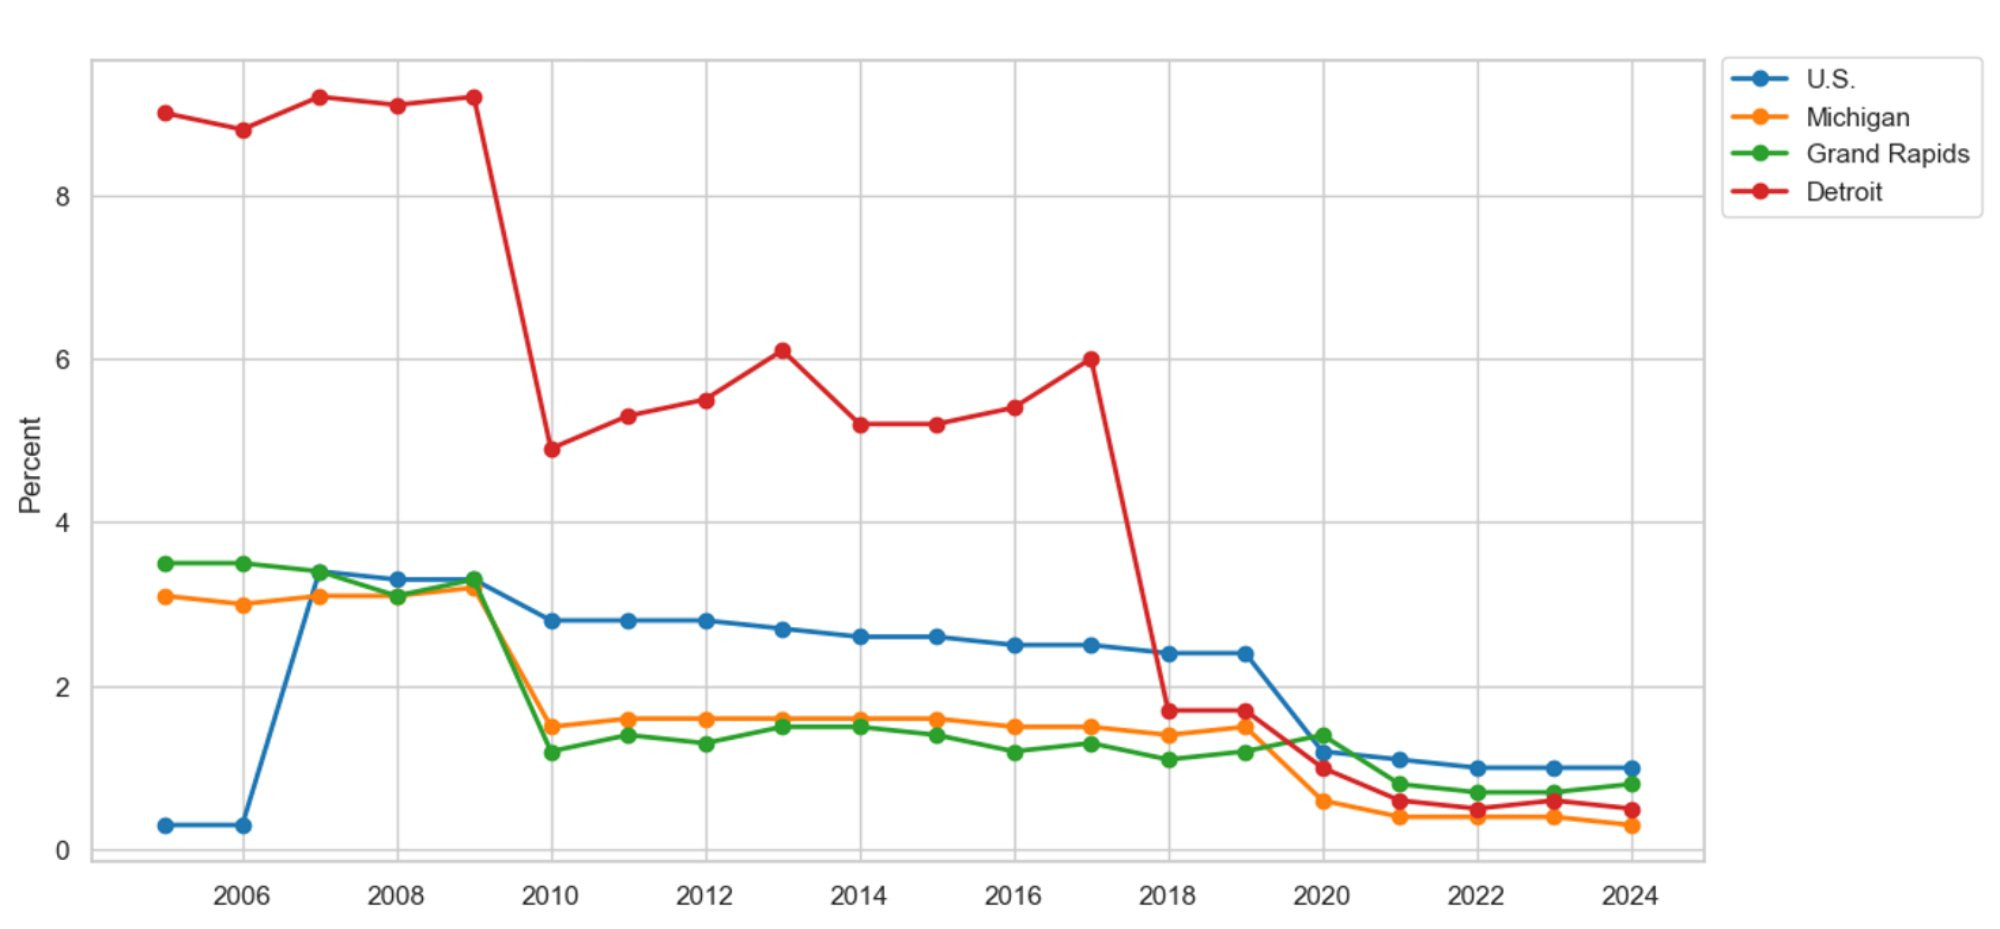
Figure 43 graphs the annual replacement rate for dental hygienists who exit the occupation or retire in the U.S., Michigan, Grand Rapids, and Detroit since the onset of the Great Recession in 2005. We focus on replacement trends since the beginning of the COVID-19 pandemic to shed light on the recent labor shortage among dental hygienists. On average, the national replacement rate is three times higher than that observed in Grand Rapids and Detroit, indicating that healthcare providers in East and West Michigan are better able to retain existing talent. In 2024, the average U.S. healthcare provider replaced 6.1 percent of its dental hygienist workforce due to occupational exits and retirements. Meanwhile, the average Grand Rapids- and Detroit-based healthcare provider replaced 1.8 percent and 1.9 percent of its dental hygienist labor force during the same period.
Figure 43: Annual Job Replacement Rate for Dental Hygienists
Description: Figure 43 shows the yearly replacement rate of dental hygienists due to occupational exits and retirements for the U.S., Michigan, Grand Rapids, and Detroit since 2005. The data reveal that during the Great Recession, which began in 2007, annual dental hygienist replacements due to exits and retirements were higher than the national average in Detroit and lower in Grand Rapids. Meanwhile, during the COVID-19 pandemic beginning in 2020, dental hygienist replacement in Grand Rapids and Detroit did not keep pace with the national average. Suppose annual replacements are used as an indicator of dental hygienist shortages. In that case, the shortage in Grand Rapids and Detroit appears to be significantly lower than the national average.
Source: U.S. Bureau of Labor Statistics, Michigan Department of Technology, Management, and Budget
Figure 44 presents the new job growth rates of dental hygienists in the U.S., Michigan, Grand Rapids, and Detroit since the onset of the Great Recession in 2005. Again, we focus on data from 2019 to 2024, covering the COVID-19 pandemic, to say something about the shortage of dental hygienists. The new job growth rates of dental hygienists in Grand Rapids and Detroit mimic the national average. For example, in 2024, the average U.S. healthcare provider employed 1 percent more dental hygienists, while hygienists grew by 0.9 percent in Grand Rapids and Detroit during the same period. Suppose we use new job growth rates among dental hygienists as a proxy for healthcare providers' ability to attract new talent, and use them to say something about the hygienist shortage. In that case, the scarcity of hygienists in East and West Michigan is comparable to the nationwide shortage.
Figure 44: Annual New Job Growth for Dental Hygienists
Description: Figure 44 shows the yearly new job growth rate of dental hygienists for the U.S., Michigan, Grand Rapids, and Detroit since 2005. The data reveal that during the Great Recession, which began in 2007, annual new job growth for dental hygienists was higher than the national average in Detroit and lower in Grand Rapids. Meanwhile, during the COVID-19 pandemic, new job growth for dental hygienists in Grand Rapids was comparable to the national average, but lower in Detroit. If new job growth is used as an indicator of dental hygienist shortages, shortages in Grand Rapids are in line with the national average but appear larger in Detroit.
Source: U.S. Bureau of Labor Statistics, Michigan Department of Technology, Management, and Budget
Figures 45 and 46 highlight the relative inflation-adjusted earnings of dental hygienists in the U.S., Michigan, Grand Rapids, and Detroit since the beginning of the Great Recession in 2005 and the COVID-19 pandemic in 2019. The average dental hygienist in the U.S., Grand Rapids, and Detroit has observed real wage decreases since 2007. The inflation-adjusted earnings of dental hygienists in Grand Rapids returned to their pre-recession levels in 2017. However, earnings have not returned to their pre-recession baseline nationwide or in Detroit. Turning to the COVID-19 pandemic, we find evidence of a similar story unfolding. For example, the average dental hygienist's income in the U.S. and Detroit did not return to pre-pandemic levels until 2024. However, by late 2022, real hygienist wages had returned to their pre-pandemic levels and began to grow. Taking Figures 43 through 46 together, we find that healthcare providers in Grand Rapids are better able to attract and retain talent than the average healthcare provider, which may be explained by inflation-adjusted earnings keeping pace with, and sometimes exceeding, the national average. In comparison, Detroit healthcare providers appear to be able to attract and retain dental hygienists at a lower cost, as evidenced by the decrease in inflation-adjusted earnings.
Figure 45: Relative Inflation-Adjusted Earnings for Dental Hygienists Since 2005
Description: Figure 45 illustrates relative inflation-adjusted earnings among dental hygienists for the U.S., Michigan, Grand Rapids, and Detroit since the start of the Great Recession in 2005. Inflation-adjusted earnings in Grand Rapids were comparable to the national average during the Great Recession, indicating an average recovery in dental hygienist pay. Meanwhile, the inflation-adjusted earnings for Detroit dental hygienists were lower than the national average during the Great Recession, highlighting a below-average recovery in hygienist earnings. If the national average sets labor-market earnings expectations, then healthcare providers in Grand Rapids would have found it easier to attract and retain dental hygienists under their pay scheme than Detroit healthcare providers.
Source: U.S. Bureau of Labor Statistics, Michigan Department of Technology, Management, and Budget
Figure 46: Relative Inflation-Adjusted Earnings for Dental Hygienists Since 2019
Description: Figure 46 illustrates relative inflation-adjusted earnings among dental hygienists for the U.S., Michigan, Grand Rapids, and Detroit since the start of the COVID-19 pandemic in 2019. Inflation-adjusted earnings in Grand Rapids and Detroit both oscillate around the national average. Currently, the inflation-adjusted incomes of Grand Rapids-based dental hygienists outpace the national average, while Detroit-based dental hygienists closely match it. If the national average sets labor-market earnings expectations, healthcare providers in Grand Rapids would find it easier to attract and retain dental hygienists than those in Detroit.
Source: U.S. Bureau of Labor Statistics, Michigan Department of Technology, Management, and Budget
Figure 47 graphs the annual job replacement rate for occupational therapists stemming from occupational exits and retirements in the U.S., Michigan, Grand Rapids, and Detroit since the onset of the Great Recession in 2005. Again, we focus on data from the COVID-19 pandemic, beginning in 2019, to analyze the recent shortage of occupational therapists. On average, Grand Rapids- and Detroit-based healthcare providers retain occupational therapists better than the typical U.S. healthcare provider. For example, during the pandemic, the annual replacement rate for the average U.S. healthcare provider was twice that in Grand Rapids and Detroit. In 2024, the national replacement rate for occupational therapists was 5.1 percent. In comparison, healthcare providers in East and West Michigan were forced to replace 1.5 percent and 2.3 percent of their occupational therapists during the same period. Suppose replacement rates proxy a healthcare provider's ability to retain existing talent, and we use this metric to understand the labor shortage. In that case, the scarcity of occupational therapists in Grand Rapids and Detroit is not as severe as the nationwide shortage.
Figure 47: Annual Job Replacement Rate for Occupational Therapists
Description: Figure 43 shows the yearly replacement rate of occupational therapists due to occupational exits and retirements for the U.S., Michigan, Grand Rapids, and Detroit since 2005. The data reveal that during the Great Recession, which began in 2007, annual occupational therapist replacements due to exits and retirements were higher than the national average in Grand Rapids and Detroit. Meanwhile, during the COVID-19 pandemic beginning in 2020, occupational therapist replacement in Grand Rapids and Detroit did not keep pace with the national average. Suppose annual replacements are used as an indicator of occupational therapist shortages. In that case, the shortage in Grand Rapids and Detroit appears to be significantly lower than the national average.
Source: U.S. Bureau of Labor Statistics, Michigan Department of Technology, Management, and Budget
Figure 48 presents the new job growth rates for occupational therapists in the U.S., Michigan, Grand Rapids, and Detroit since the start of the Great Recession in 2005. We focus on the COVID-19 pandemic to comment on the recent shortage of occupational therapists. The data indicate that Grand Rapids-based healthcare providers find it easier than the average U.S. healthcare provider to attract new occupational therapists. Meanwhile, Detroit-based providers can attract new talent at a rate consistent with the national average. For example, in 2024, the average healthcare provider in the U.S. and Detroit added 1.5 percent more occupational therapists to their payroll. In comparison, the average healthcare provider in Grand Rapids increased the number of occupational therapists on payroll by 3.1 percent. Suppose new job growth rates proxy a healthcare provider's ability to attract new talent, and we use this metric to understand the labor shortage. In that case, the shortage of occupational therapists in Grand Rapids is not as severe as the national average, but it is comparable to that in Detroit.
Figure 48: Annual New Job Growth for Occupational Therapists
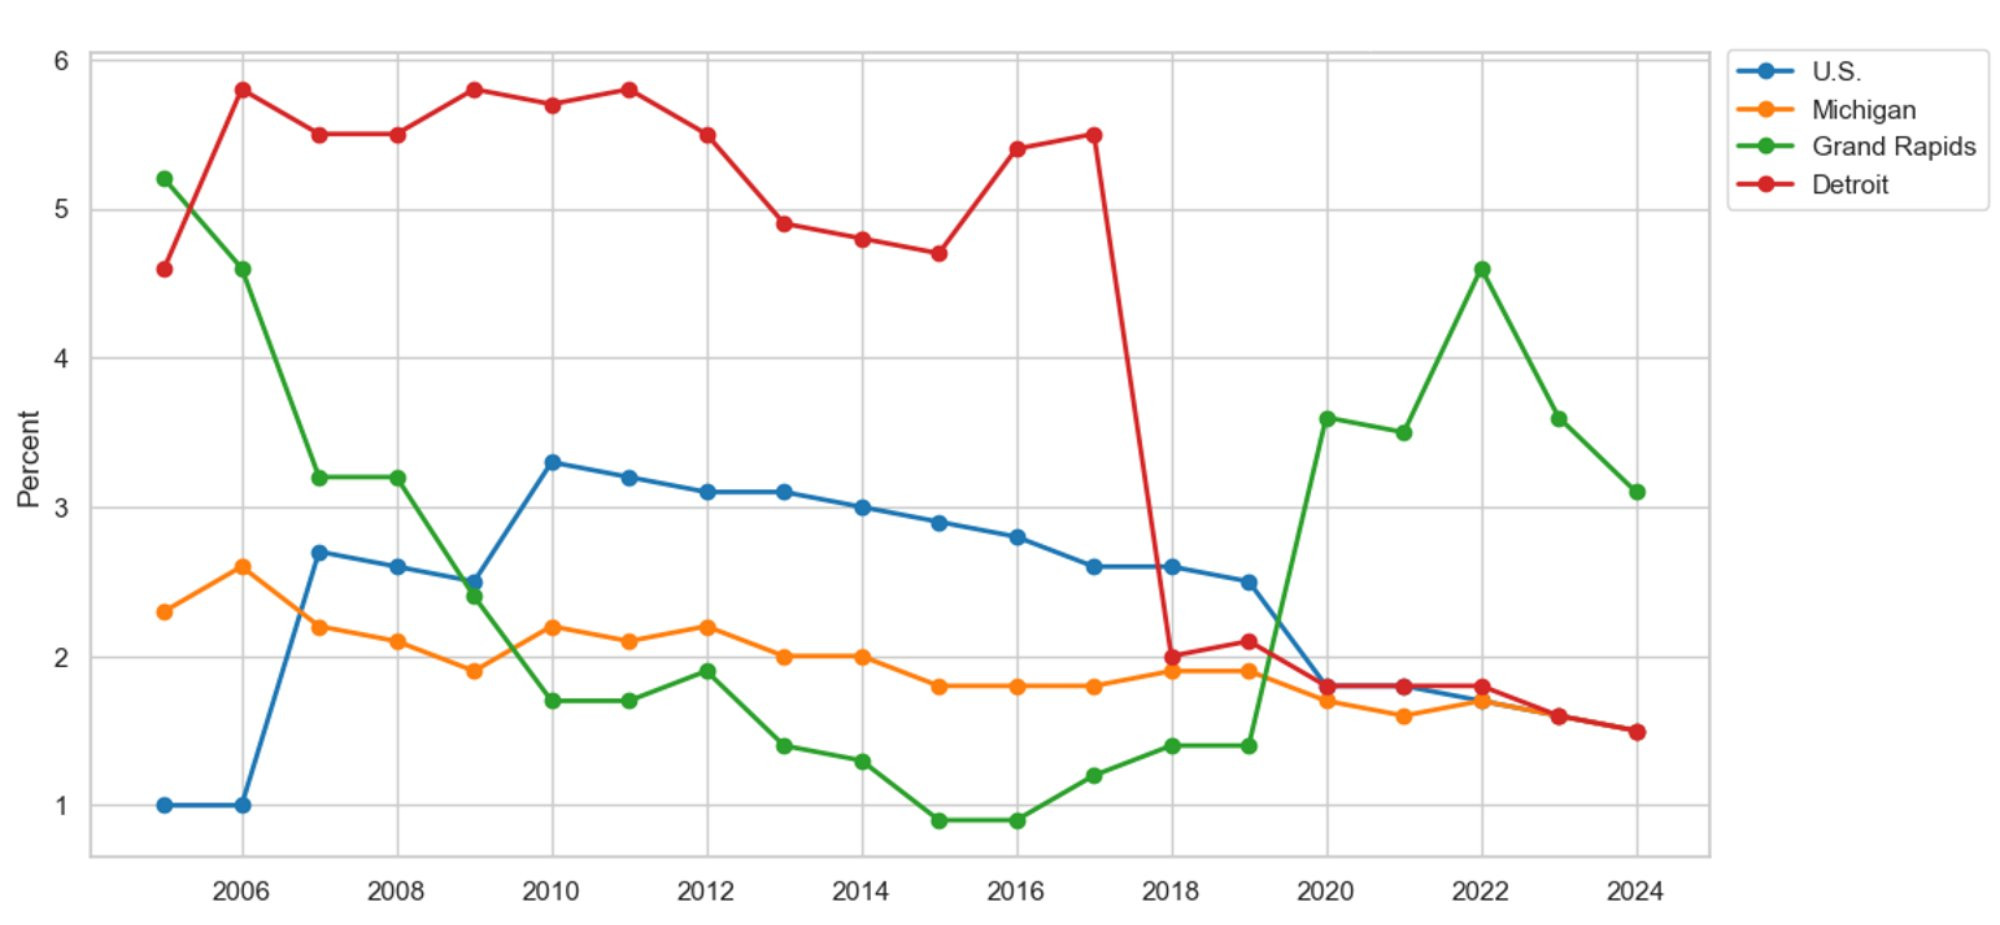
Description: Figure 48 shows the yearly new job growth rate of occupational therapists for the U.S., Michigan, Grand Rapids, and Detroit since 2005. The data reveal that during the Great Recession, which began in 2007, annual new job growth for occupational therapists was higher than the national average in Grand Rapids and Detroit. Meanwhile, during the COVID-19 pandemic, new job growth for occupational therapists in Detroit was comparable to the national average, but higher in Grand Rapids. If new job growth is used as an indicator of occupational therapist shortages, shortages in Detroit are in line with the national average but appear smaller in Grand Rapids.
Source: U.S. Bureau of Labor Statistics, Michigan Department of Technology, Management, and Budget
Figures 49 and 50 present the inflation-adjusted earnings measures of occupational therapists in the U.S., Michigan, Grand Rapids, and Detroit relative to the start of the Great Recession in 2005 and the COVID-19 pandemic in 2019. The data suggest that occupational therapists were relatively unaffected by the Great Recession in the U.S. and in Detroit, as evidenced by rising real incomes throughout the sample. Meanwhile, occupational therapists in Grand Rapids found the Great Recession detrimental to earnings, as evidenced by the 14 percent decline in incomes from 2007 to 2009 and the fact that real earnings have yet to recover fully. An opposite story unfolds during the COVID-19 pandemic. While inflation-adjusted earnings of occupational therapists returned to their pre-pandemic levels in Grand Rapids by 2023, they have yet to recover in the U.S. and Detroit. By 2024, the average occupational therapist in the U.S. and in Detroit observed wage decreases of 7.1 percent and 13.4 percent, respectively. Figures 47 through 50 indicate that healthcare providers in Grand Rapids are better able to attract and retain talented occupational therapists than the average U.S. healthcare provider, possibly due to the recent increase in inflation-adjusted earnings. However, the same story unfolds in Detroit, without the increase in inflation-adjusted earnings, which may be problematic moving forward if worker set their earnings expectations in accordance with the national average.
Figure 49: Relative Inflation-Adjusted Earnings for Occupational Therapists Since 2005
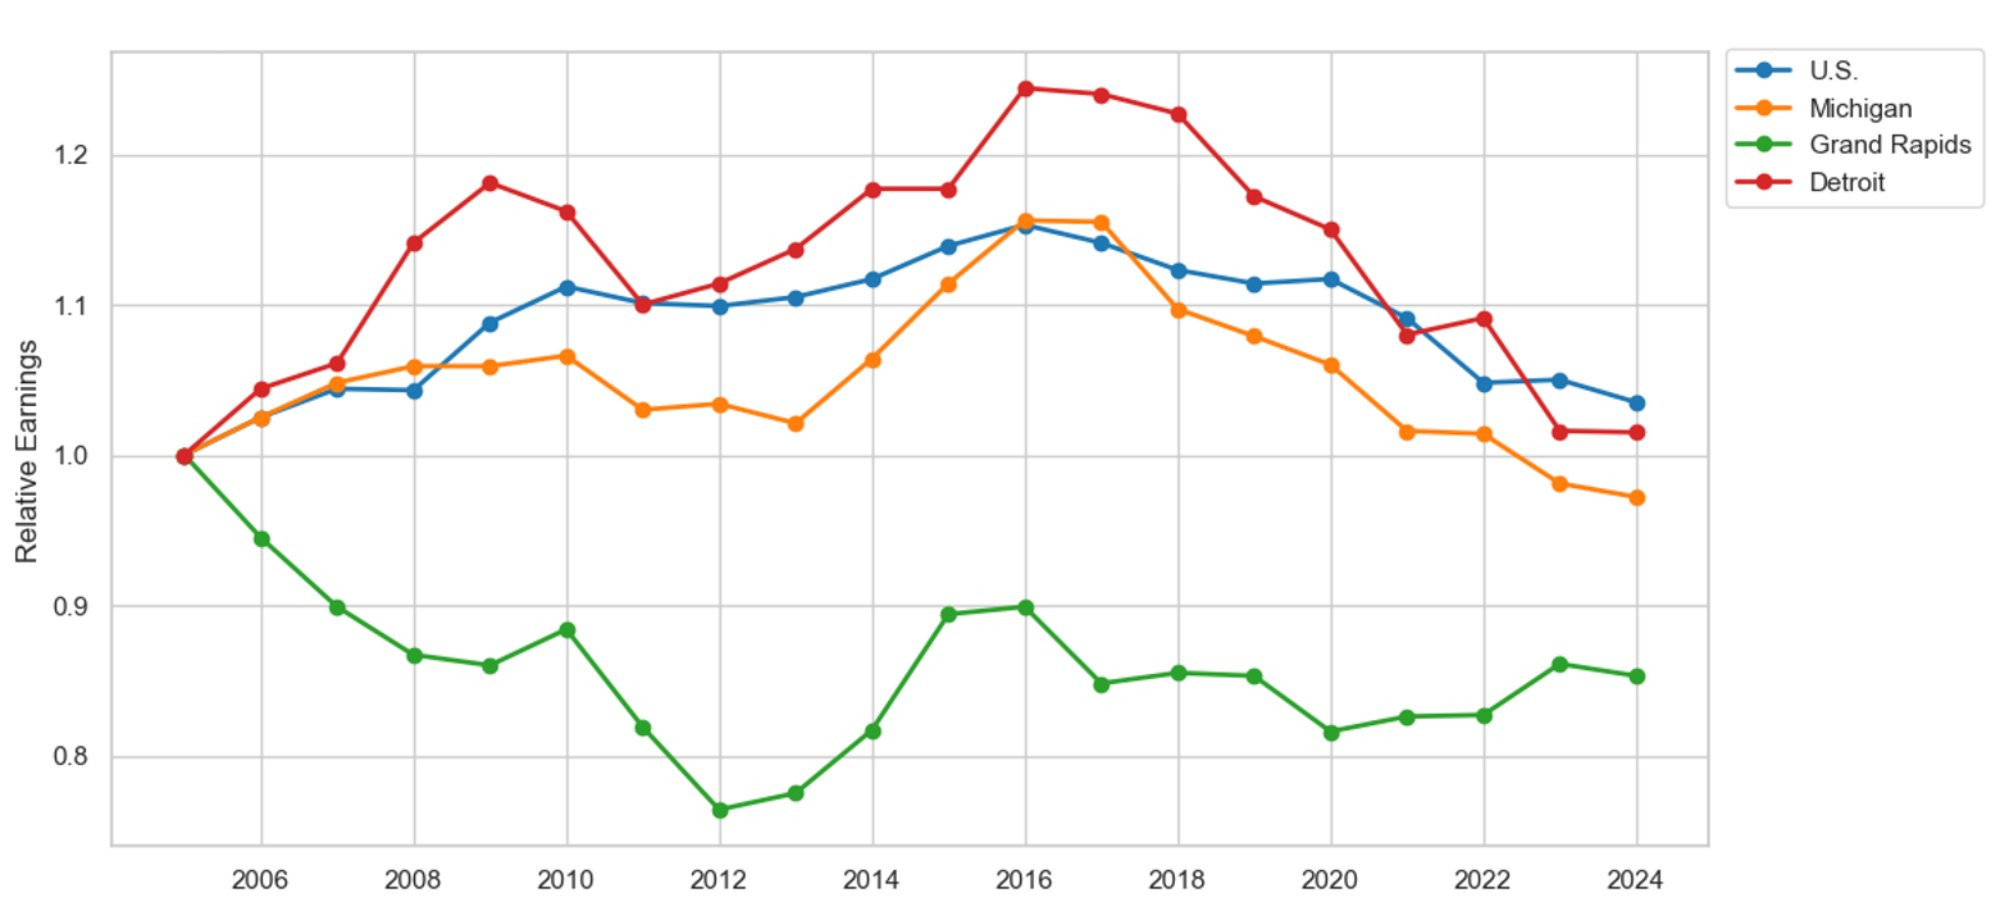
Description: Figure 49 illustrates relative inflation-adjusted earnings among occupational therapists for the U.S., Michigan, Grand Rapids, and Detroit since the start of the Great Recession in 2005. Inflation-adjusted earnings in Grand Rapids were less than the national average during the Great Recession, indicating a below-average recovery in occupational therapist pay. Meanwhile, the inflation-adjusted earnings for Detroit occupational therapists were higher than the national average during the Great Recession, highlighting an above-average recovery in occupational therapist earnings. If the national average sets labor-market earnings expectations, then healthcare providers in Grand Rapids would have found it harder to attract and retain occupational therapists under their pay scheme than Detroit healthcare providers.
Source: U.S. Bureau of Labor Statistics, Michigan Department of Technology, Management, and Budget
Figure 50: Relative Inflation-Adjusted Earnings for Occupational Therapists Since 2019
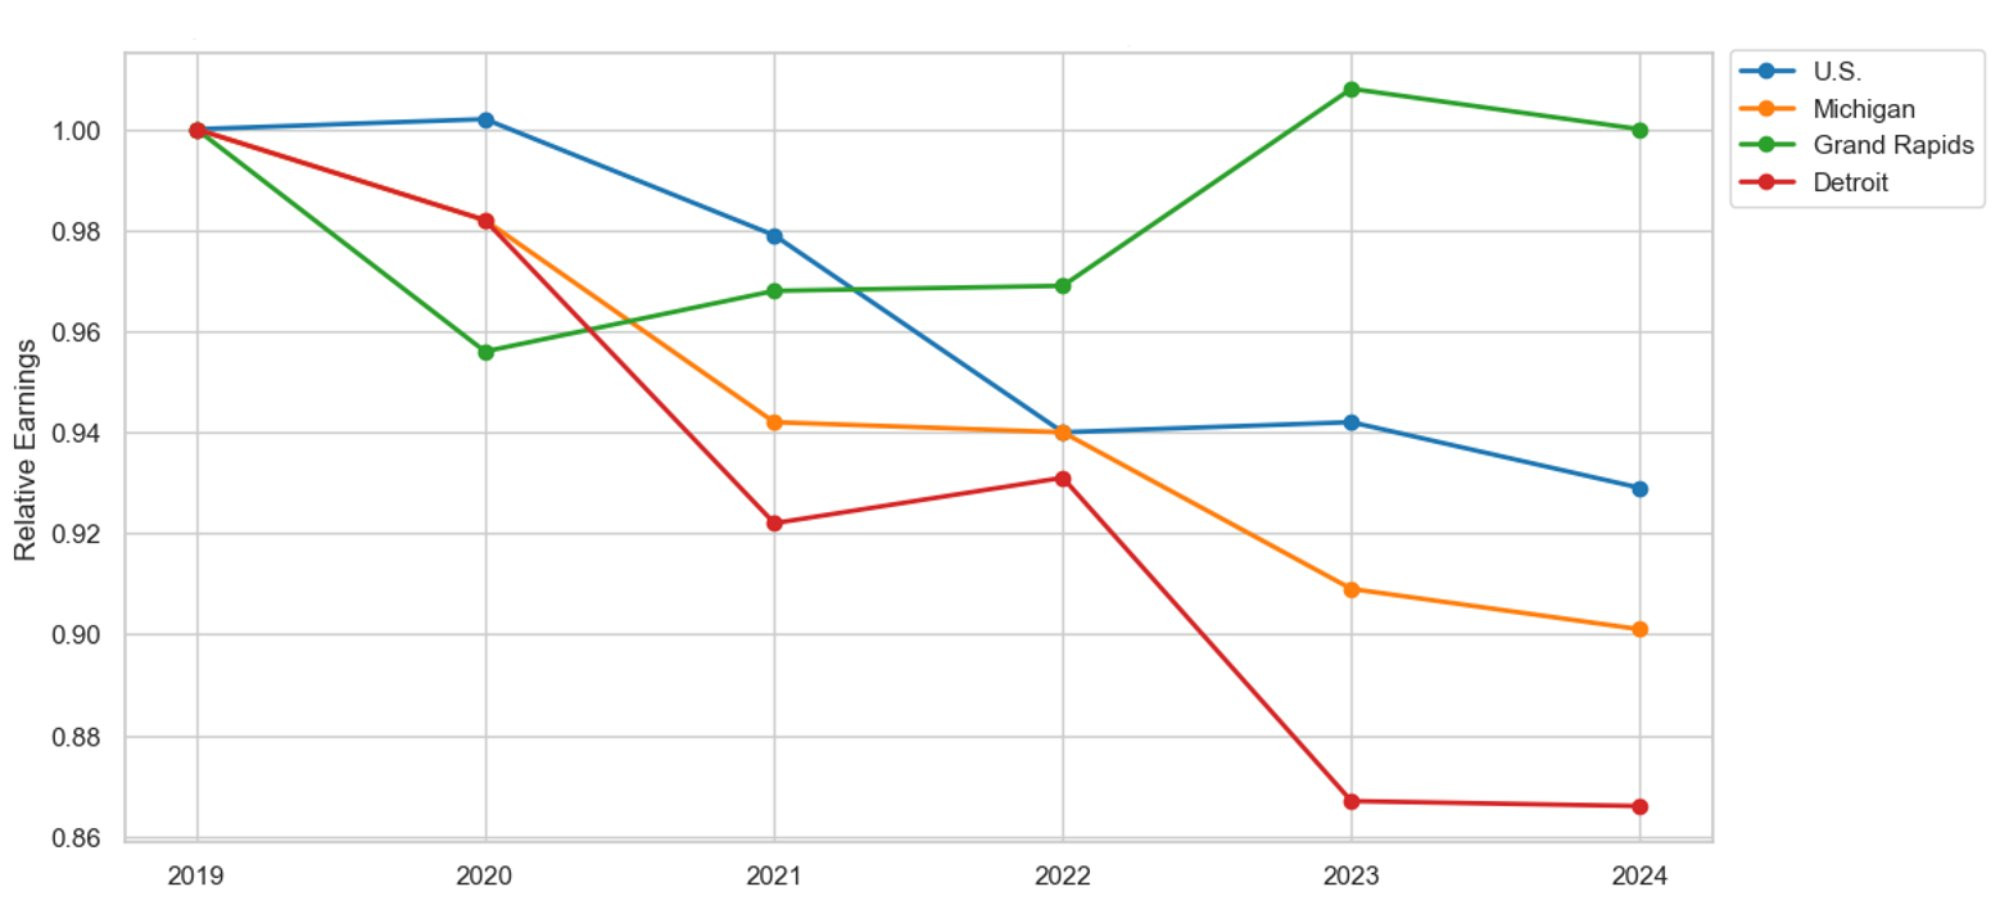
Description: Figure 50 illustrates relative inflation-adjusted earnings among occupational therapists for the U.S., Michigan, Grand Rapids, and Detroit since the start of the COVID-19 pandemic in 2019. Inflation-adjusted earnings in Grand Rapids and Detroit were less than the national average during the pandemic, indicating a below-average recovery in occupational therapist pay. Currently, occupational therapists' pay in Grand Rapids outpaces the national average, but is less than in Detroit. If the national average sets labor-market earnings expectations, then healthcare providers in Grand Rapids and Detroit would have found it harder to attract and retain occupational therapists during the pandemic.
Source: U.S. Bureau of Labor Statistics, Michigan Department of Technology, Management, and Budget
Figure 51 graphs the annual replacement rate for diagnostic medical sonographers stemming from occupational exits and retirements in the U.S., Michigan, Grand Rapids, and Detroit since the onset of the Great Recession in 2005. However, we focus on the COVID-19 pandemic period to examine the recent shortage of sonographers. On average, replacement rates nationwide are three times those in Grand Rapids and Detroit from 2019 to 2024. Suppose replacements serve as a measure of a healthcare provider's ability to retain existing talent. In that case, the shortage of sonographers observed in Grand Rapids and Detroit is smaller than the national shortage.
Figure 51: Annual Job Replacement Rate for Diagnostic Medical Sonographers
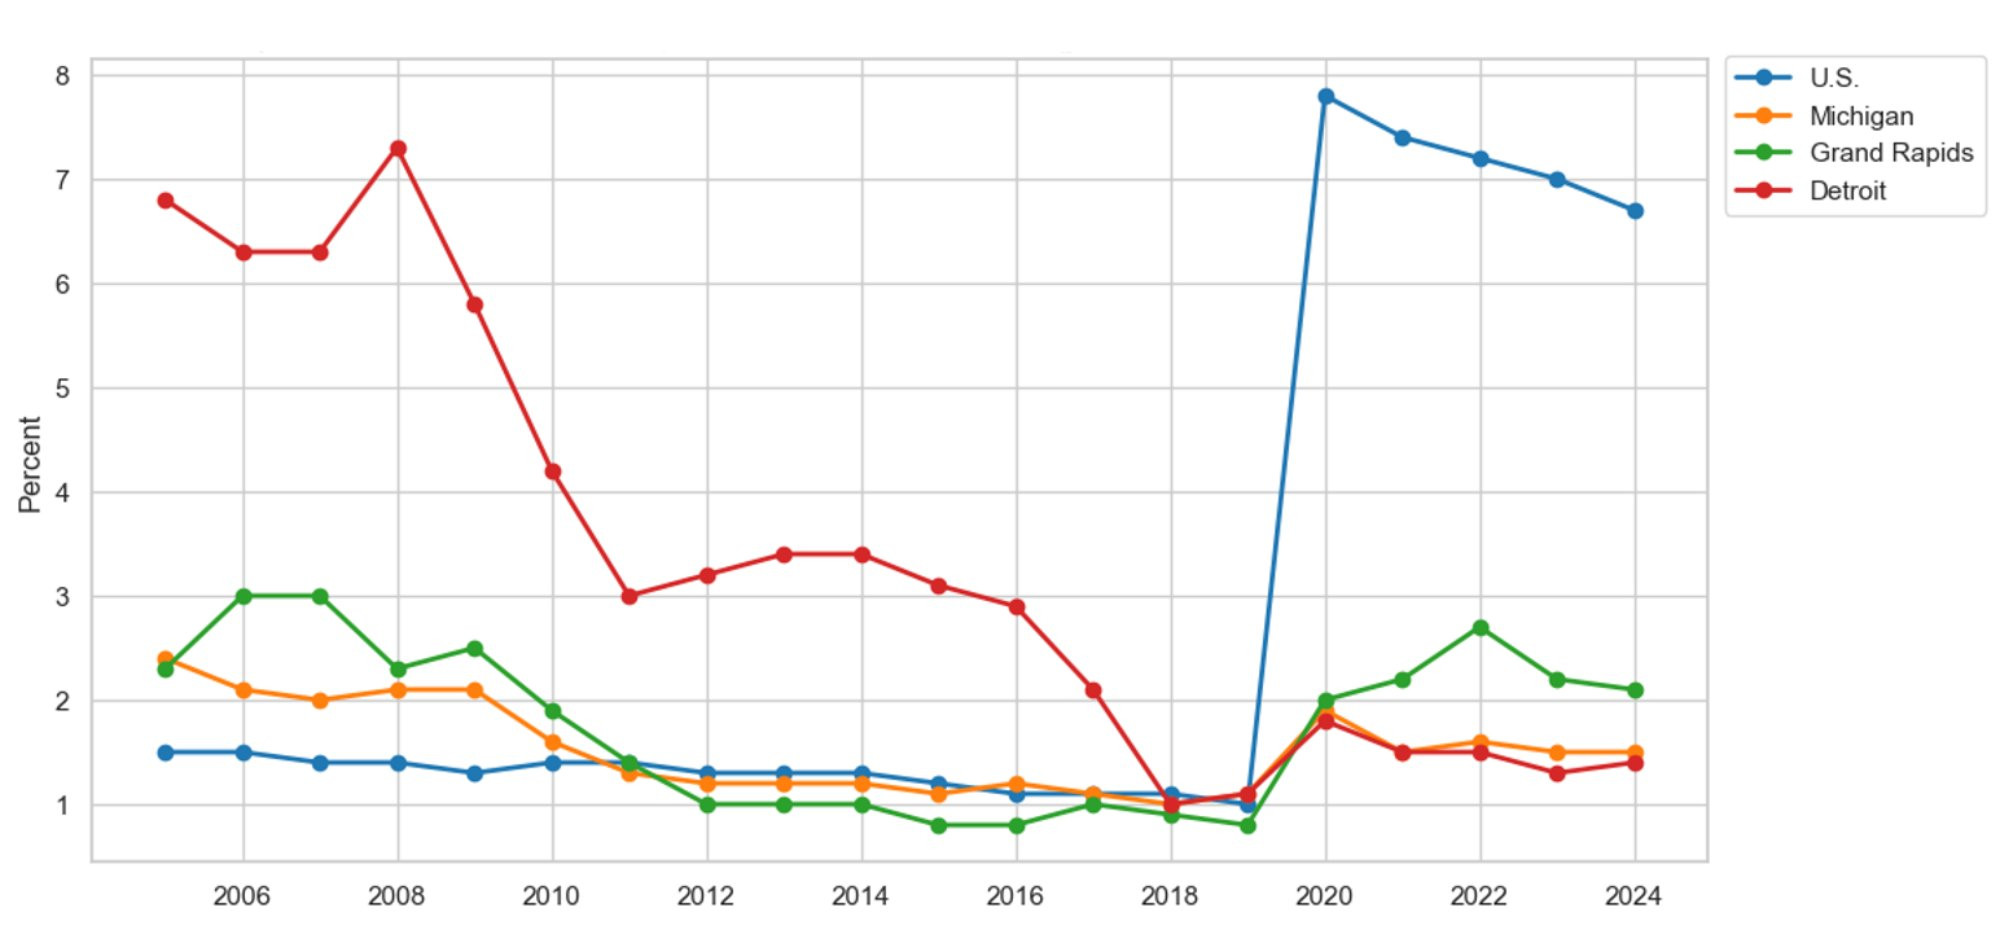
Description: Figure 51 shows the yearly replacement rate of diagnostic medical sonographers due to occupational exits and retirements for the U.S., Michigan, Grand Rapids, and Detroit since 2005. The data reveal that during the Great Recession, which began in 2007, annual diagnostic medical sonographer replacements due to exits and retirements were higher than the national average in Grand Rapids and Detroit. Meanwhile, during the COVID-19 pandemic beginning in 2020, replacement of diagnostic medical sonographers in Grand Rapids and Detroit did not keep pace with the national average. Suppose annual replacements are used as an indicator of diagnostic medical sonographer shortages. In that case, the shortage in Grand Rapids and Detroit appears to be significantly lower than the national average.
Source: U.S. Bureau of Labor Statistics, Michigan Department of Technology, Management, and Budget
Figure 52 presents the annual new job growth rates for diagnostic medical sonographers in the U.S., Michigan, Grand Rapids, and Detroit since the beginning of the Great Recession in 2005. Again, we focus on the data spanning 2019 to 2024 to comment on the recent labor shortage. On average, healthcare providers in Grand Rapids are better able to attract new talent than the average U.S. healthcare provider. In comparison, Detroit-based healthcare providers lag the national average. Suppose new job growth serves as a measure of a healthcare provider's ability to attract new talent. In that case, the shortage of sonographers observed in Grand Rapids is smaller than the national shortage, but it is larger in Detroit.
Figure 52: Annual New Job Growth for Diagnostic Medical Sonographers
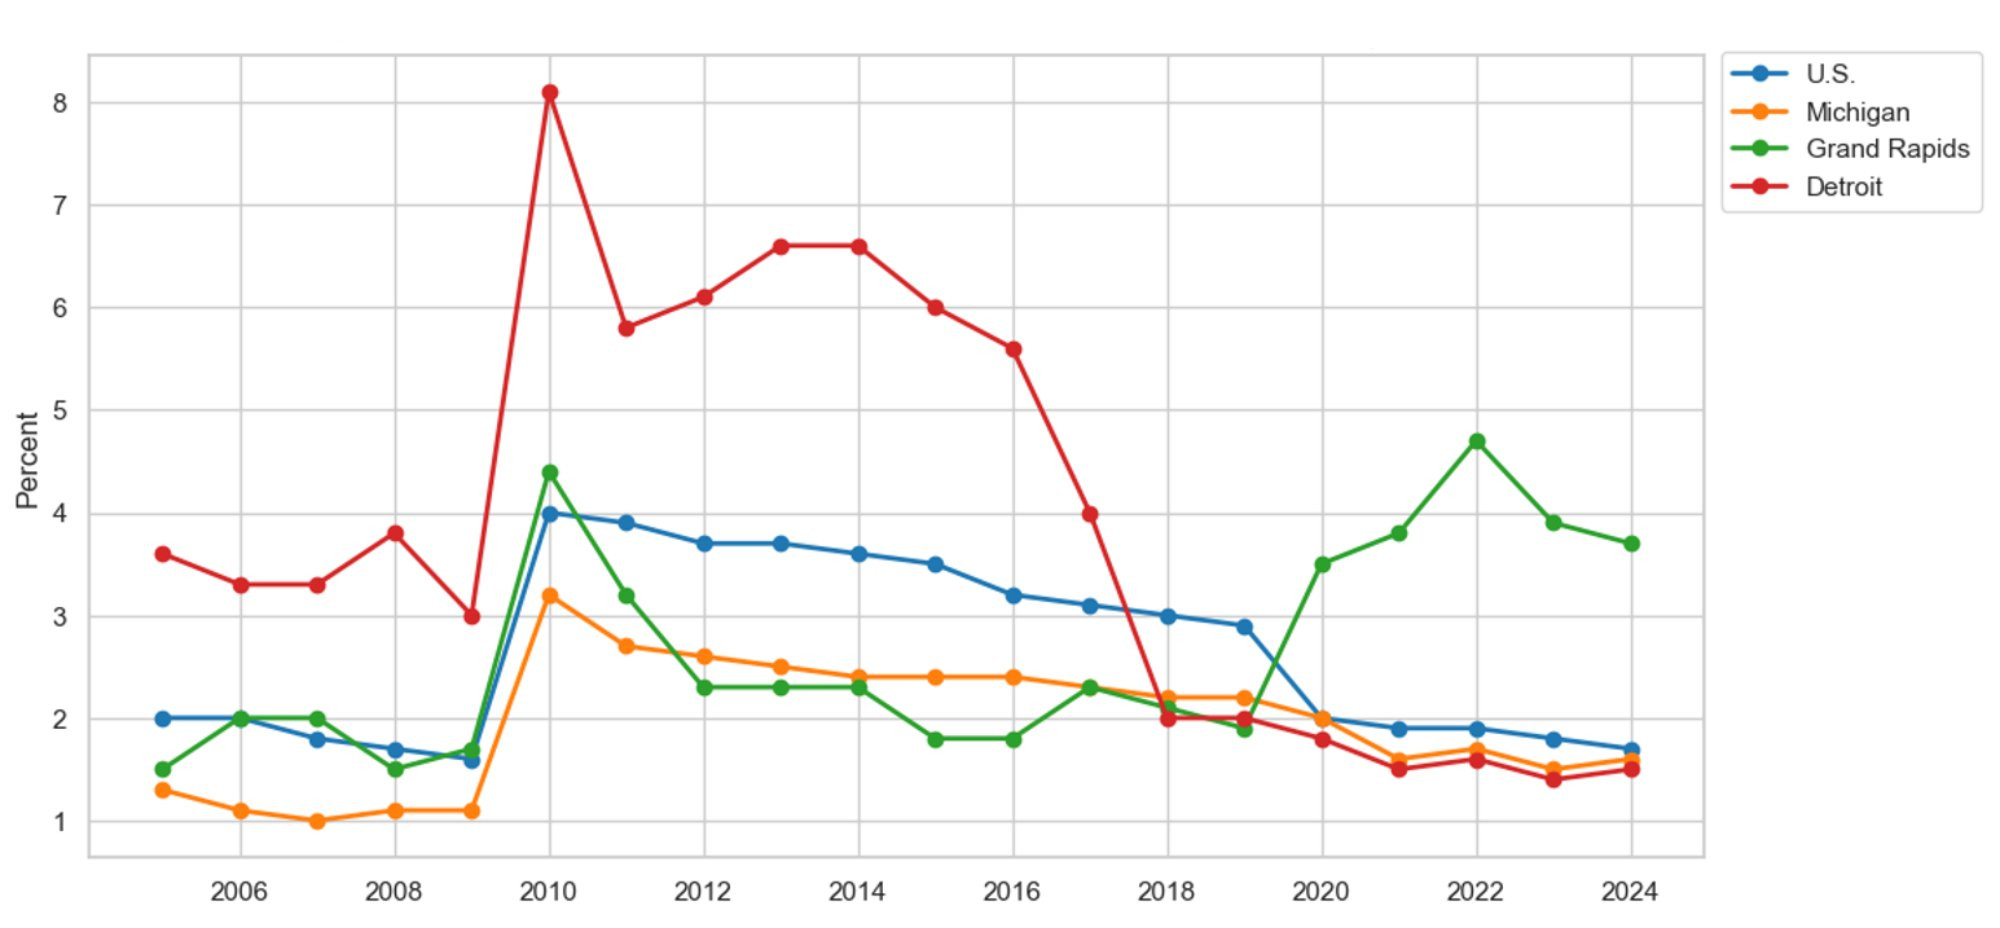
Description: Figure 52 shows the yearly new job growth rate of diagnostic medical sonographers for the U.S., Michigan, Grand Rapids, and Detroit since 2005. The data reveal that during the Great Recession, which began in 2007, annual new job growth for diagnostic medical sonographers was comparable to the national average in Grand Rapids and higher in Detroit. Meanwhile, during the COVID-19 pandemic, new job growth for diagnostic medical sonographers in Grand Rapids was higher than the national average, but lower in Detroit. If new job growth is used as an indicator of diagnostic medical sonographer shortages, shortages in Grand Rapids are smaller than the national average, but larger in Detroit.
Source: U.S. Bureau of Labor Statistics, Michigan Department of Technology, Management, and Budget
Figures 53 and 54 highlight the evolution in the relative inflation-adjusted earnings of diagnostic medical sonographers in the U.S., Michigan, Grand Rapids, and Detroit since the start of the Great Recession in 2005 and the COVID-19 pandemic in 2019. During the Great Recession, between 2007 and 2009, the inflation-adjusted earnings for sonographers increased in the U.S. and Grand Rapids. In other words, the average sonographer was unaffected by the Great Recession. Meanwhile, the real wages of sonographers in Detroit decreased sharply during the Great Recession and have yet to return to their pre-recession levels. A similar story emerges from COVID-19 pandemic-era data from 2019 to 2024. Sonographer pay in Grand Rapids increased during the pandemic, but decreased in Detroit. Taking Figures 51 through 54 together, we find that healthcare providers in Grand Rapids are better able to attract and retain diagnostic medical sonographers, which may be attributed to higher inflation-adjusted earnings that exceed the national average. Meanwhile, Detroit-based healthcare providers can retain existing sonographers at lower pay, but that lower pay may explain why they cannot find new talent.
Figure 53: Relative Inflation-Adjusted Earnings for Diagnostic Medical Sonographers Since 2005
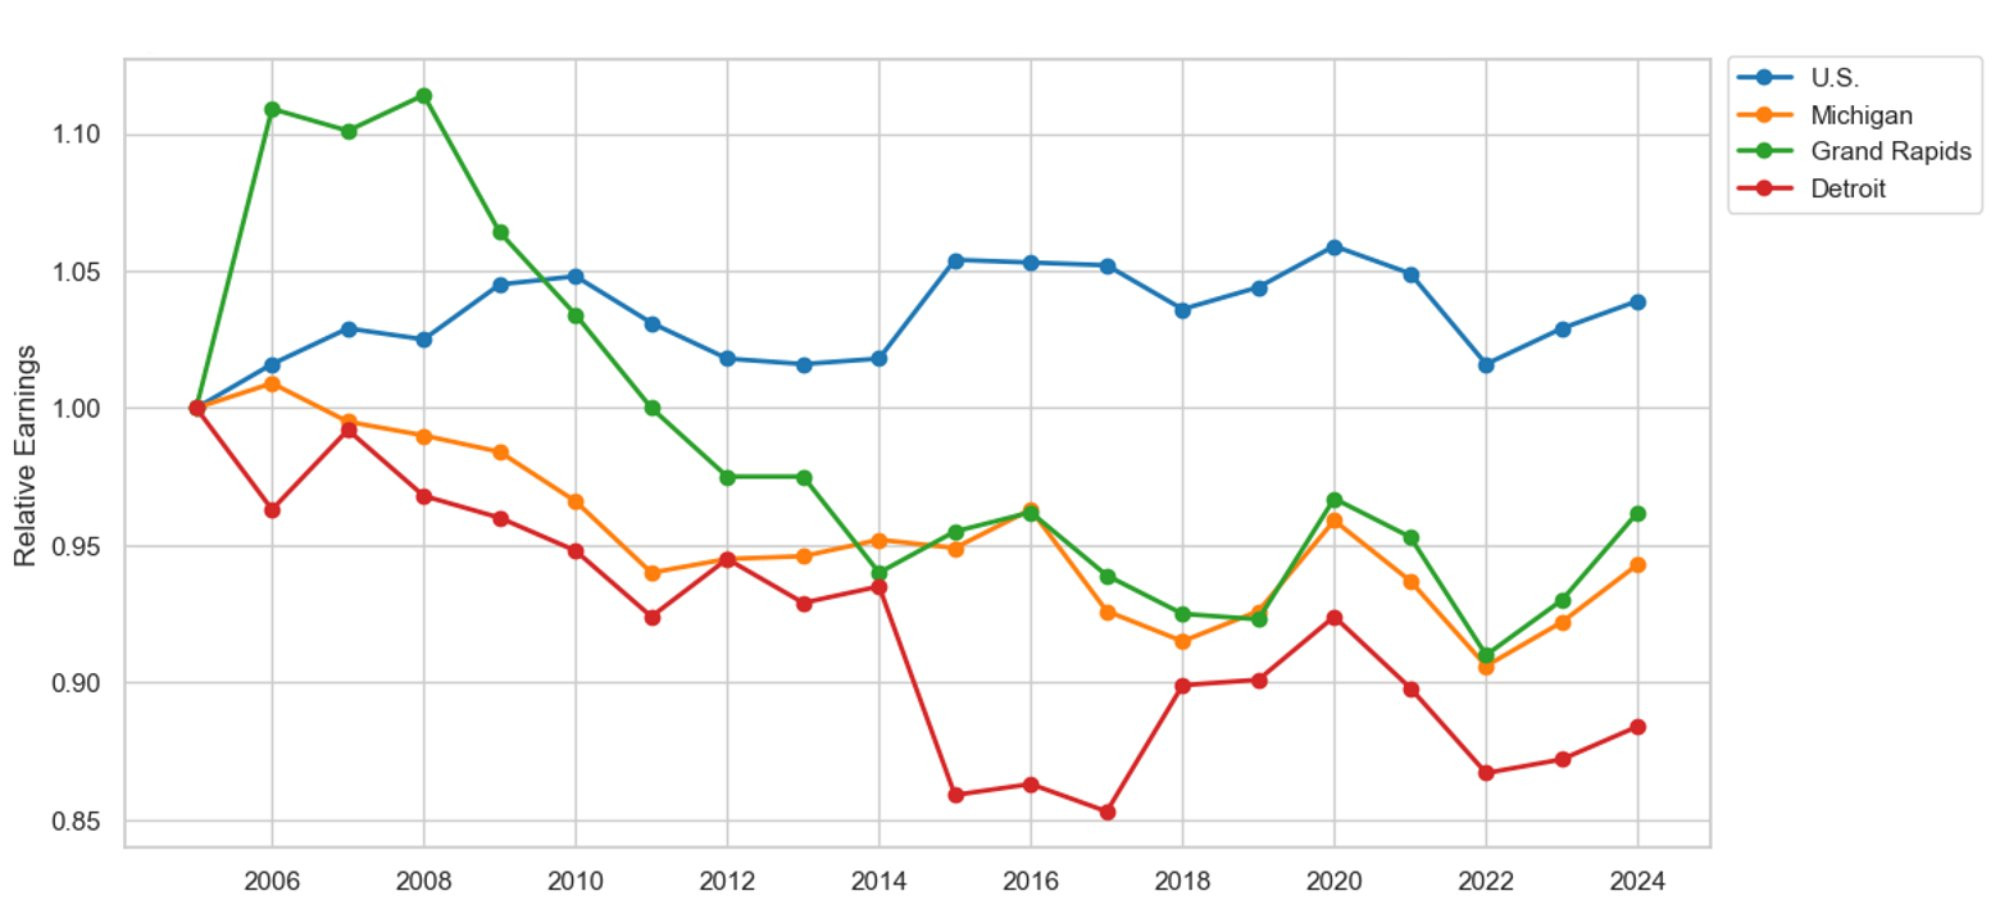
Description: Figure 53 illustrates relative inflation-adjusted earnings among diagnostic medical sonographers for the U.S., Michigan, Grand Rapids, and Detroit since the start of the Great Recession in 2005. Inflation-adjusted earnings in Grand Rapids were higher than the national average during the Great Recession, indicating an above-average recovery in diagnostic medical sonographer pay. Meanwhile, inflation-adjusted earnings for Detroit diagnostic medical sonographers were lower than the national average during the Great Recession, highlighting a below-average recovery. If the national average sets labor-market earnings expectations, then healthcare providers in Grand Rapids would have found it easier to attract and retain diagnostic medical sonographers under their pay scheme than Detroit healthcare providers.
Source: U.S. Bureau of Labor Statistics, Michigan Department of Technology, Management, and Budget
Figure 54: Relative Inflation-Adjusted Earnings for Diagnostic Medical Sonographers Since 2019
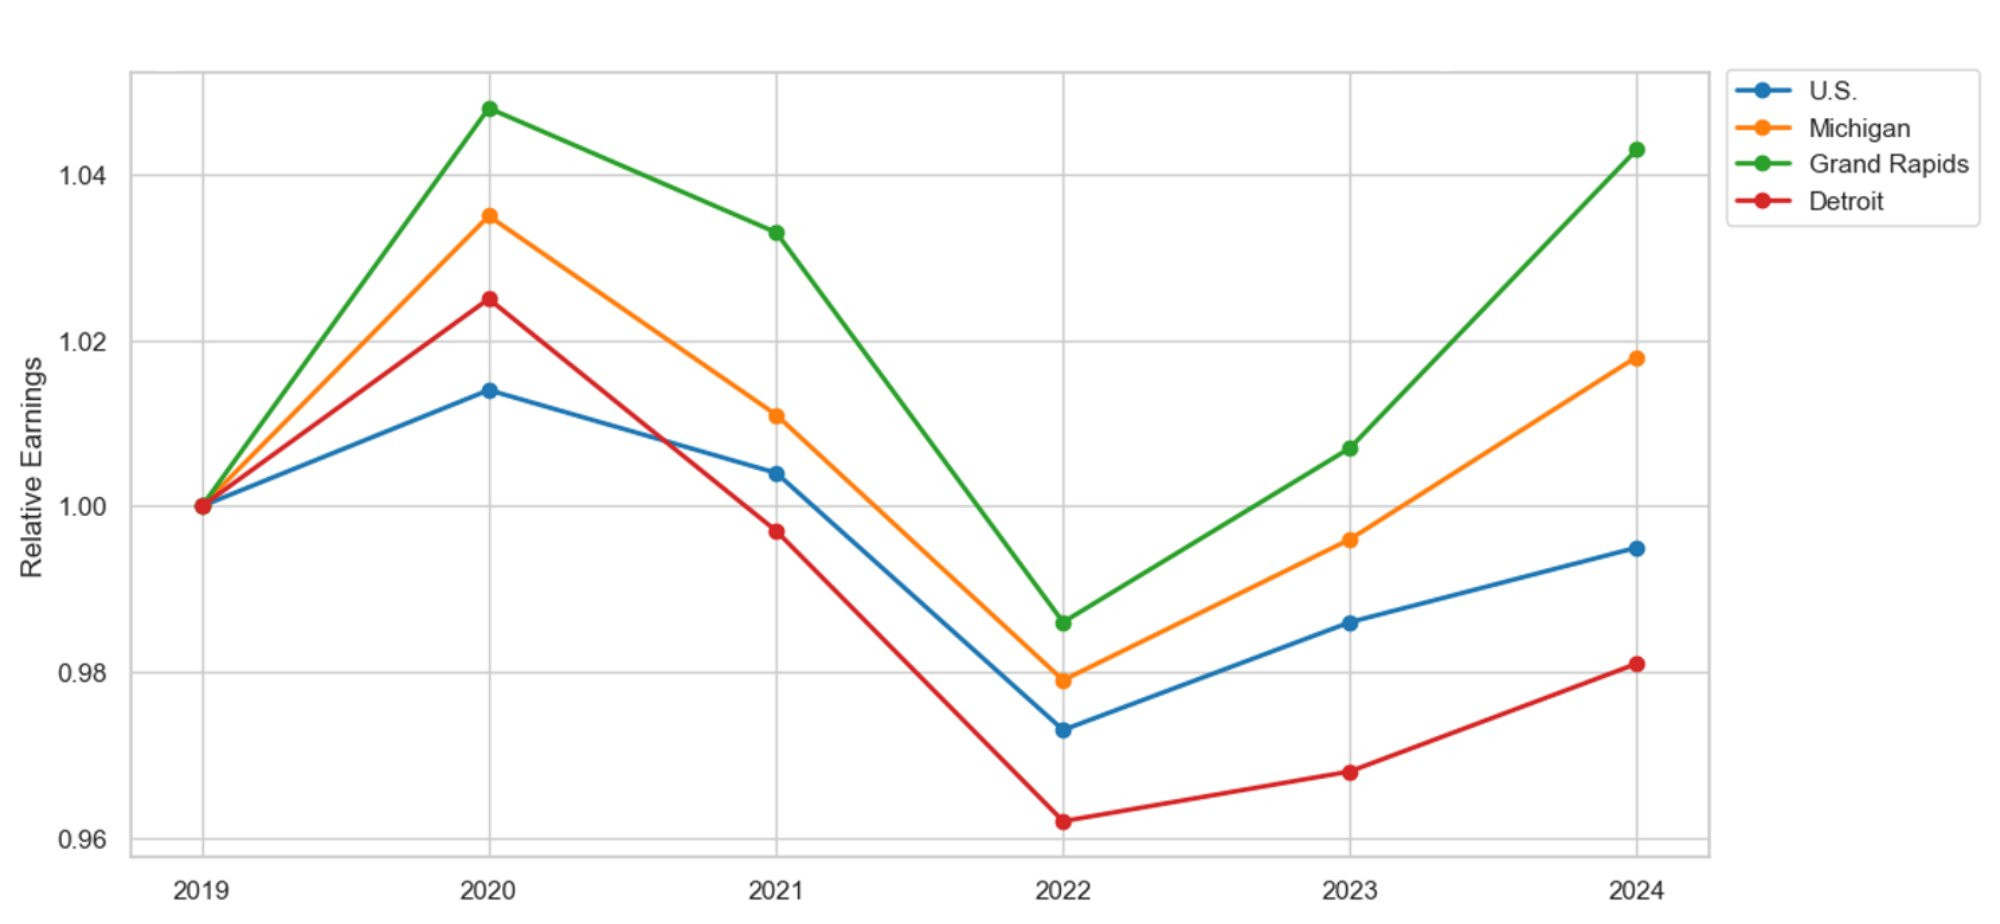
Description: Figure 54 illustrates relative inflation-adjusted earnings among diagnostic medical sonographers for the U.S., Michigan, Grand Rapids, and Detroit since the start of the COVID-19 pandemic in 2019. Inflation-adjusted earnings in Grand Rapids and Detroit were higher than the national average during the pandemic, indicating an above-average recovery in diagnostic medical sonographer pay. Currently, inflation-adjusted earnings for Detroit diagnostic medical sonographers are below the national average. If the national average sets labor-market earnings expectations, then healthcare providers in Grand Rapids and Detroit would have found it easier to attract and retain diagnostic medical sonographers during the pandemic.
Source: U.S. Bureau of Labor Statistics, Michigan Department of Technology, Management, and Budget
In summary, we use annual replacement rates to measure a firm's ability to retain existing employees, new job growth to proxy for a firm’s ability to attract new workers, and relative inflation-adjusted earnings metrics as the catalysts for attracting and retaining workers. On average, we find that healthcare labor shortages in Grand Rapids and Detroit are less severe than those nationwide. That is, healthcare providers in Grand Rapids and Detroit are better able to attract and retain hospital personnel than the average U.S. healthcare provider, despite below-average inflation-adjusted earnings growth. On the one hand, this finding suggests more bang for the buck, cost savings in labor, and the ability to attract and retain labor. However, if earnings expectations are set in line with the more widely reported national data and healthcare providers in East and West Michigan are not keeping pace. These providers should remain cautious moving forward, as the labor shortage will not abate for many healthcare professions. Lastly, we turn to education trends to say something about future labor supply.
Education
Using national, state, and local-level data from the National Student Clearinghouse and Grand Valley State University, we examine undergraduate enrollment relevant to pursuing a future career in healthcare. We have found that enrollment in many health colleges is increasing both nationally and locally. However, the ability to address future healthcare needs is ambiguous for some healthcare occupations. For example, to address the shortage of nurses, we examine university enrollment in nursing programs at both the national and local levels. We found that enrollment in U.S. nursing programs decreased by 0.6% since the onset of the COVID-19 pandemic in 2019. These results indicate that the recent nursing shortage may persist. Meanwhile, when we analyze undergraduate enrollment data at Grand Valley State University (GVSU), we find a 25.2 percent increase in nursing enrollment since 2019, suggesting that help is on the way to address the current nursing shortage in West Michigan.
Figure 55: Undergraduate Enrollment Relative to 2019
Description: Figure 53 presents undergraduate enrollment numbers in the U.S., Michigan, and West Michigan relative to the onset of the COVID-19 pandemic. Results highlight an increase in enrollment in degrees, including U.S. Health Professions, Health Sciences, Administrative Services, Public Health, and Graduate School Preparatory. Additionally, we observe a significant increase in nursing programs in West Michigan.
Source: National Student Clearinghouse, Grand Valley State University
To study the shortage of PAs, we turn to university enrollment in U.S. Colleges of Health Professions, specifically in Michigan and West Michigan. Again, we return conflicting results. For example, U.S. enrollment in health professions increased by 2.9 percent since 2019. Yet, enrollment in health professions at Michigan universities has decreased by 15.5% during the same period. Additionally, enrollment in health professions at GVSU decreased by 14.8 percent since the onset of the COVID-19 pandemic. Addressing the local, state, and nationwide healthcare shortages is a significant policy concern, particularly given that our population is growing and aging.
References
Burger, C. (2025). The States with the Largest Nursing Shortages. Registered Nursing. Retrieved from https://www.registerednursing.org/articles/largest-nursing-shortages/
Robinson, C. (2025). The U.S. Nursing Shortage: A State-by-State Breakdown. Nurse Journal. Retrieved from https://nursejournal.org/articles/the-us-nursing-shortage-state-by-state-breakdown/

Cody Kirby, Ph.D., Visiting Faculty, Department of Economics