Health Care Overview
By Cody Kirby, Ph.D., Visiting Faculty, Department of Economics, Seidman College of Business, Grand Valley State University
This section analyzes the prevalence rates of various diseases, including lung and heart conditions, diabetes, kidney disease, and mental health diagnoses. To understand trends in our major diseases, we examine each disease's contributing factors, including smoking, air pollution, obesity, physical health, and alcohol consumption. Lastly, we analyze the economic indicators that inform decisions about seeking care, including healthcare access and cost-of-care metrics. The prevalence metrics studied are demand-side factors that influence healthcare costs and hospital utilization. For example, higher disease prevalence increases healthcare demand, driving higher healthcare costs and greater provider utilization.
Our analysis compares the health outcomes of residents in West Michigan (Kent, Ottawa, Muskegon, and Allegan counties) and East Michigan (Detroit, Macomb, and Wayne counties) by race and gender to explore health disparities within and between these regions. The data we use comes from the Michigan Department of Health and Human Services’ Behavioral Risk Factor Surveillance System (MiBRFSS). The MiBRFSS is a self-reported survey, meaning the actual disease prevalence may differ from the reported prevalence. Additionally, the MiBRFSS includes a data suppression rule that applies when the sample size is fewer than 50 and/or the relative standard error exceeds 30 percent. The data-suppression rule is problematic when stratifying by a demographic characteristic.
Many data transformations are needed prior to analysis. For example, to avoid the data suppression rule, we combine black non-Hispanic, other, multicultural, and Hispanic races into a “non-white” racial group for comparison with white survey respondents. If a value is missing in the dataset, we impute it with the mean. If a missing value occurs at a series' bounds, we impute it using the historical growth rate. Lastly, outliers are detected using z-scores that exceed three standard deviations from the mean. Outliers are also imputed using the mean.
The graphs presented in this section are deliberately chosen to highlight the relevant findings from the most recent available data. Graphs omitted from this section produce no identifiable difference between series or between the regional trends. However, all data and graphs mentioned in this section are available upon request.
Asthma and Chronic Obstructive Pulmonary Disease
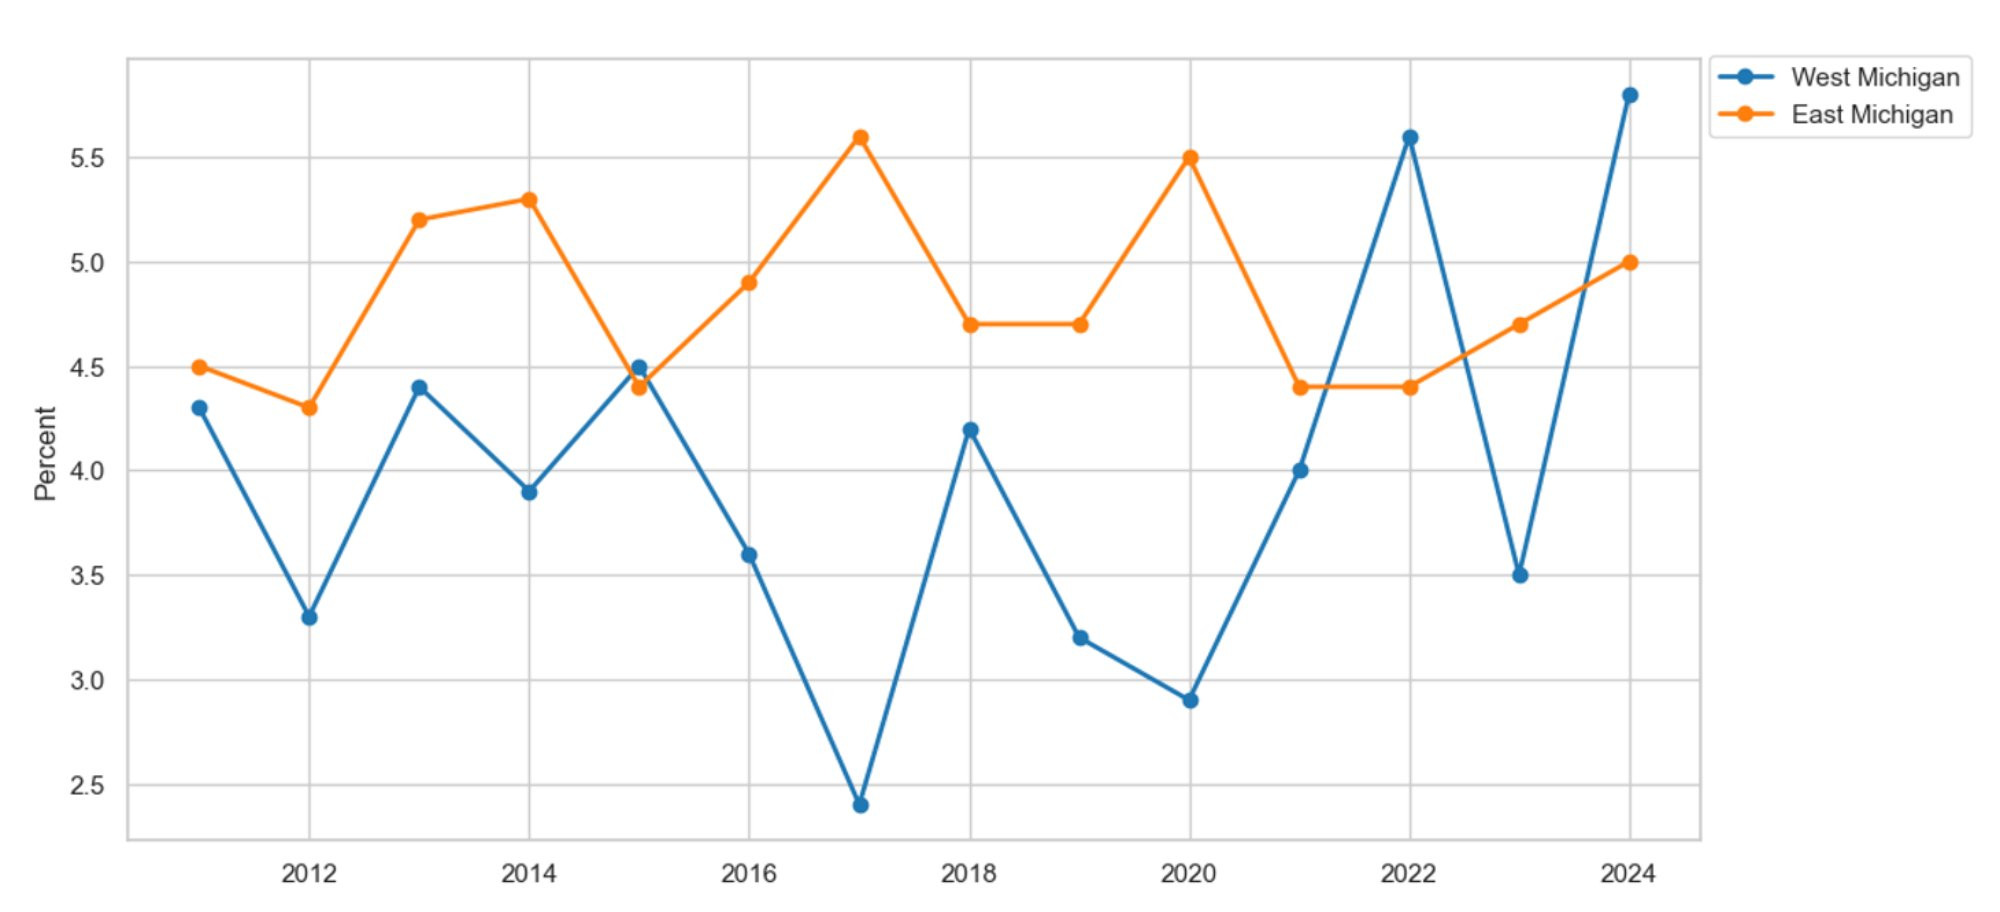
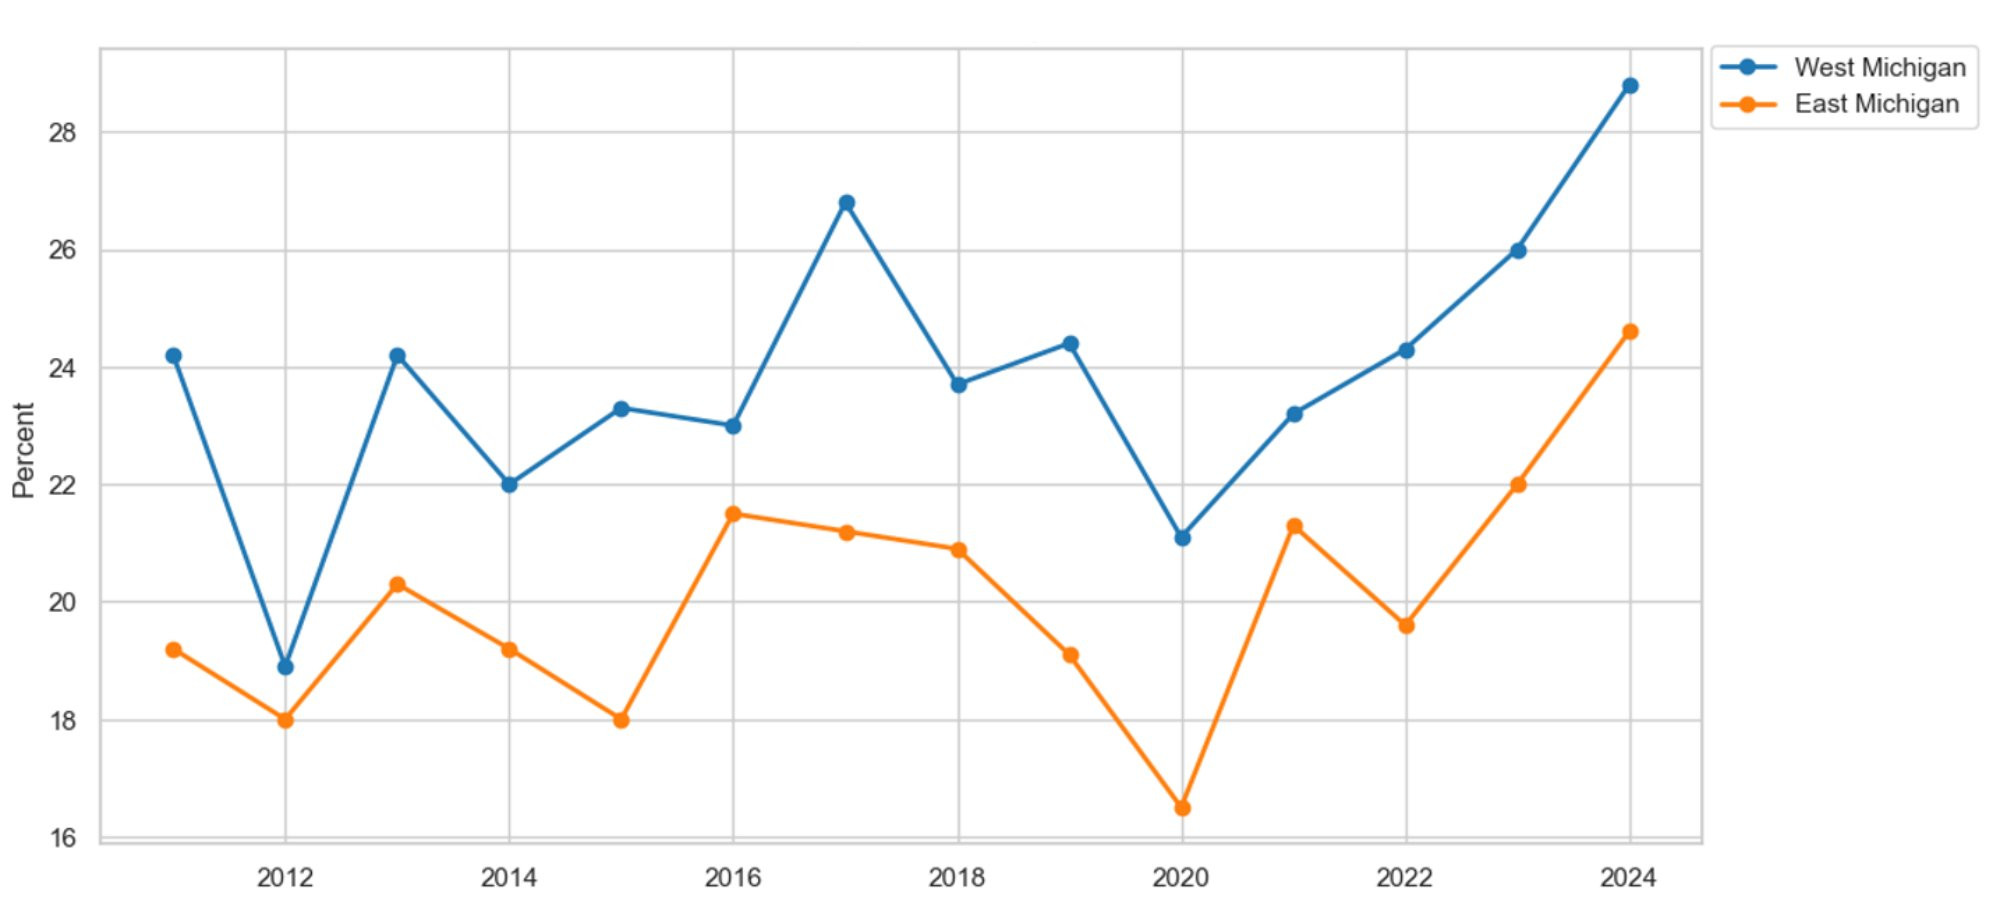
We start our analysis by examining recent trends in common lung conditions, including asthma and chronic obstructive pulmonary disease (COPD), and by exploring their causes, such as smoking, e-cigarette use, and air quality. Figure 1 shows the percentage of survey respondents by region who reported a lifetime asthma diagnosis in the MiBRFSS since 2011. On average, the prevalence of asthma in East Michigan is 1.6 percent higher than in West Michigan. Additionally, both series appear to exhibit a structural break around the COVID-19 pandemic in 2020. For example, prior to the pandemic, the average asthma prevalence in both regions remained relatively stable. Meanwhile, after the onset of the pandemic, both regions experienced an average increase in asthma prevalence of approximately 1.1 percent, with a trend that continues to rise.
Figure 1: Asthma by Region
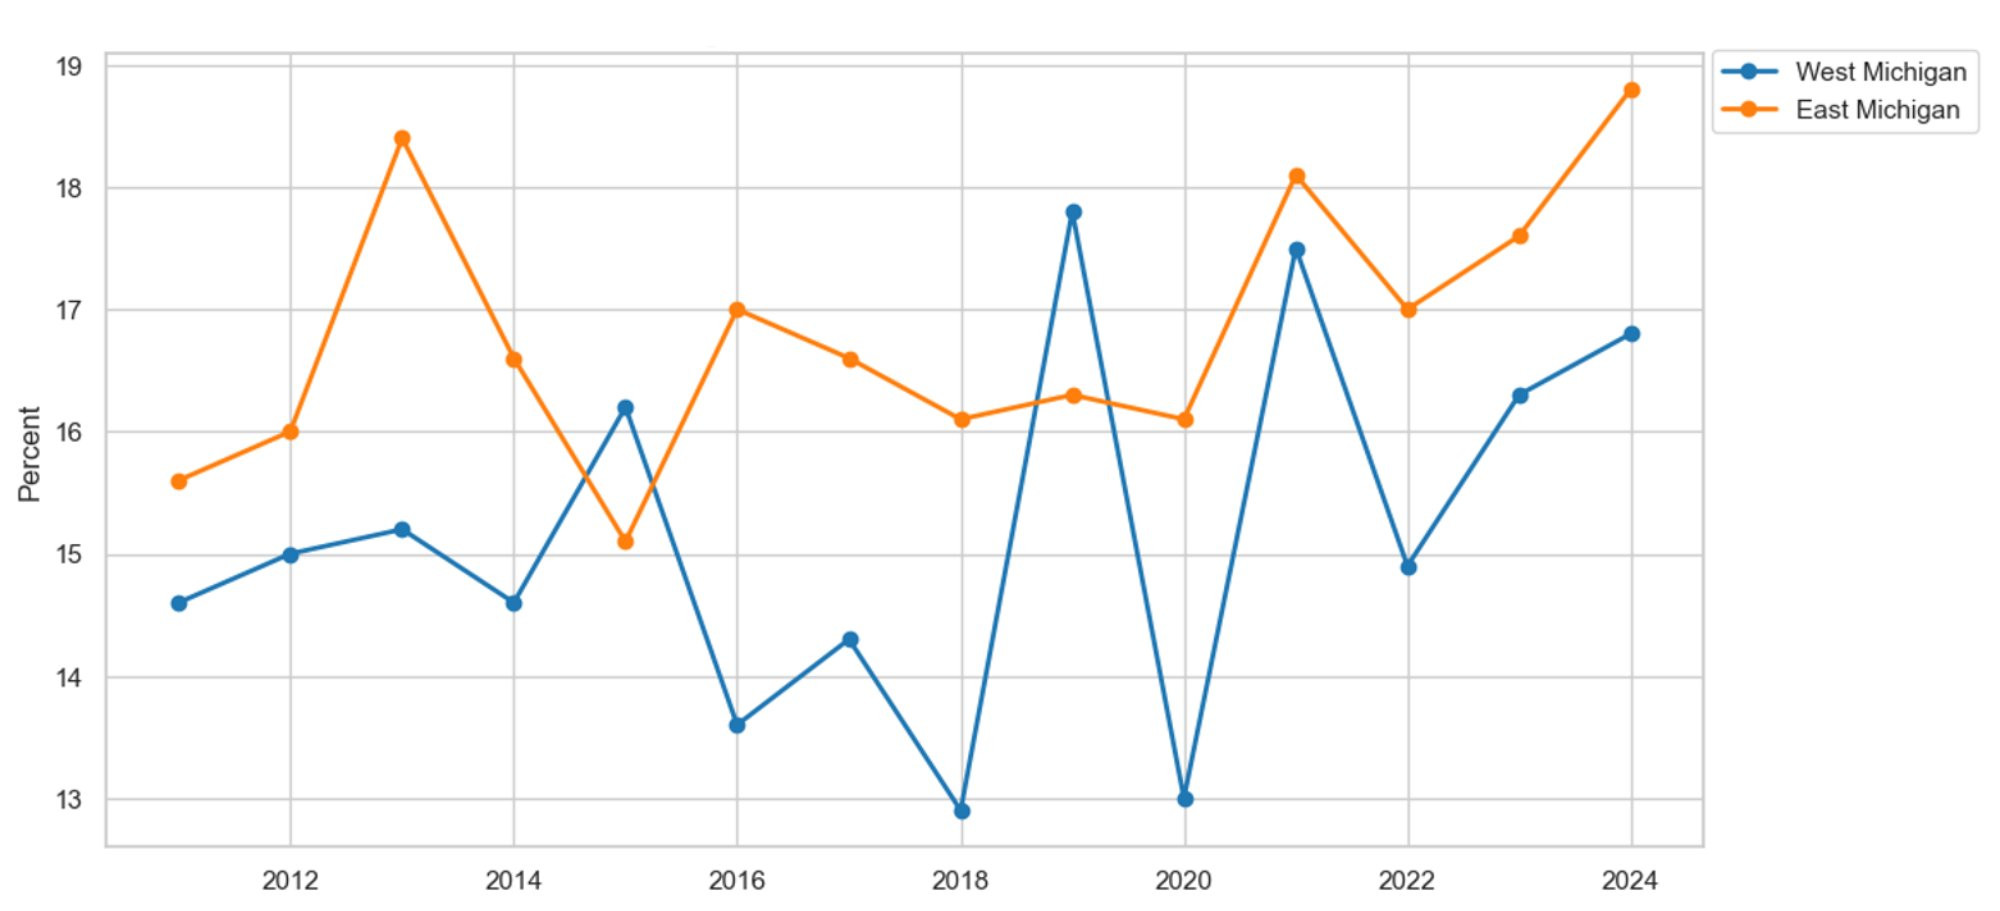
Description: Figure 1 illustrates the percentage of survey respondents reporting lifetime asthma in East and West Michigan. Overall, the percentage of residents reporting asthma is higher in East Michigan compared to West Michigan. Before the COVID-19 pandemic in 2019, asthma levels remained relatively stable in both regions. However, since the start of the pandemic, asthma has been steadily increasing in both areas.
Source: Michigan Department of Health and Human Services, Behavioral Risk Factor Surveillance System, 2011-2024
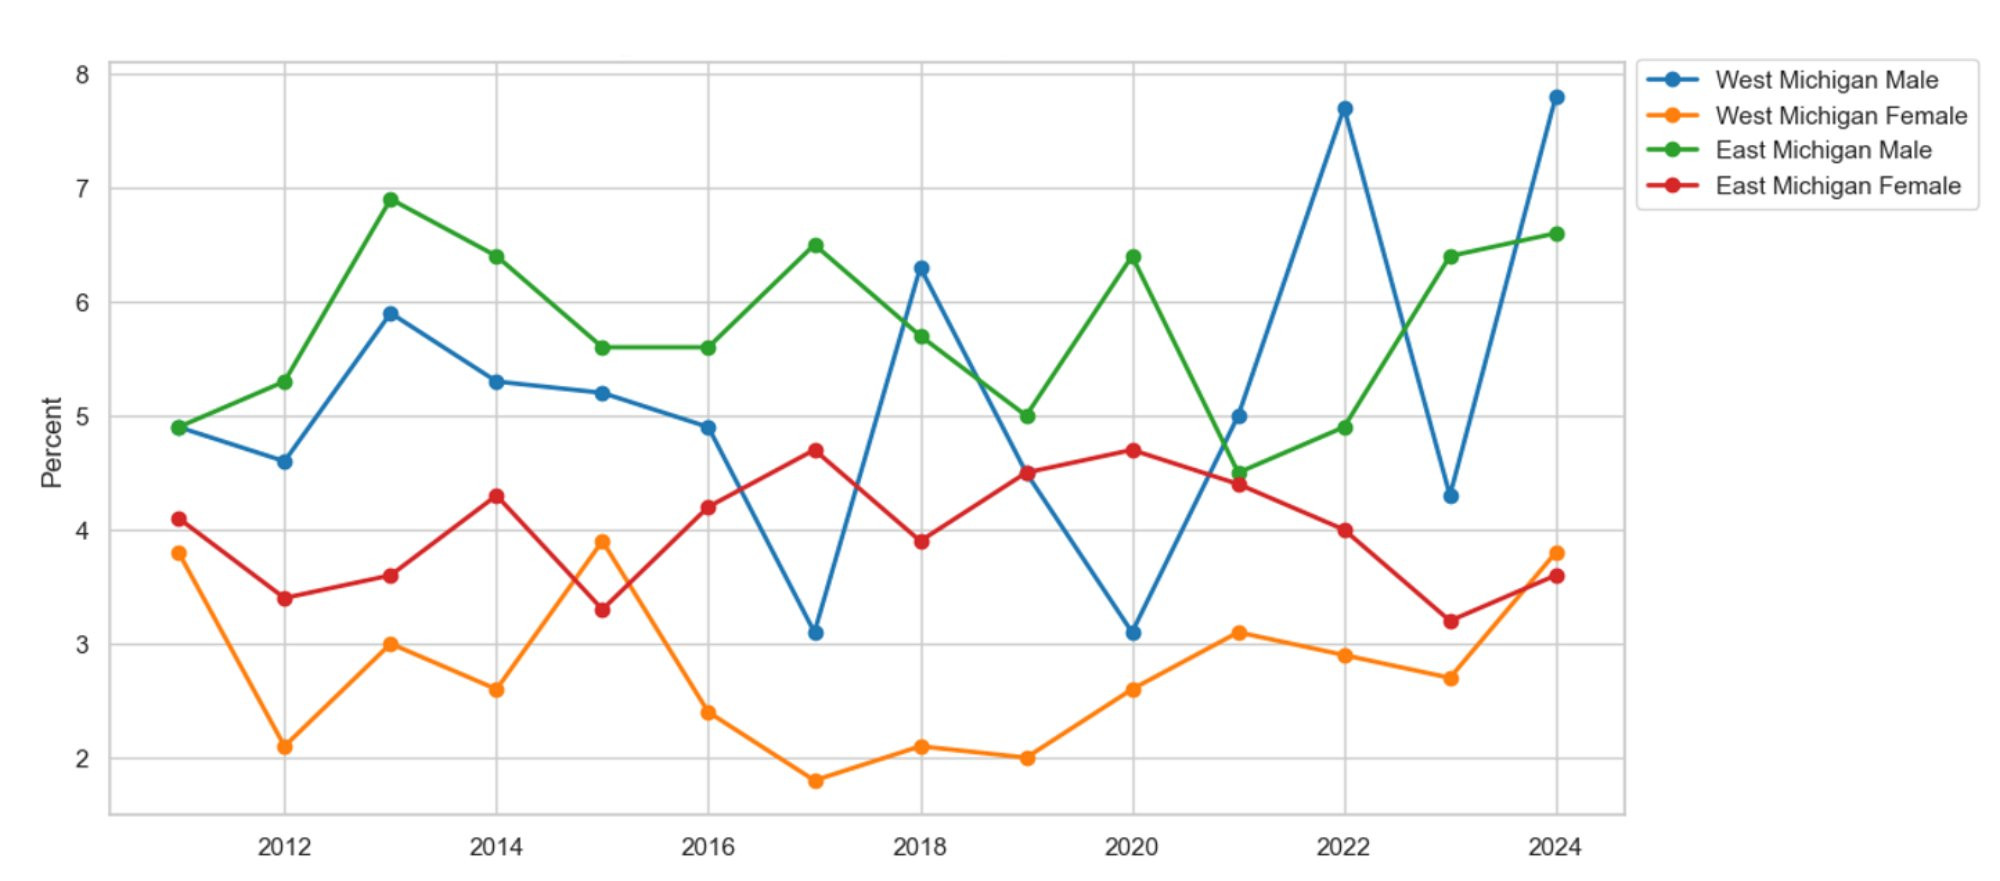
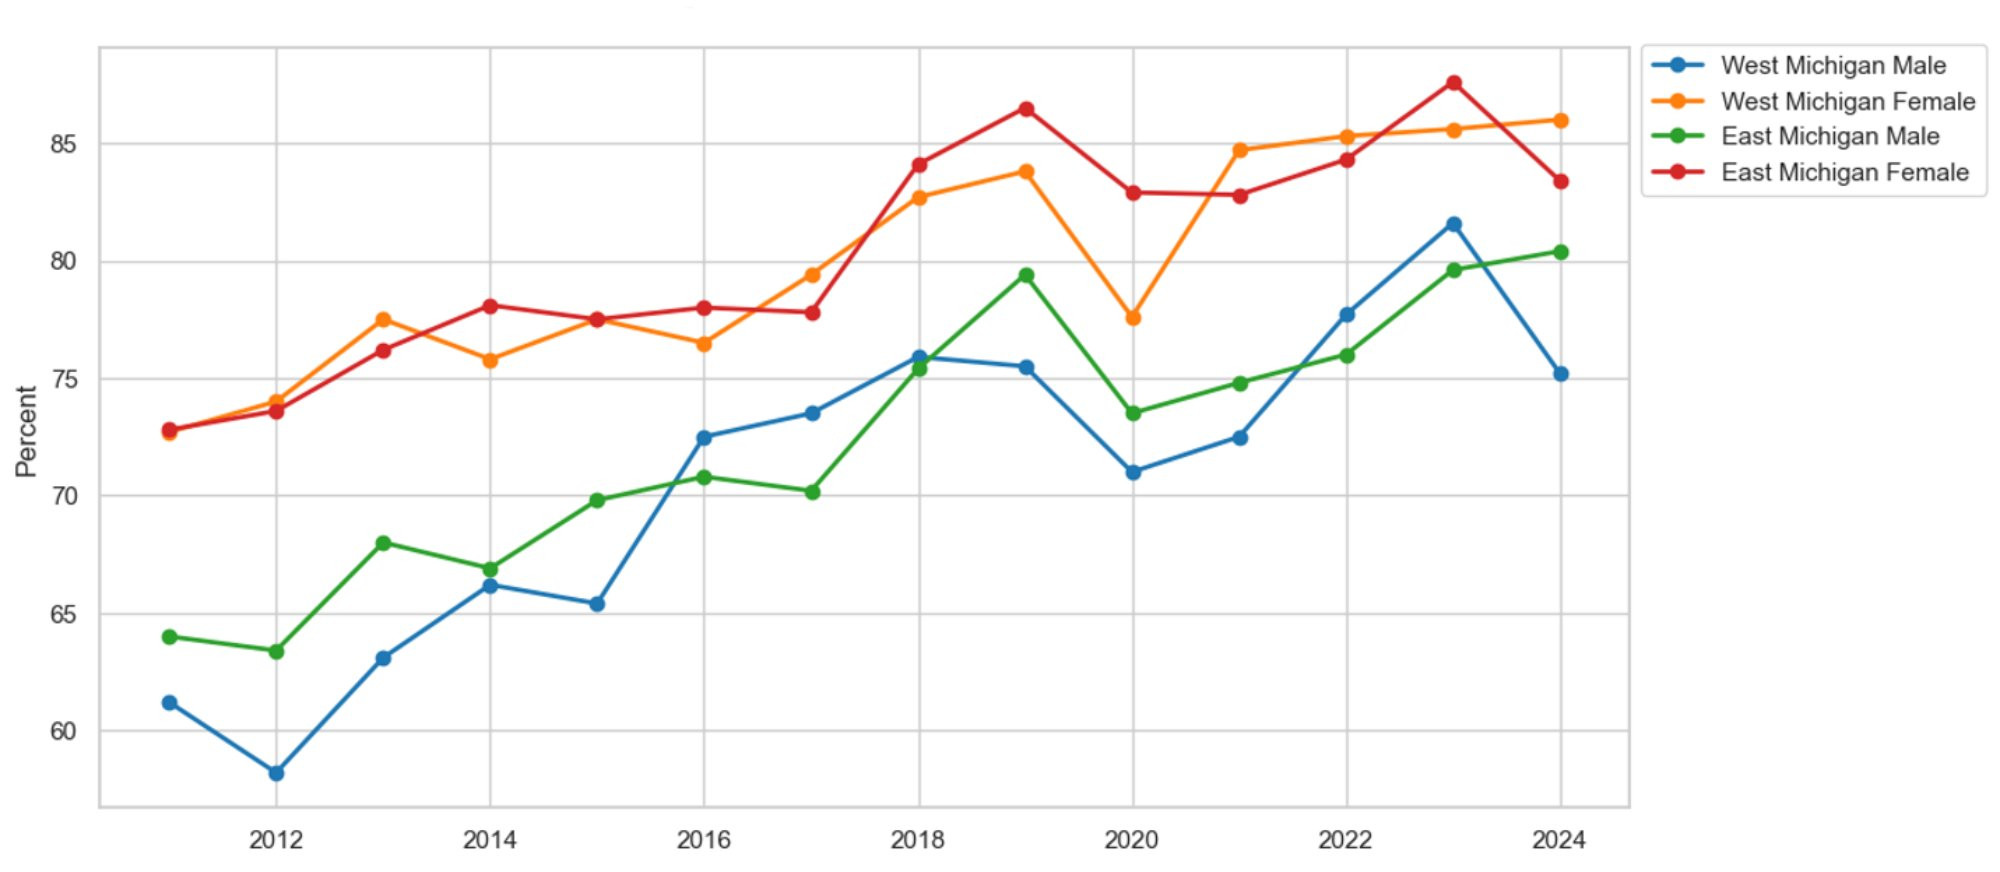
Overall asthma trends fail to account for heterogeneity within and between demographic cohorts. Therefore, we break down asthma prevalence by race and gender. Racial graphs are omitted because no notable difference is apparent between races within each region. As a result, we cannot conclude that one race is disproportionately diagnosed with asthma compared to another in East and West Michigan. Figure 2 presents the prevalence of asthma by gender and region since 2011. On average, females in both regions report more cases of asthma than their male counterparts. For example, females experience asthma at a 4.6 percent and 4.9 percent higher rate than males in East and West Michigan, respectively. While male asthma rates have remained relatively stable since 2011, female rates of asthma have experienced an increasing trend since 2016. For brevity, we omit the graphs on COPD, but note that the trends in COPD mirror those observed in asthma.
Figure 2: Asthma by Gender
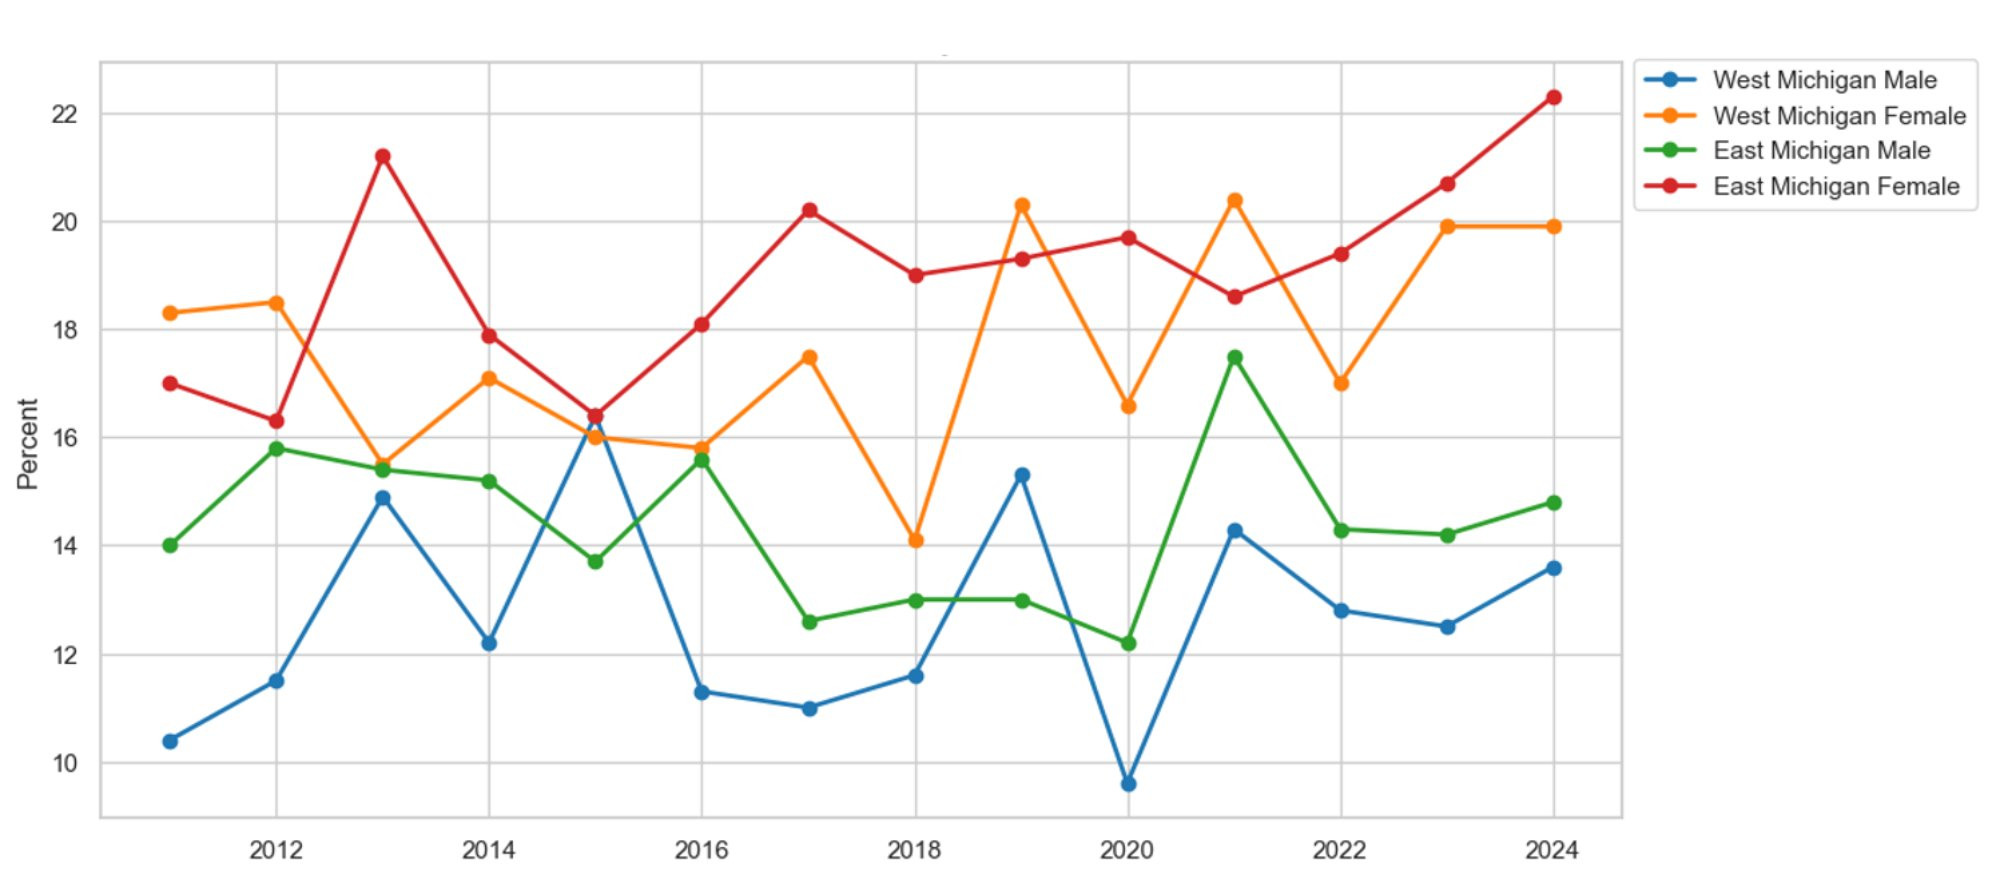
Description: Figure 2 shows the proportion of survey respondents reporting lifetime asthma by gender in East and West Michigan. The graph displays mixed trends by gender and region. On average, East Michigan residents report more cases of asthma regardless of gender. Additionally, women in both East and West Michigan report more cases of asthma compared to men in those areas.
Source: Michigan Department of Health and Human Services, Behavioral Risk Factor Surveillance System, 2011-2024
What is driving the increase in asthma and COPD? While data limitations prevent us from building a causal model in this paper, we study factors that plausibly contribute to increases in lung diseases, including smoking and air pollution. Figure 3 presents the prevalence of survey respondents who currently smoke or use e-cigarettes by region since 2011. The MiBRFSS did not previously track e-cigarette use until 2016. Therefore, in 2016, we added e-cigarette data to our trends on smoking to compare the difference between cigarettes and e-cigarette use. On average, the addition of e-cigarette data produces a smoking series that produces no notable difference in smoking behavior over time. Meanwhile, if the data on e-cigarette use is ignored, smoking prevalence appears to be on the decline. As a result, we attribute these trends in smoking to a substitution occurring between traditional tobacco products and e-cigarettes. When e-cigarette use is included in the smoking data, the decline in traditional smoking is completely nullified by the increase in e-cigarette use. Therefore, the increase in asthma may be partially explained by the persistent trend in smoking.
Figure 3: Smoking and Vaping by Region
Description: Figure 3 shows the proportion of survey respondents who identify as current cigarette smokers or vape users in East and West Michigan. The graph indicates that traditional cigarette use has been decreasing in both East and West Michigan since 2011. However, when vaping data was introduced in 2016, the decline in smoking was offset entirely, making it seem as if there had been no change in smoking. These findings suggest a substitution between traditional cigarette use and vaping.
Source: Michigan Department of Health and Human Services, Behavioral Risk Factor Surveillance System, 2011-2024
Figure 4 graphs air pollution by region using data from the U.S. Environmental Protection Agency (EPA). We define pollution in accordance with the EPA’s traditional measure of air pollution, using particulate matter (PM) with an aerodynamic diameter of 2.5 micrometers, in Grand Rapids and Detroit. Alongside the pollution metrics, we present the EPA’s recommended guideline for a healthy environment: 9 micrograms per cubic meter of air or less (EPA, 2025). On average, air pollution is 0.9 micrograms per cubic meter of air higher in East Michigan than in West Michigan. Additionally, as evidenced by both pollution series, both localities experience many years with pollution estimates exceeding the EPA’s recommended threshold for a healthy populace. Therefore, poor air quality in both regions can plausibly explain the increase in asthma prevalence.
Figure 4: Air Pollution by Region
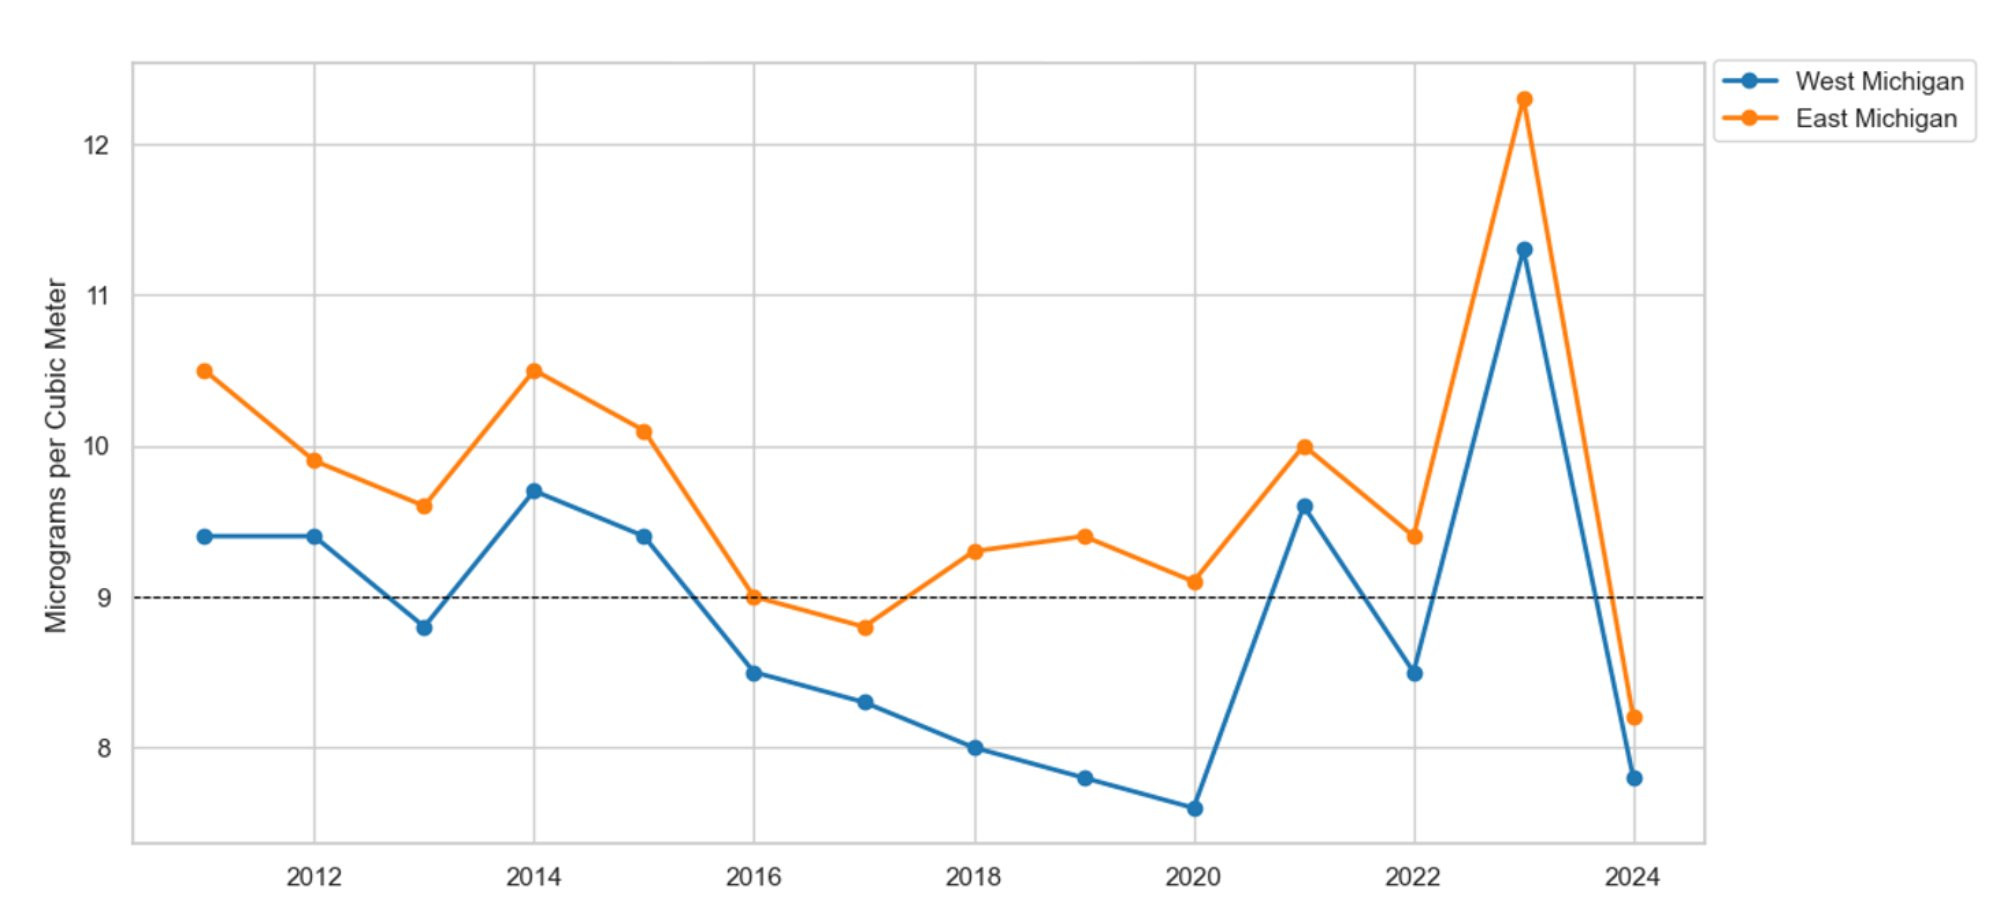
Description: Figure 4 illustrates the amount of particulate matter (2.5) air pollution per cubic meter of air in East and West Michigan compared to the EPA’s healthy environment goal of 9 micrograms per cubic meter or less. The graphs show that both East and West Michigan consistently exceed the EPA’s recommended pollution levels. Additionally, both regions experienced a spike in air pollution in 2023, which aligns with an increase in lung-related illnesses. On average, East Michigan reports higher pollution levels than West Michigan.
Source: U.S. Environmental Protection Agency (EPA)
Heart Disease, Heart Attacks, Strokes, and Cardiovascular Disease
Figure 5 presents the proportion of survey respondents who have ever been told they have coronary heart disease in East and West Michigan. On average, heart disease is 0.9 percent more prevalent in East Michigan than in West Michigan. The rate of heart disease has remained relatively stable in East Michigan. For example, there is little difference in heart disease prevalence before and after the onset of the COVID-19 pandemic in 2020. Meanwhile, a different story unfolds in West Michigan. Prior to the pandemic, on average, 3.8 percent of West Michigan’s population reported a heart disease diagnosis. However, after the onset of the pandemic, asthma prevalence in West Michigan jumped to an average of 4.4 percent, a 0.6 percent increase in heart disease diagnosis.
Figure 5: Heart Disease by Region
Description: Figure 5 illustrates the proportion of survey respondents reporting heart disease in East and West Michigan. Overall, the prevalence of heart disease has remained fairly steady. However, in East Michigan, heart disease started to increase in 2022. Meanwhile, heart disease in West Michigan hit a new high in 2024.
Source: Michigan Department of Health and Human Services, Behavioral Risk Factor Surveillance System, 2011-2024
We break down heart disease by race and gender to study the heterogeneity within and between each series. We omit the graph on racial differences because data on West Michigan’s non-white population are unavailable in the MiBRFSS. Figure 6 presents the prevalence of heart disease by gender and region. For example, in West Michigan, men report 2.4 percent more heart disease diagnoses than women. Additionally, in East Michigan, the prevalence of heart disease within the male population is 1.8 percent higher than in the female population. For brevity, we omit a lengthy discussion on heart attacks, strokes, and cardiovascular disease, noting that the trends in these heart conditions track the trends in heart disease reasonably well.
Figure 6: Heart Disease by Gender
Description: Figure 6 shows the percentage of survey respondents reporting heart disease by gender in East and West Michigan. On average, males in both regions report more cases of heart disease than women.
Source: Michigan Department of Health and Human Services, Behavioral Risk Factor Surveillance System, 2011-2024
What factors plausibly contribute to the increase in heart conditions? We turn to obesity, poor physical health, and access to care as potential determinants. Figure 7 presents the percentage of survey respondents reporting a body mass index (BMI) in the obese range in East and West Michigan since 2011. On average, obesity has increased in both regions. Since 2022, obesity in East Michigan has remained relatively stable at 35 percent of the population. Meanwhile, the recent data suggest that obesity is on the decline in West Michigan. For example, prior to 2022, obesity in West Michigan increased each year by an average of 0.6 percent. However, since 2022, obesity in West Michigan has declined by an average of 2 percent per year.
Figure 7: Obesity by Region
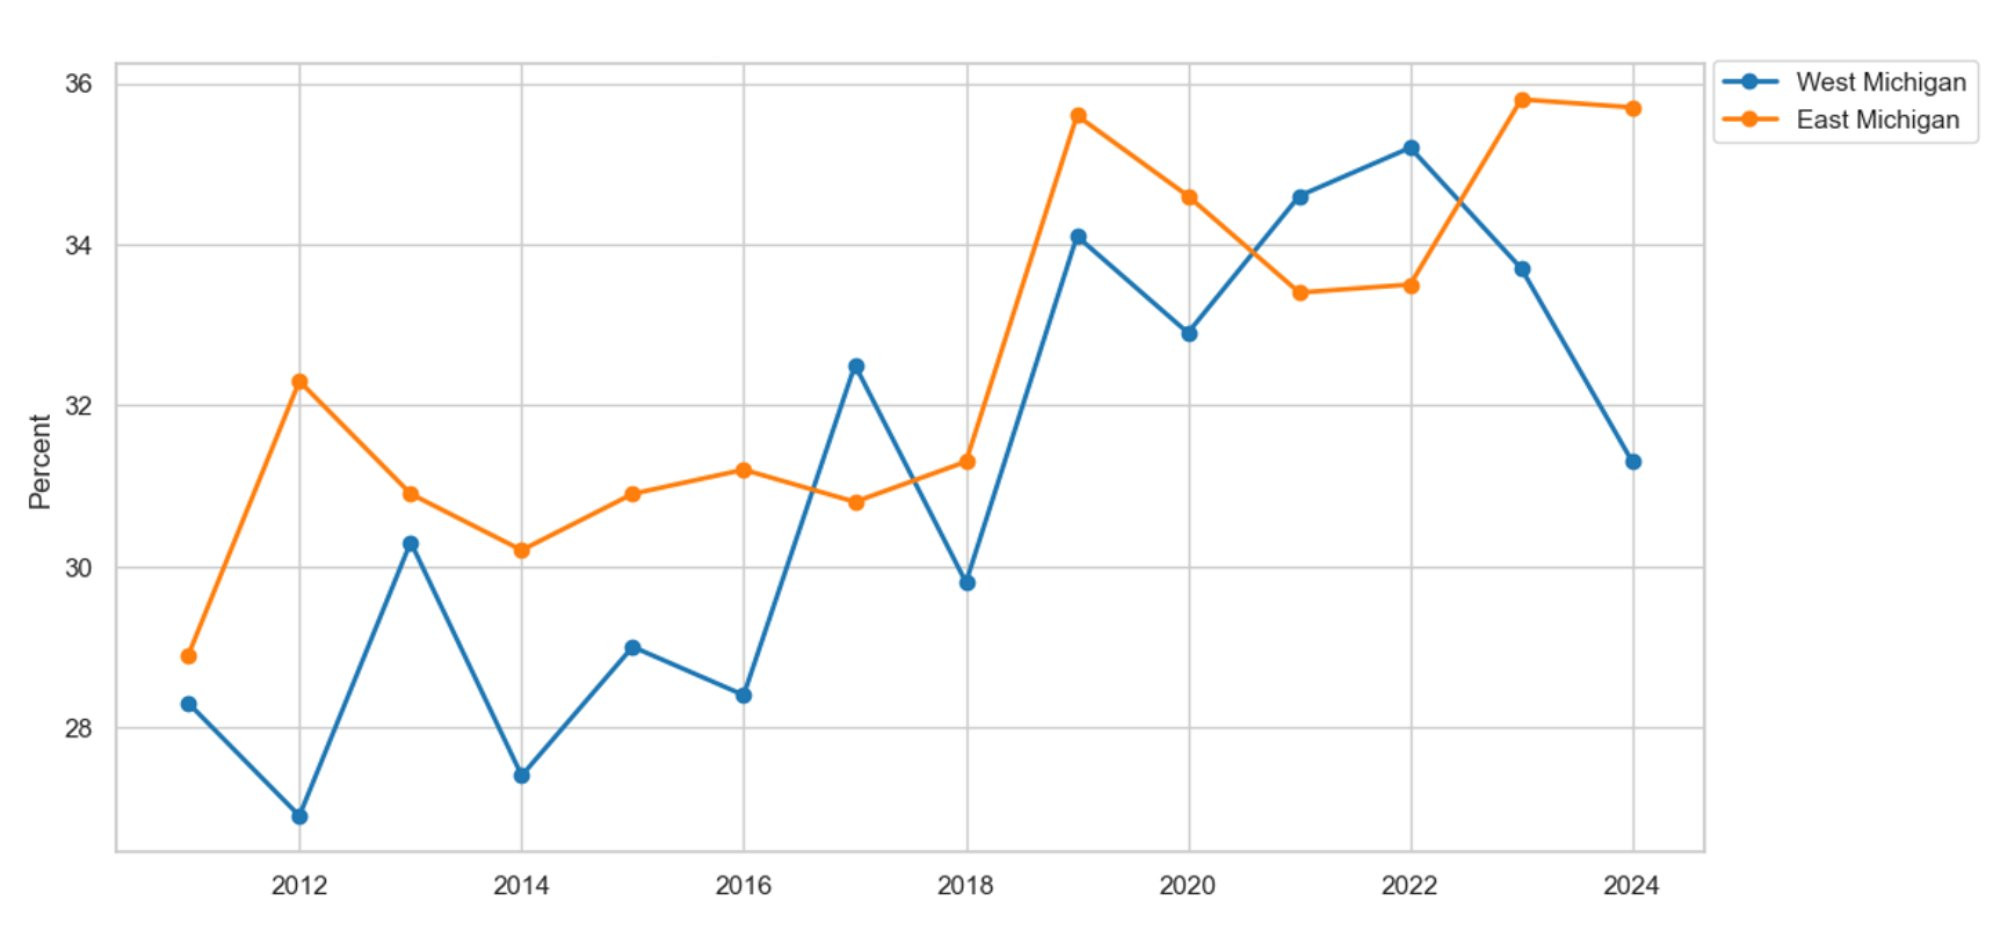
Description: Figure 7 shows the percentage of survey respondents who identify as obese in East and West Michigan. Obesity increased in the period leading up to the COVID-19 pandemic in 2020. However, since the onset of the pandemic, obesity has decreased in both regions.
Source: Michigan Department of Health and Human Services, Behavioral Risk Factor Surveillance System, 2011-2024
What factors explain the recent periods of decreasing obesity? Glucagon-like peptide-1 (GLP-1) was first approved by the U.S. Food and Drug Administration (FDA) in 2005 with AstraZeneca’s Byetta for diabetes (Alliance, 2025). It was not until 2014 that Novo Nordisk’s Saxenda was first prescribed for weight loss. However, GLP-1 did not become popular until the onset of the COVID-19 pandemic in 2020, when Ozempic, Mounjaro, Wegovy, and Zeobound gained FDA approval. In 2019, only 0.9 percent of the adult population was prescribed a GLP-1 medication. By 2024, that number increased to 4 percent of the adult population, a 363.7 percent increase in GLP-1 prescriptions (Fair Health, 2025). We continue by breaking down obesity by race and gender to study heterogeneity within and between series.
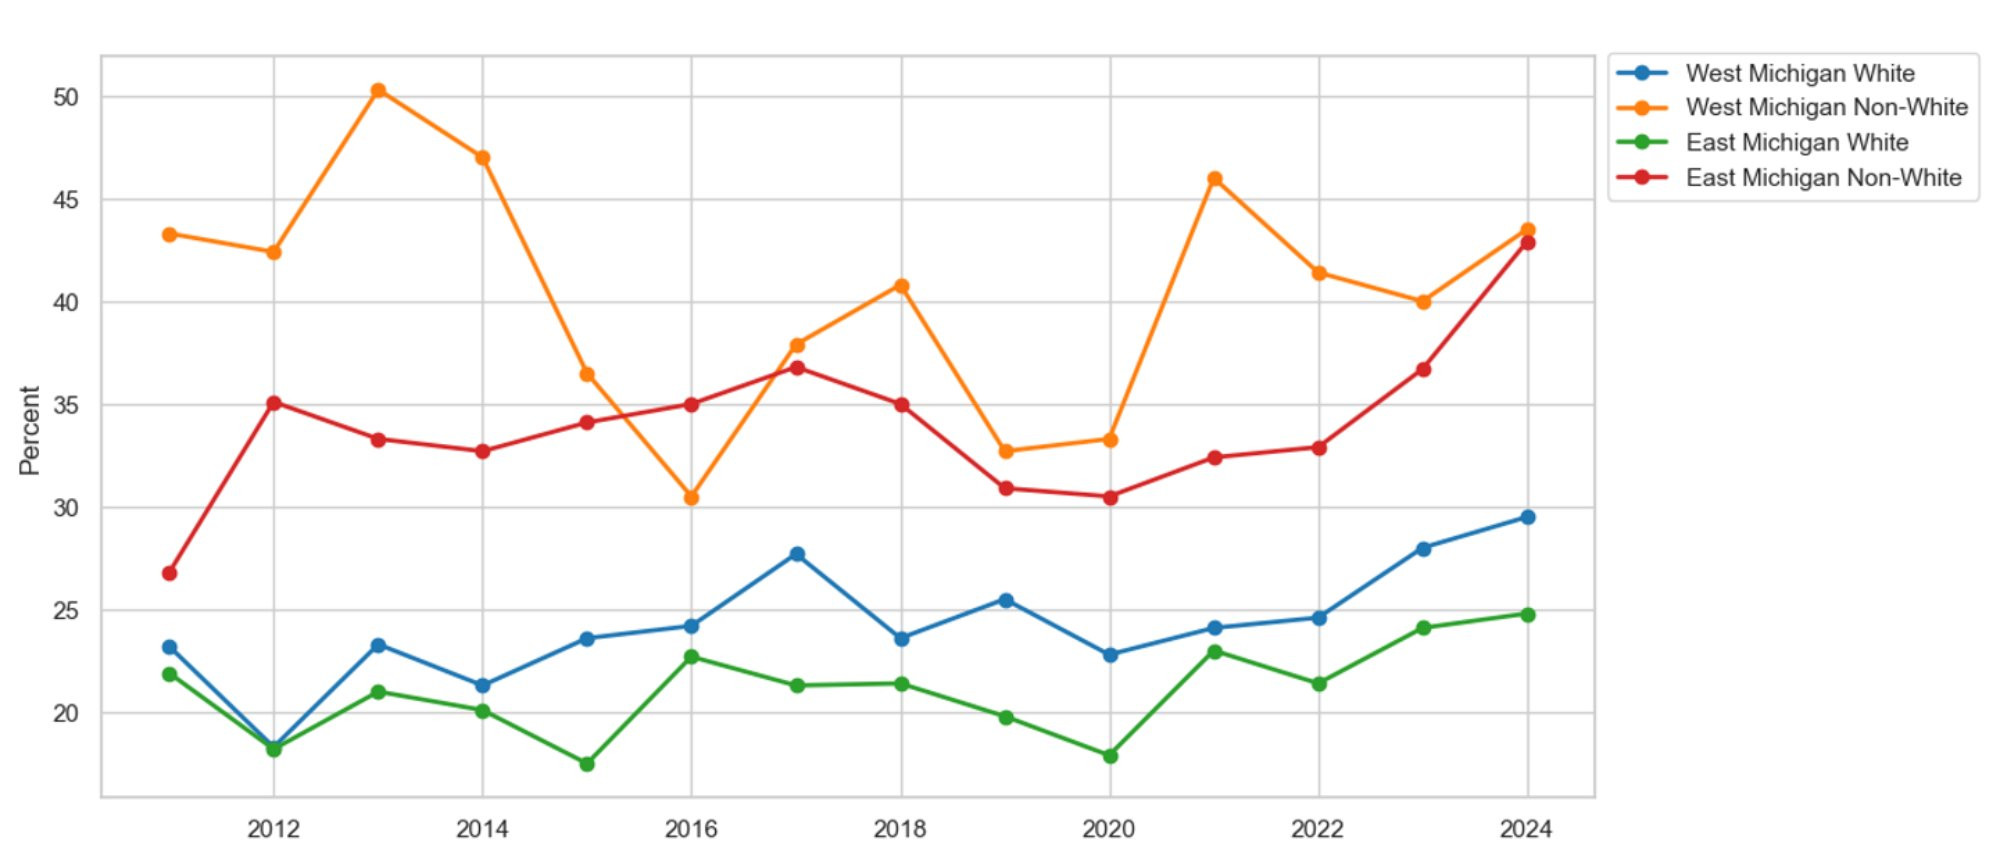
Figure 8 graphs obesity rates by race and region. The non-white population in West Michigan reports 3.8 percent more instances of obesity compared to the white population. Additionally, in East Michigan, non-white residents report 6.7 percent more cases of obesity than their white counterparts. Furthermore, obesity rates within the white populations of East and West Michigan have been increasing since 2011. Figure 9 presents obesity by gender and region. On average, men and women in West Michigan report comparable obesity rates. However, in East Michigan, obesity among the female population is 3.1 percent higher than that of their male counterparts. Regardless of gender and region, we find that obesity rates have continued to increase since 2011. As a result, the increase in obesity may plausibly explain the rise in heart-related conditions.
Figure 8: Obesity by Race
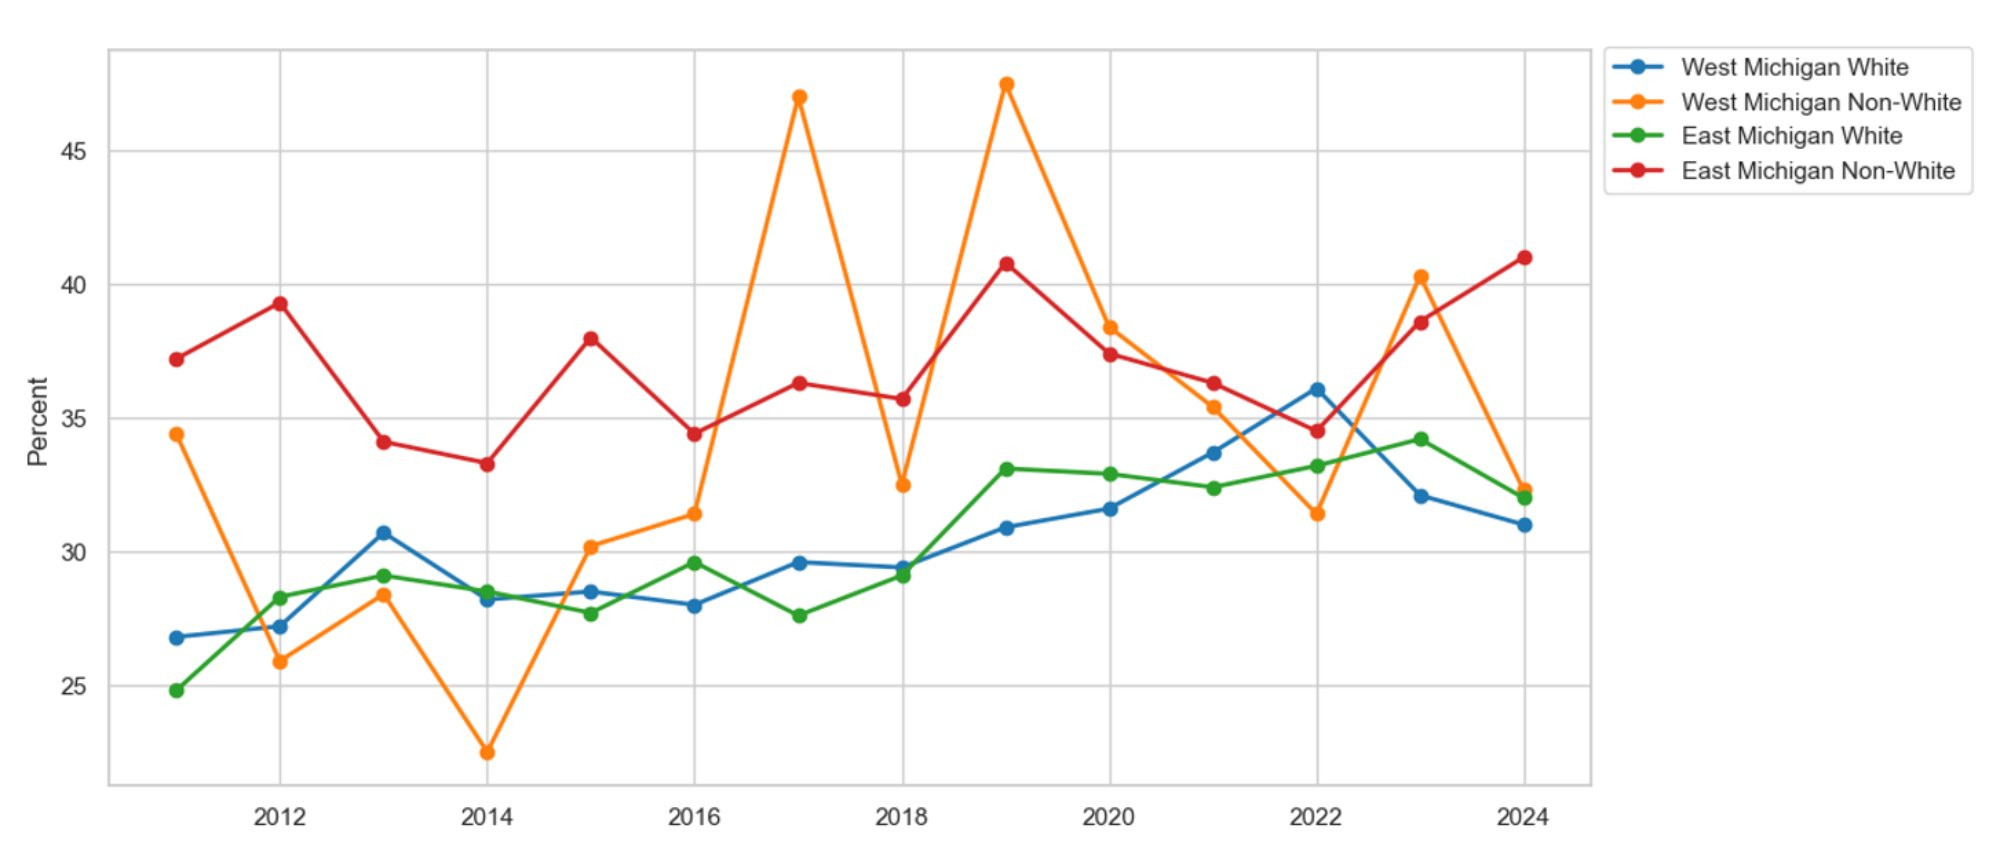
Description: Figure 8 shows the share of survey respondents who identify as obese by race in East and West Michigan. Overall, obesity rates are higher among non-white communities in both regions. Additionally, obesity among white residents in East and West Michigan has been rising since 2011, while obesity rates in the non-white population have remained more stable.
Source: Michigan Department of Health and Human Services, Behavioral Risk Factor Surveillance System, 2011-2024
Figure 9: Obesity by Gender
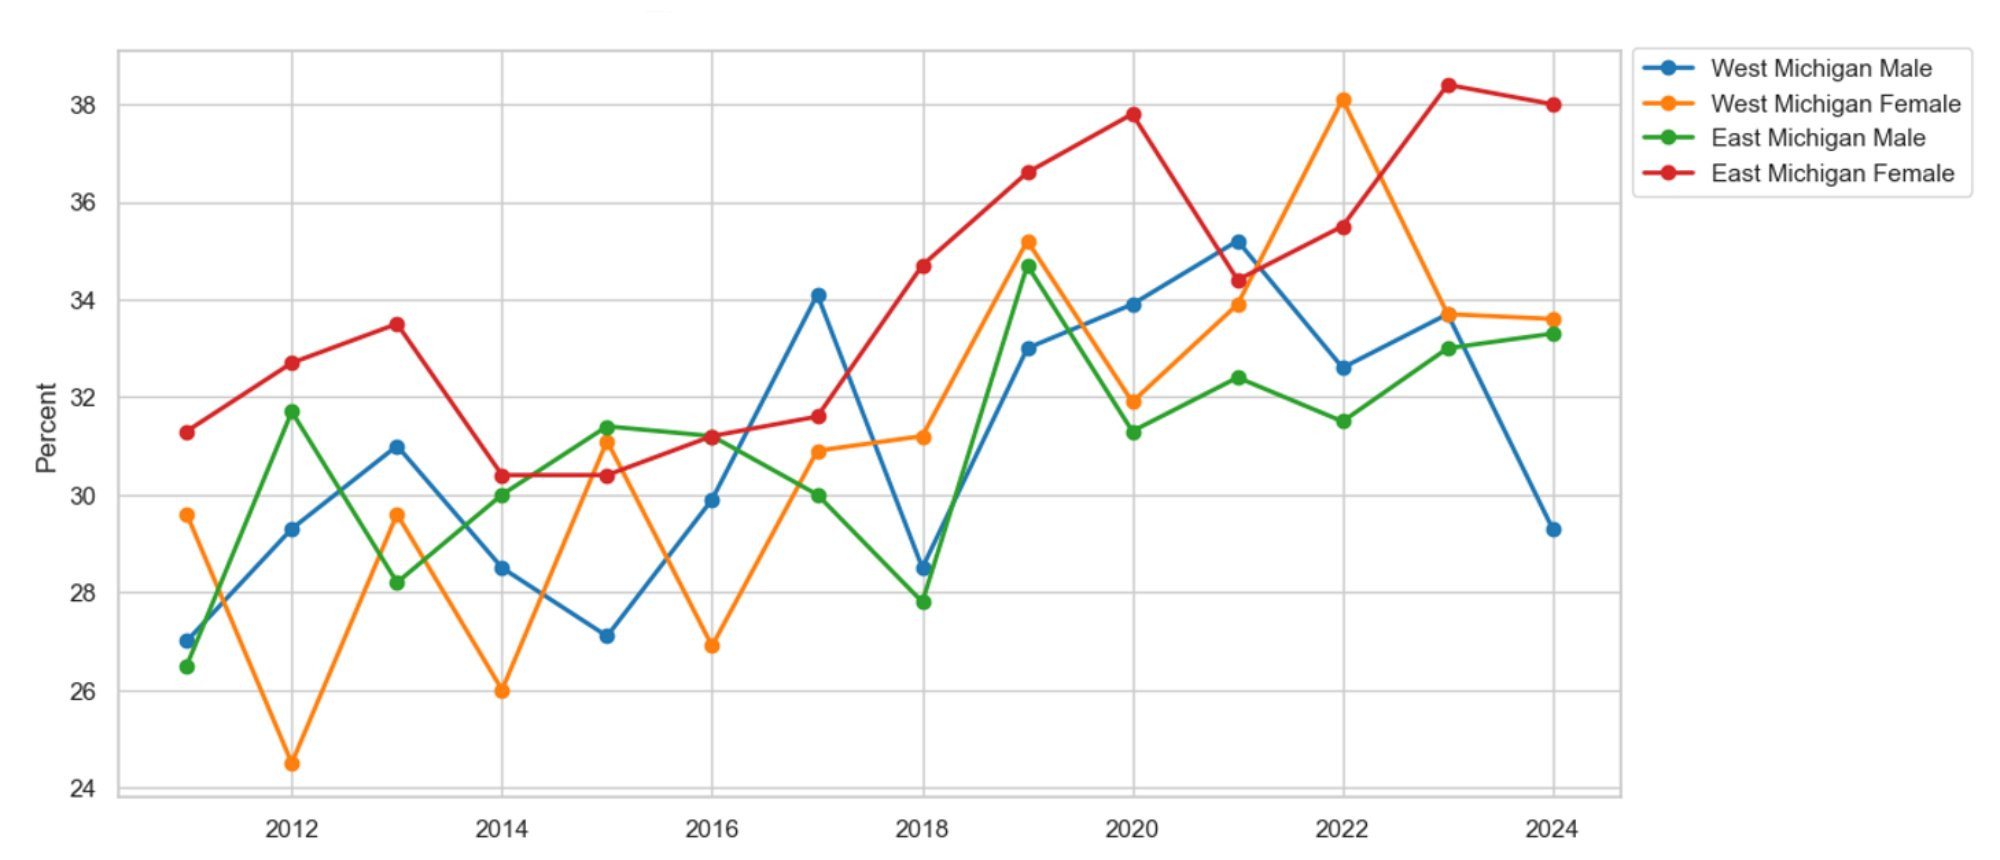
Description: Figure 9 shows the percentage of survey respondents identifying as obese by gender in East and West Michigan. Overall, obesity has been rising in both East and West Michigan, regardless of gender, since 2011. On average, females report a higher obesity rate than males in both regions.
Source: Michigan Department of Health and Human Services, Behavioral Risk Factor Surveillance System, 2011-2024
Figure 10 presents the percentage of survey respondents in East and West Michigan who reported 14 or more days of poor physical health in the last month. The data tell a compelling story about one of the benefits of working from home, as observed during the COVID-19 pandemic starting in 2020. On average, poor physical health decreased by 0.8 percent between the period predating and post-dating the pandemic. For example, between 2019 and 2022 alone, poor physical health decreased by 5.1 percent in West Michigan, which highlights one of the benefits of working from home: the added free time to prioritize physical health. Meanwhile, since the onset of the pandemic, poor physical health measures have crept back up to their pre-pandemic levels as work-from-home policies ended and workers were forced back into their daily commutes. Furthermore, we break down our poor physical health measures by race and gender.
Figure 10: Poor Physical Health by Region
Description: Figure 10 shows the share of survey respondents reporting 14 or more days of poor physical health in the past month in East and West Michigan. Overall, the share of respondents reporting poor physical health has risen since the start of the COVID-19 pandemic in 2020.
Source: Michigan Department of Health and Human Services, Behavioral Risk Factor Surveillance System, 2011-2024
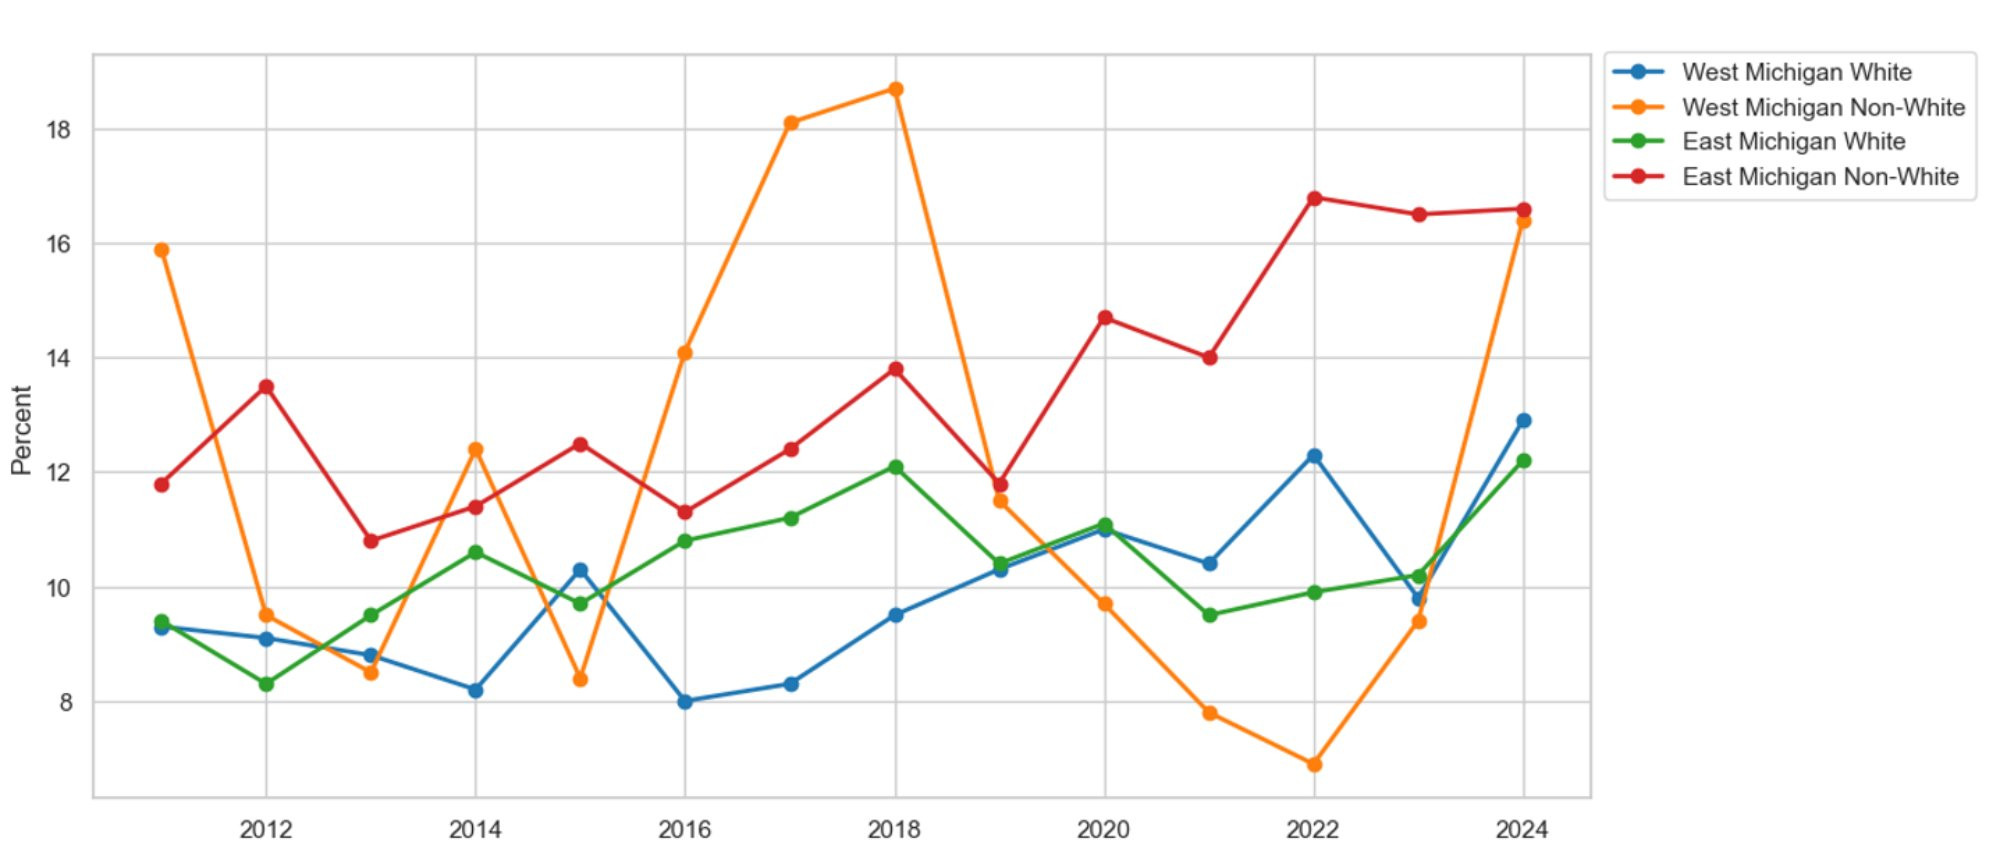
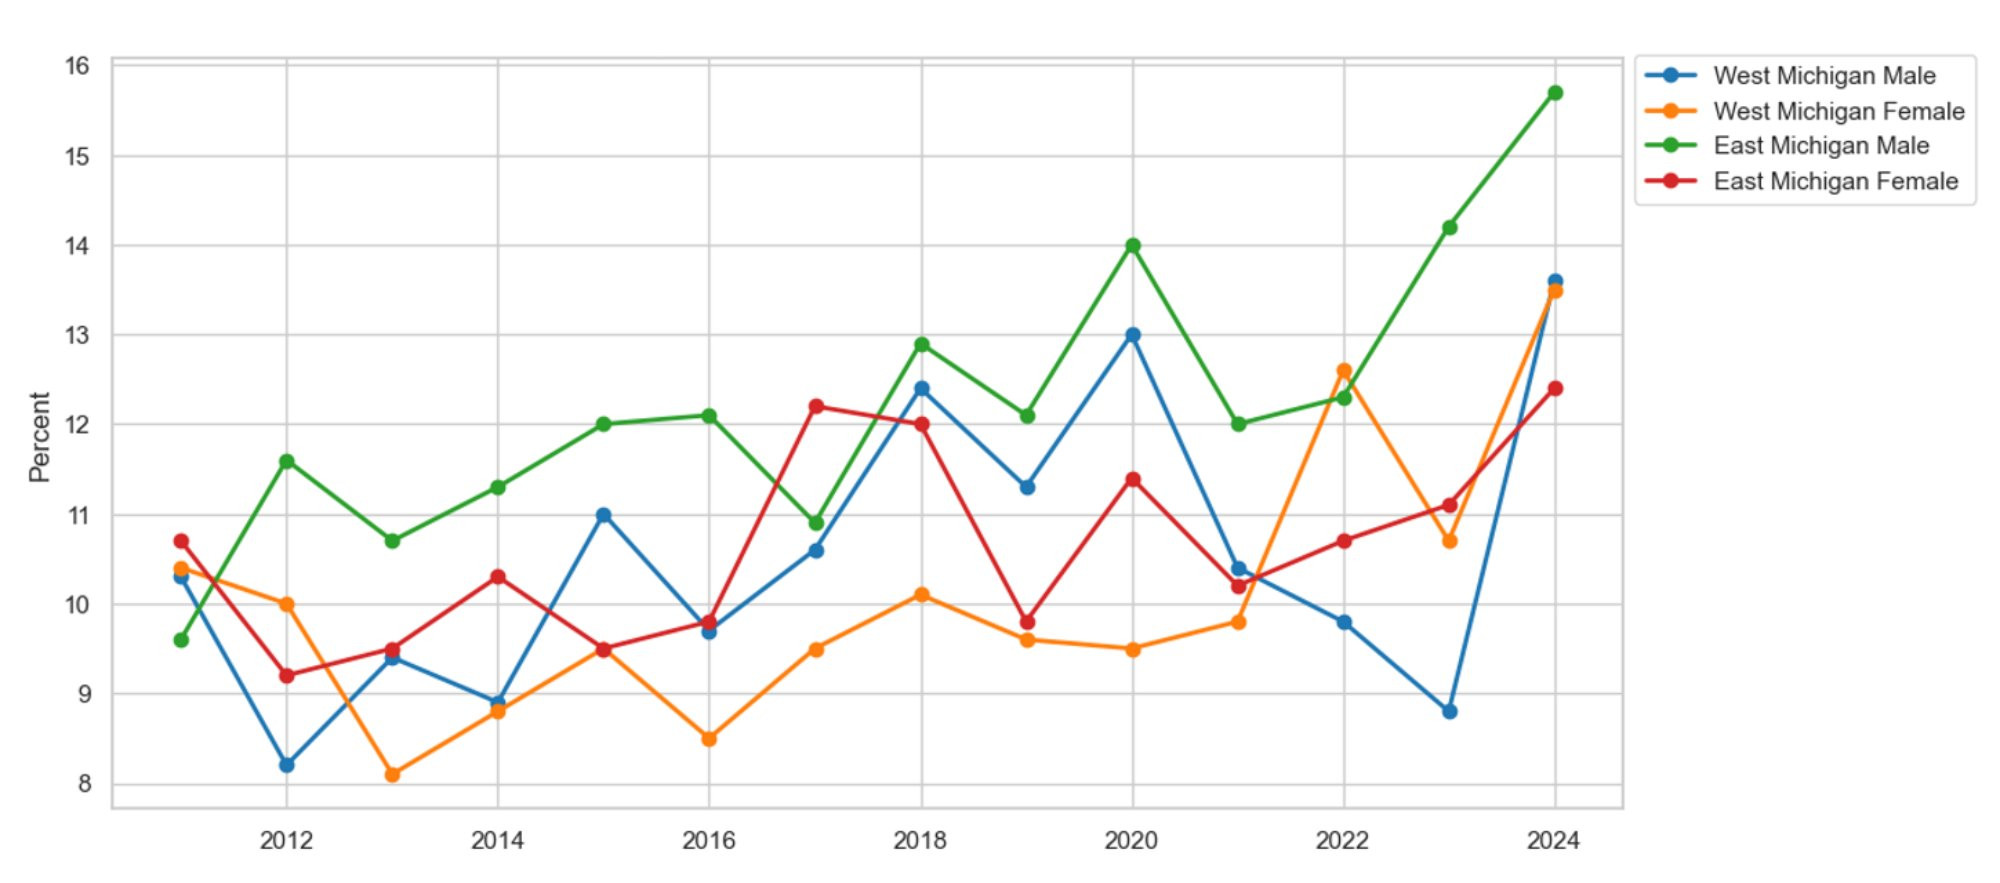
Figure 11 graphs poor physical health by race and region. On average, non-white residents report more poor mental health days compared to their white counterparts. For example, in West Michigan, 3.1 percent more non-white residents meet the poor physical health criteria than their white counterparts. Similarly, in East Michigan, the fraction of the non-white population reporting poor physical health is 1.7 percent higher than that of the white population. Figure 12 presents the poor physical health metrics by gender and region. On average, women in both regions report more days of poor physical health than men. For example, 2.4 percent more females than males meet the poor physical health criteria in West Michigan. Meanwhile, 2.2 percent more females than males meet the poor physical health criteria in East Michigan. The recent increase in poor physical health since the onset of the COVID-19 pandemic may plausibly explain the increase in heart-related conditions.
Figure 11: Poor Physical Health by Race
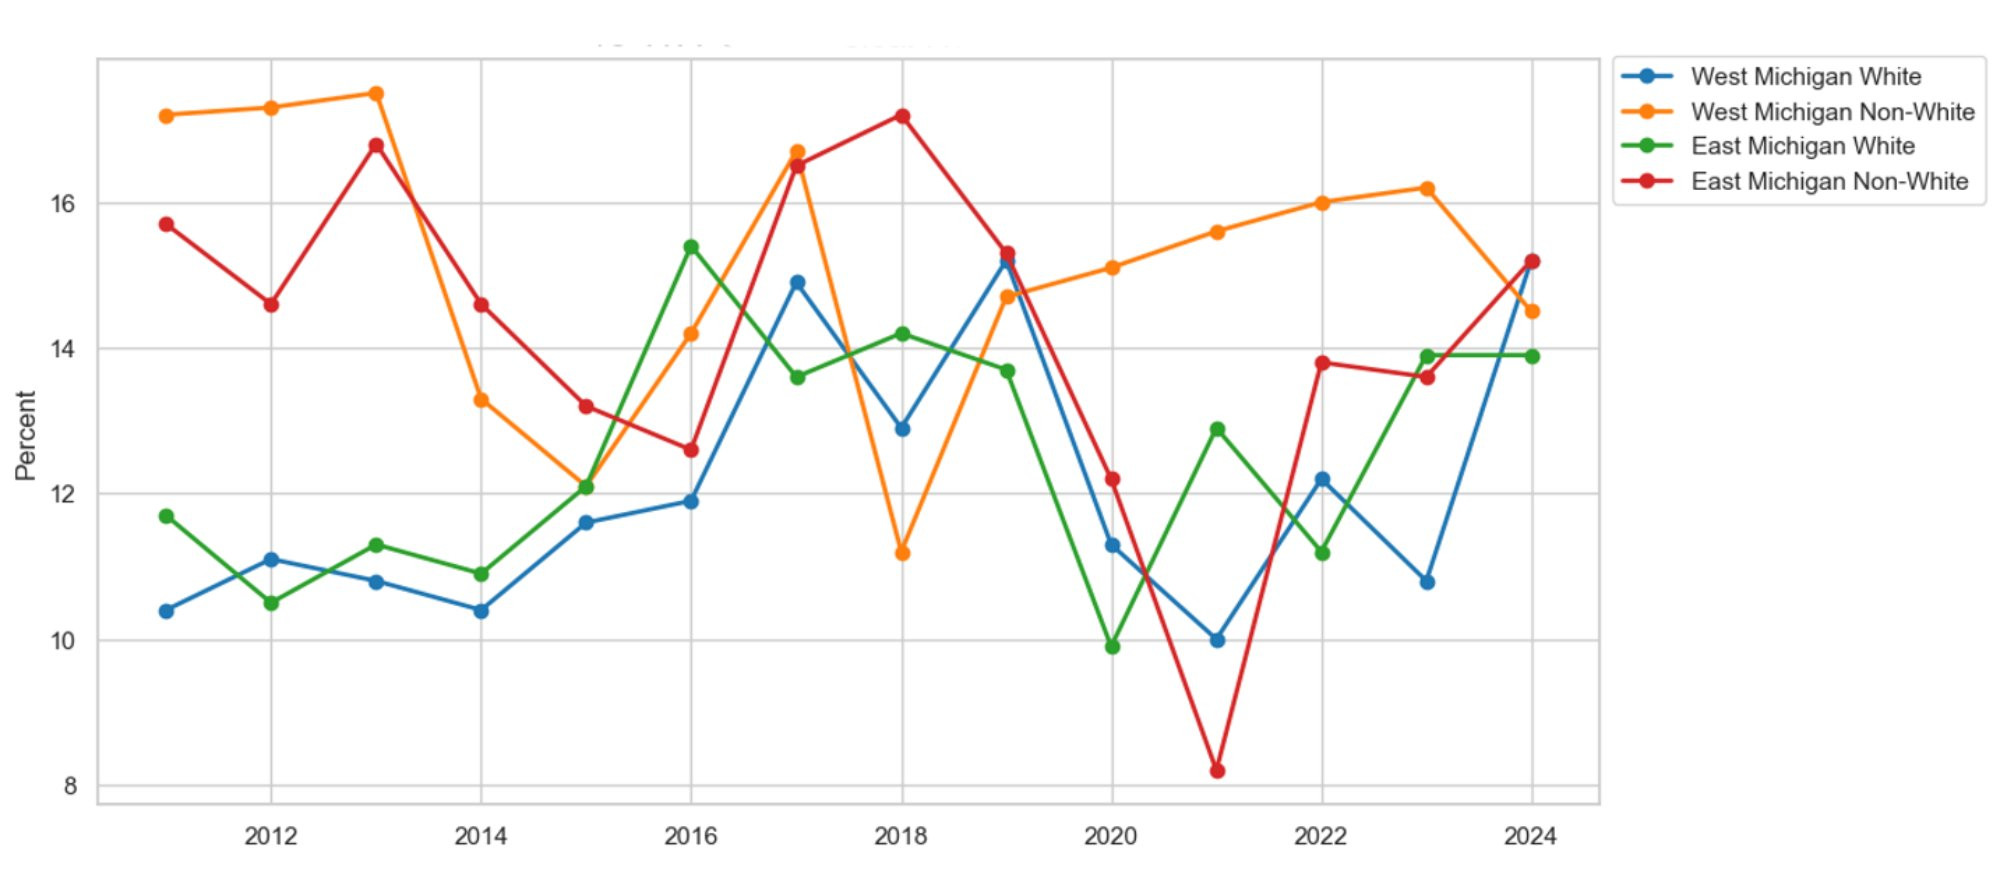
Description: Figure 11 shows the percentage of survey respondents reporting 14 or more days of poor physical health in the past month by race in East and West Michigan. Overall, the rate of respondents reporting poor physical health has risen since the start of the COVID-19 pandemic in 2020, regardless of race. Additionally, non-white residents in both East and West Michigan report more instances of poor physical health compared to white residents in both areas.
Source: Michigan Department of Health and Human Services, Behavioral Risk Factor Surveillance System, 2011-2024
Figure 12: Poor Physical Health by Gender
Description: Figure 12 shows the percentage of survey respondents reporting 14 or more days of poor physical health in the last month by gender in East and West Michigan. Overall, the rate of respondents reporting poor physical health has risen since the start of the COVID-19 pandemic in 2020, regardless of gender. Additionally, women in both East and West Michigan report more days of poor physical health than men.
Source: Michigan Department of Health and Human Services, Behavioral Risk Factor Surveillance System, 2011-2024
To address the rise in heart conditions, we evaluate our patients' ability to access care in East and West Michigan. Figure 13 illustrates the percentage of survey respondents with at least one healthcare provider by region. The number of respondents with at least one provider has grown in both areas since 2011. However, West Michiganders seem to have better access to healthcare than their East Michigan counterparts. On average, residents of West Michigan report 2.7 percent greater access to care than those in East Michigan. Specifically for heart conditions, this increased access is also due to the emergence of new regional heart centers in West Michigan. Additionally, we analyze access to care by race and gender to understand variation within and between regions.
Figure 13: Access to Care by Region
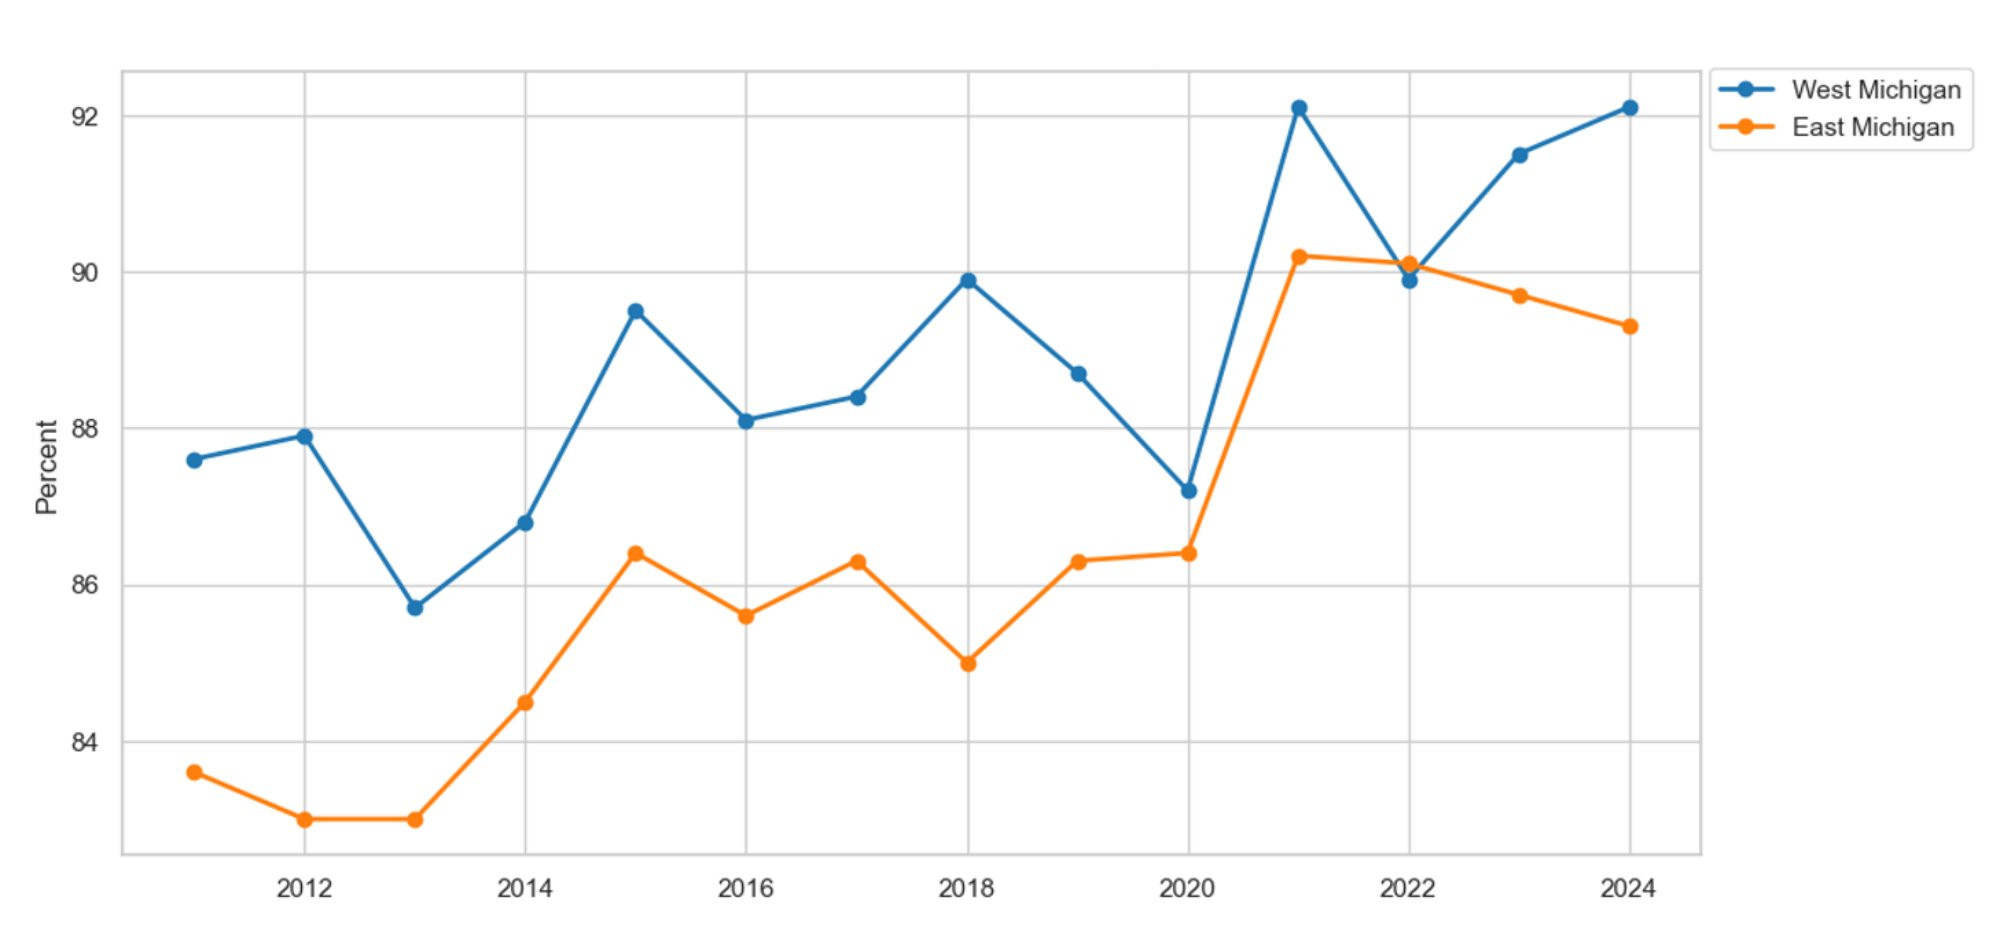
Description: Figure 13 shows the percentage of survey respondents who report having at least one healthcare provider in East and West Michigan. On average, respondents report better access to care in both regions since 2011, with a significant increase since the start of the COVID-19 pandemic in 2020.
Source: Michigan Department of Health and Human Services, Behavioral Risk Factor Surveillance System, 2011-2024
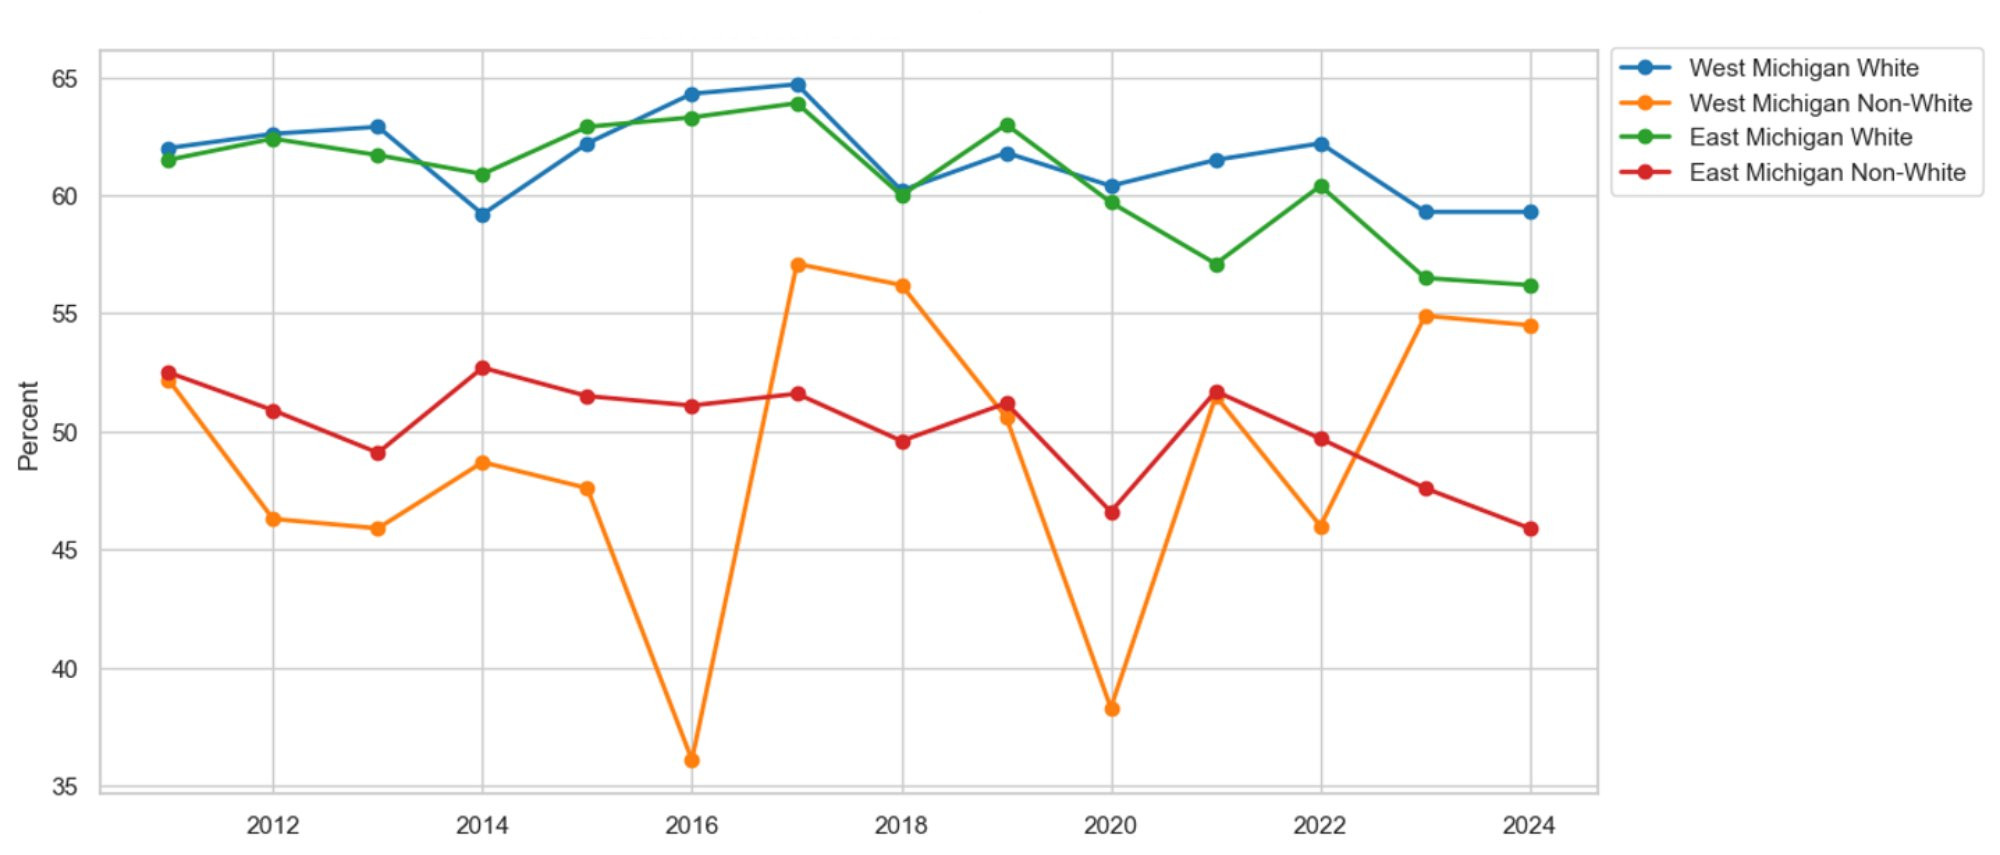
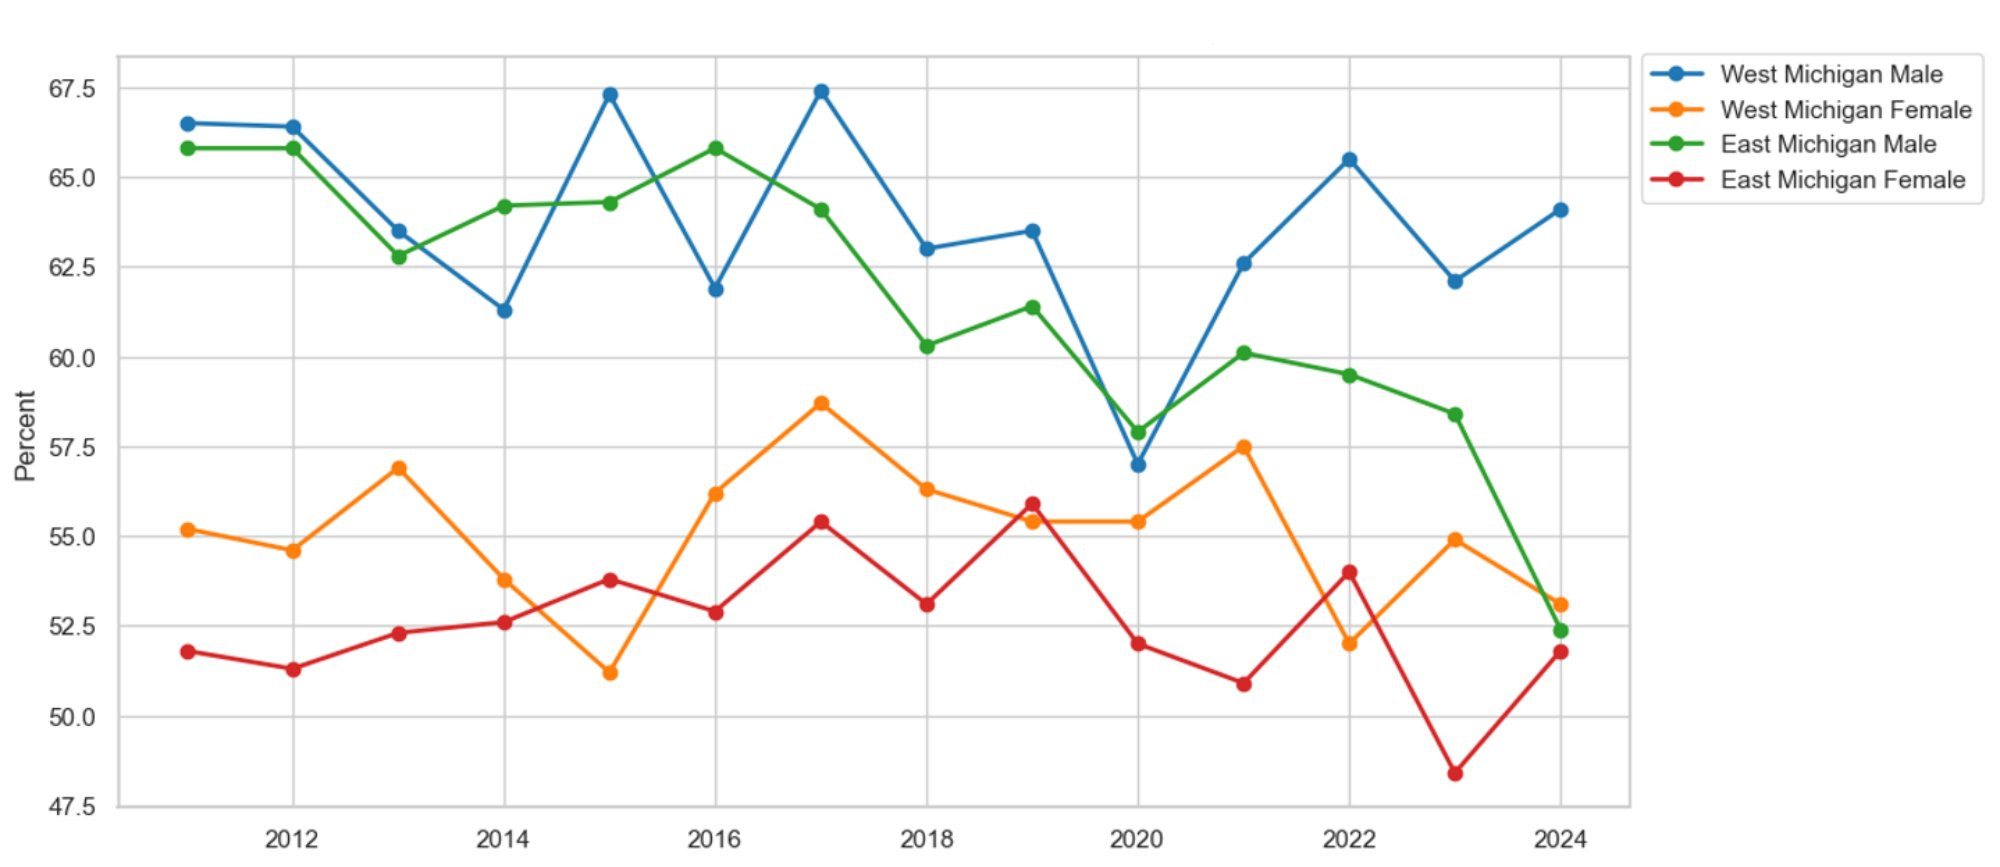
Figure 14 shows the percentage of survey respondents with at least one healthcare provider by race and region. White residents in both areas report better access to care than their non-white counterparts. On average, 10 percent more white residents have a healthcare provider than non-white residents in West Michigan. The racial gap in West Michigan is much larger than in East Michigan. In East Michigan, only 5.7 percent more white residents report having a healthcare provider than non-white residents. Figure 15 illustrates our access-to-care measure by gender and region. Men, in both regions, have seen increased access to care since 2011. However, women more often report greater access to care compared to men. On average, 9.1 percent more women report having a healthcare provider than men in East Michigan. The gender gap in East Michigan is similar to that in West Michigan, where 8.4 percent more women report having a healthcare provider than men.
Figure 14: Access to Care by Race
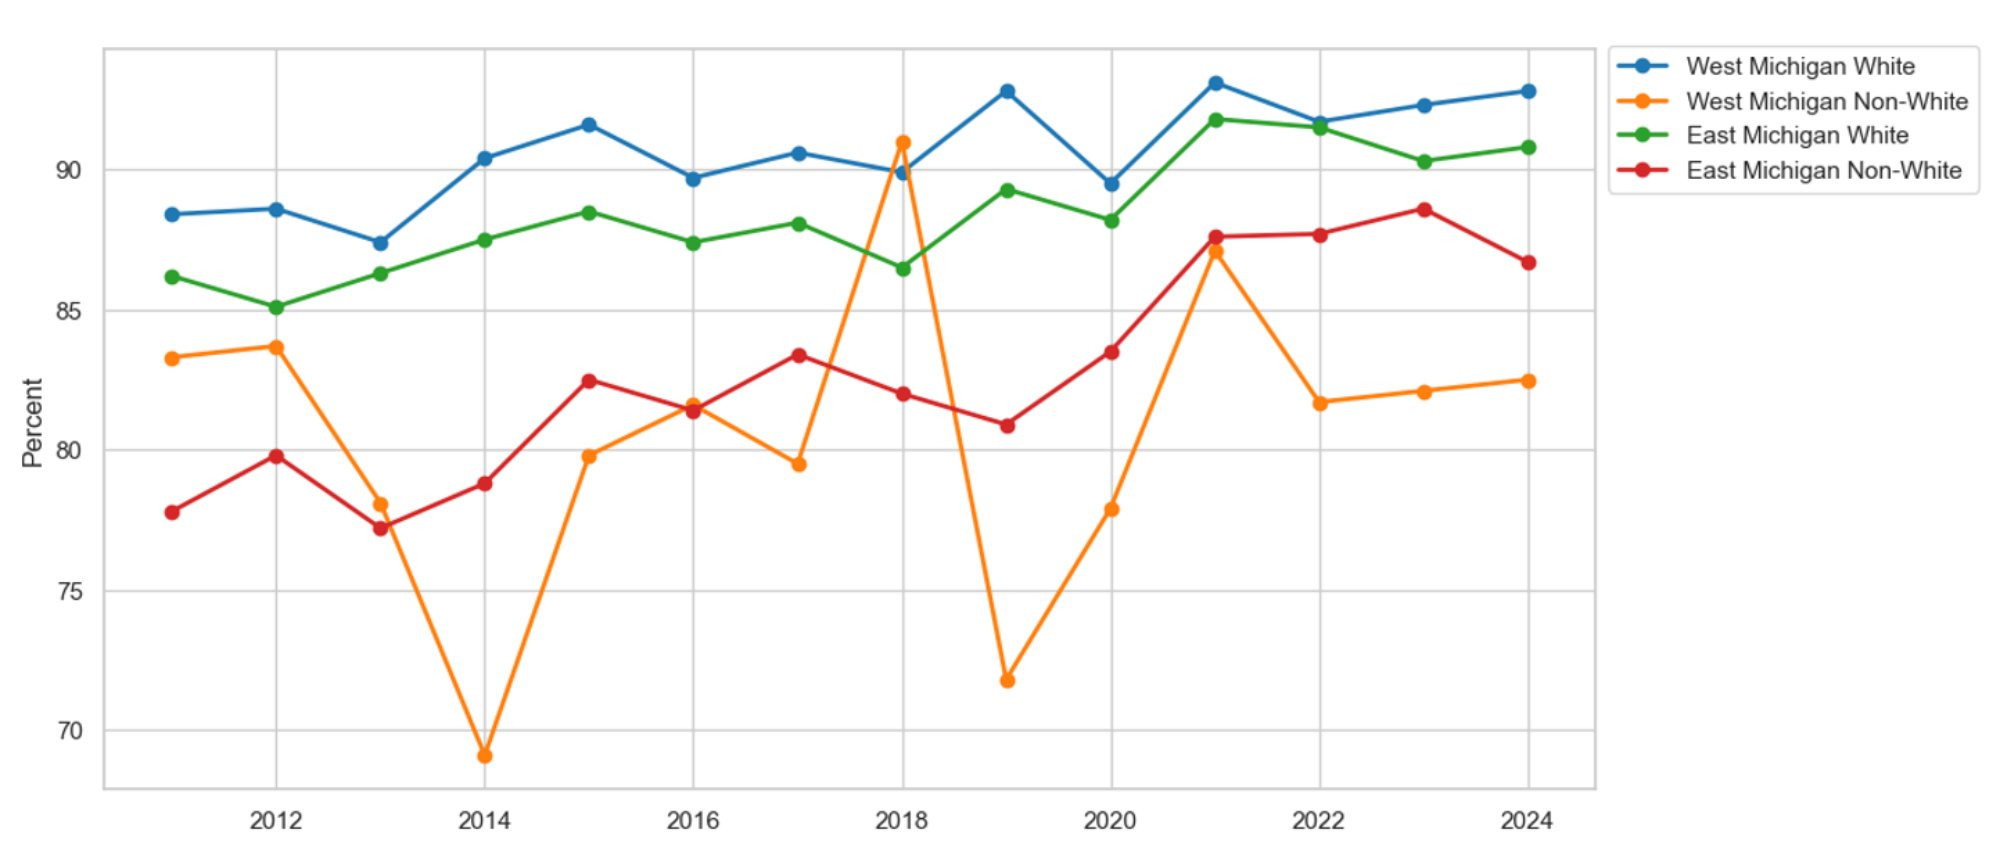
Description: Figure 14 shows the percentage of survey respondents who report having at least one healthcare provider by race in East and West Michigan. On average, white residents in these areas report better access to care than non-white residents.
Source: Michigan Department of Health and Human Services, Behavioral Risk Factor Surveillance System, 2011-2024
Figure 15: Access to Care by Gender
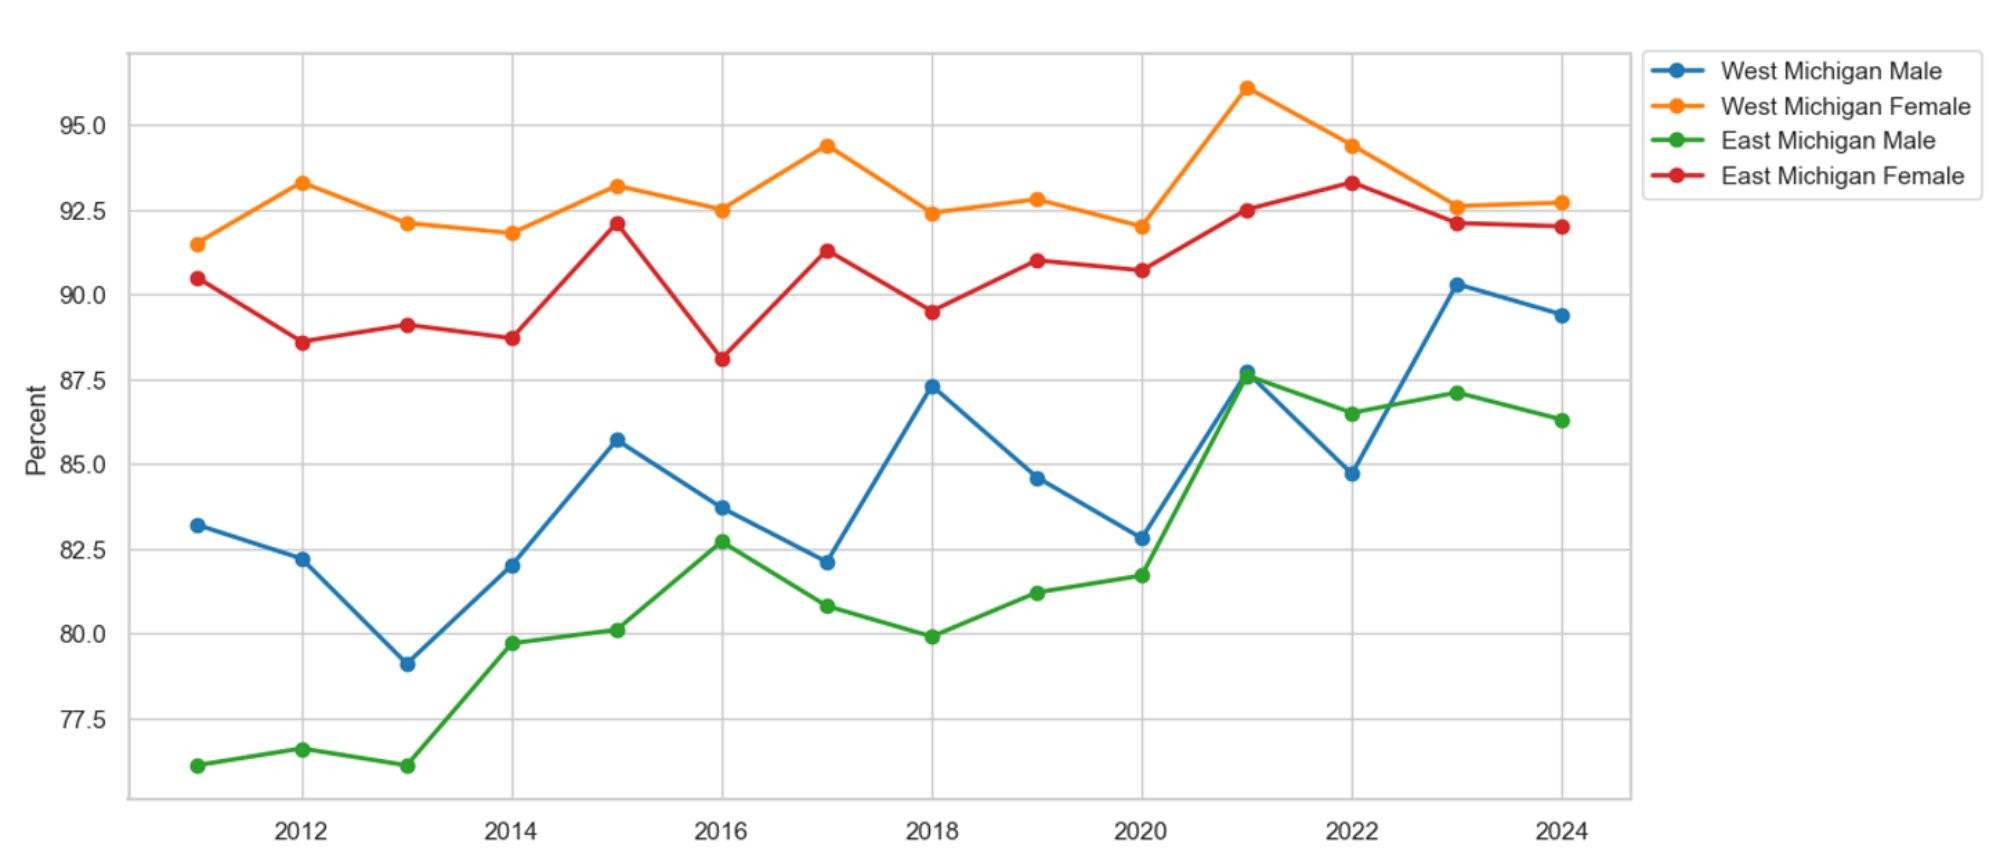
Description: Figure 15 shows the percentage of survey respondents who report having at least one healthcare provider by gender in East and West Michigan. On average, females in East and West Michigan report better access to care than their male counterparts. However, all demographic groups report increased access to care since 2011.
Source: Michigan Department of Health and Human Services, Behavioral Risk Factor Surveillance System, 2011-2024
Diabetes
Now, we turn to another primary disease, diabetes. Figure 16 shows the number of survey respondents reporting diabetes in East and West Michigan. Diagnoses of diabetes have increased in both regions since 2011. However, diabetes seems to be more common in East Michigan than in West Michigan. On average, 1.1 percent more people in East Michigan are diabetic compared to those in West Michigan. Additionally, we break down diabetes prevalence by race and gender to analyze how it has changed over time across different demographic groups.
Figure 16: Diabetes by Region
Description: Figure 16 shows the percentage of survey respondents reporting a diabetes diagnosis in East and West Michigan. Typically, diabetes is more common in East Michigan than in West Michigan. Furthermore, the prevalence of diabetes has been rising in both regions since 2011.
Source: Michigan Department of Health and Human Services, Behavioral Risk Factor Surveillance System, 2011-2024
Figure 17 shows the proportion of diabetes diagnoses by race in East and West Michigan. The prevalence of diabetes has risen across all races and regions since 2011. However, regardless of the region, non-white residents are more likely to report a diabetes diagnosis than their white counterparts. On average, 2.1 percent more non-white residents have been diagnosed with diabetes compared to white residents in West Michigan. Additionally, the prevalence of diabetes is 3.1 percent higher among non-whites than whites in East Michigan. A racial disparity in diabetes diagnoses exists in both regions, disproportionately affecting non-white communities. Figure 18 displays the prevalence of diabetes by gender and region. Again, regardless of gender and region, diabetes is increasing. However, while there is no statistical disparity between men and women in West Michigan, a gender disparity exists in East Michigan. On average, 1.6 percent more males report a diabetes diagnosis compared to females in East Michigan.
Figure 17: Diabetes by Race
Description: Figure 17 shows the percentage of survey respondents reporting a diabetes diagnosis by race in East and West Michigan. Overall, diabetes has been rising across all races and regions, except for non-white residents in West Michigan, who show more variability. Additionally, non-white residents report more cases of diabetes than white residents in East Michigan.
Source: Michigan Department of Health and Human Services, Behavioral Risk Factor Surveillance System, 2011-2024
Figure 18: Diabetes by Gender
Description: Figure 18 shows the percentage of survey respondents reporting a diabetes diagnosis by gender in East and West Michigan. On average, the male populations in East and West Michigan report a higher prevalence of diabetes compared to their female counterparts.
Source: Michigan Department of Health and Human Services, Behavioral Risk Factor Surveillance System, 2011-2024
Kidney Disease
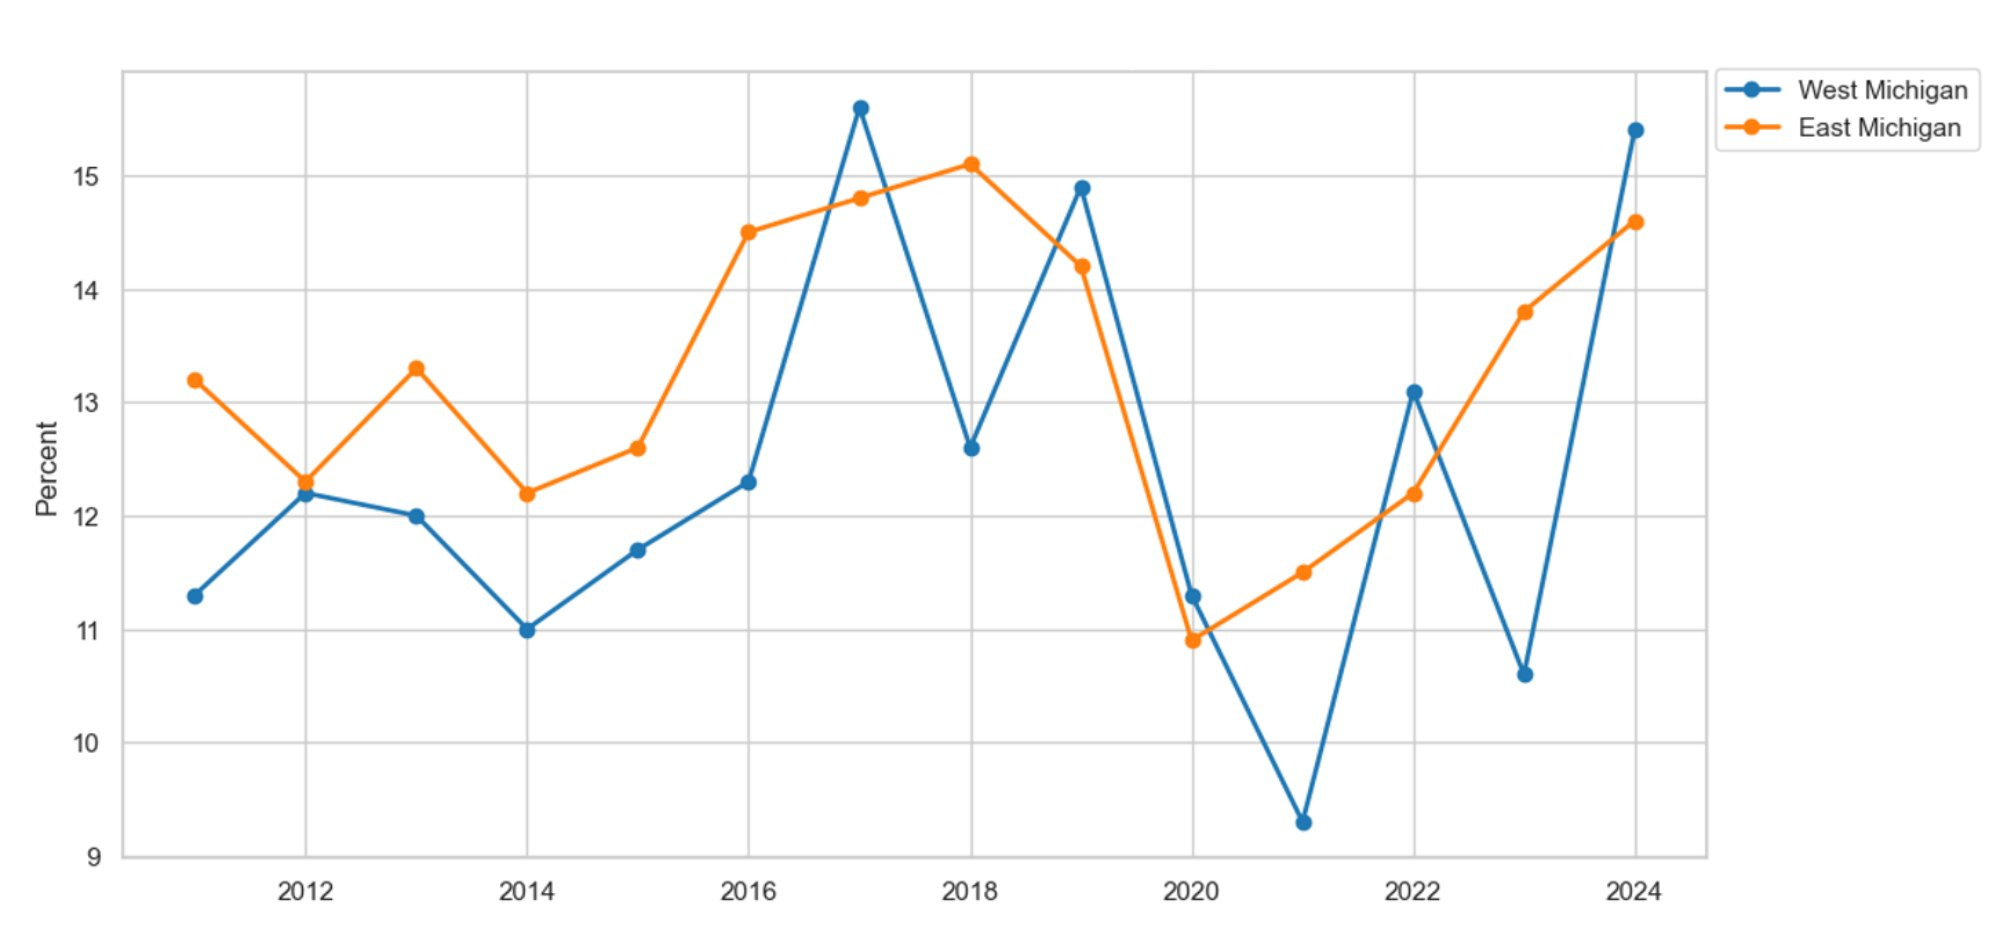
We continue by focusing on another disease on the rise, kidney disease. Figure 19 presents the proportion of survey respondents reporting a kidney disease diagnosis in East and West Michigan since 2011. On average, kidney disease remained relatively stable between 2011 and 2020. However, after the onset of the COVID-19 pandemic, kidney disease diagnoses increased in both regions. For example, between 2020 and 2024, the prevalence of kidney disease increased by 2 percent in East and West Michigan, respectively. We further study the rise in kidney disease by breaking down our regional series by race and gender. The racial graphs are not presented here because the non-white series was suppressed in West Michigan.
Figure 19: Kidney Disease by Region
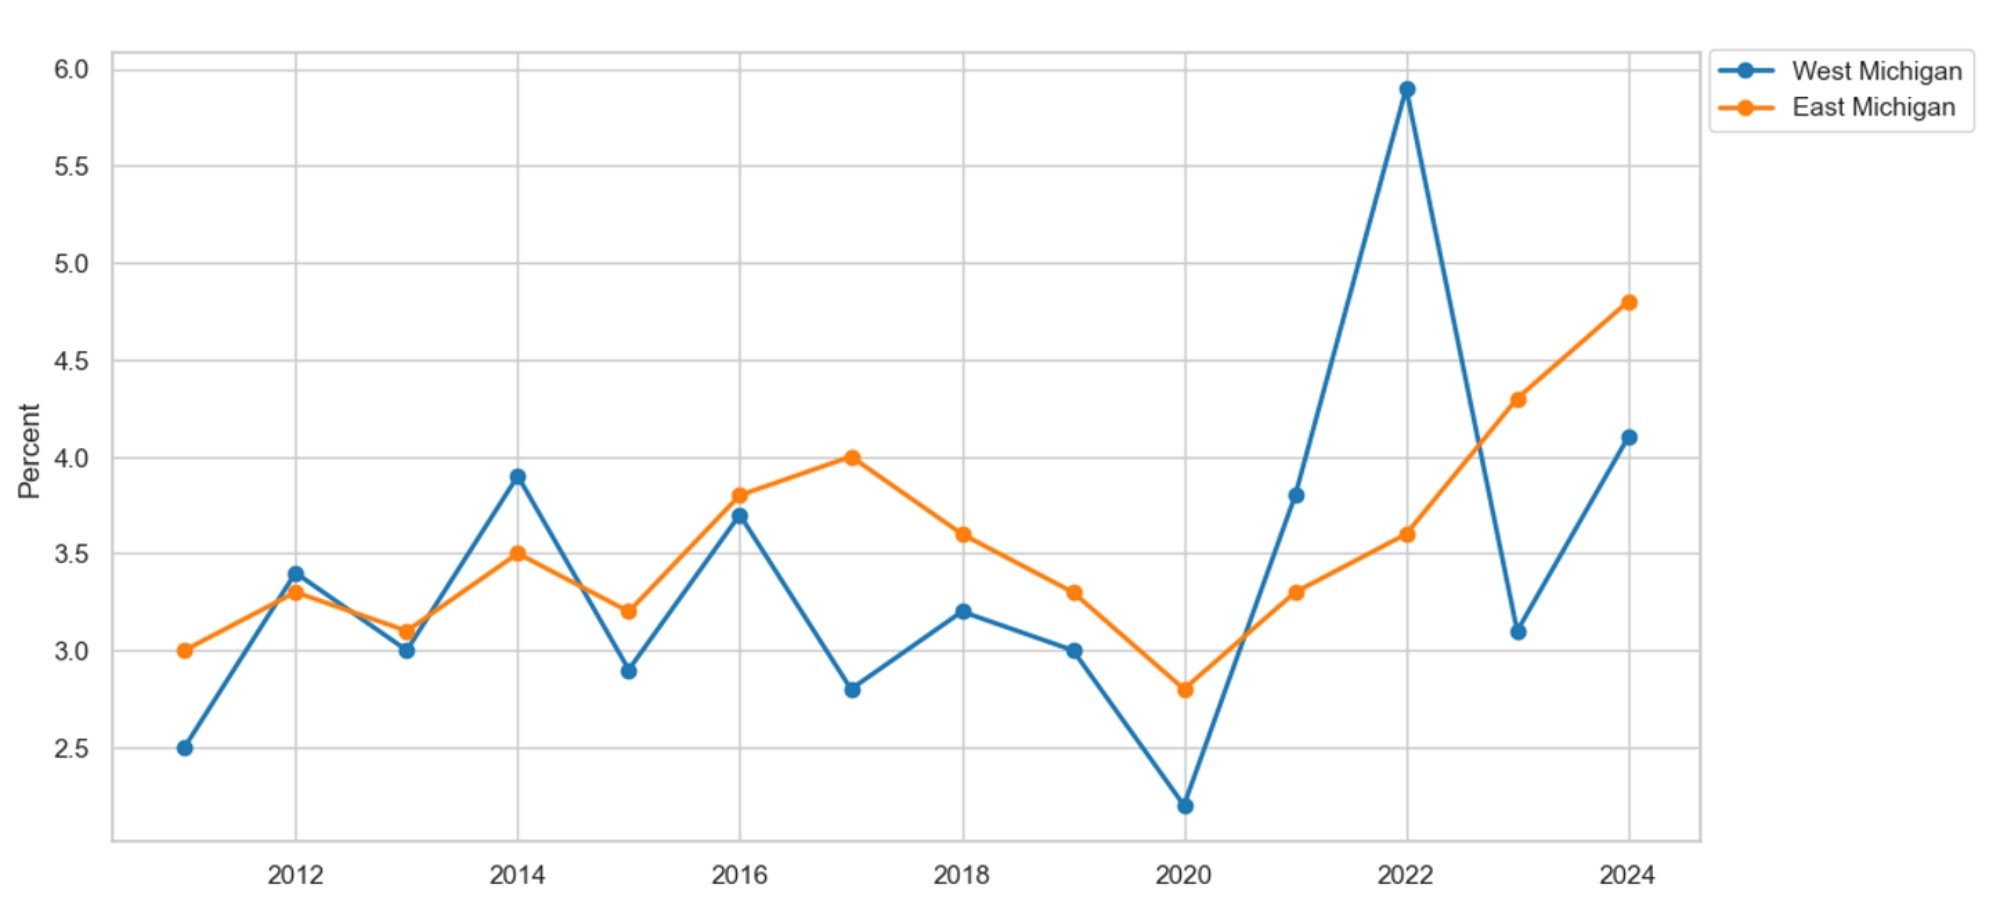
Description: Figure 19 displays the proportion of survey respondents who report having a kidney disease diagnosis in East and West Michigan. On average, kidney disease is more prevalent in East Michigan than in West Michigan. Additionally, kidney disease has been increasing in East and West Michigan since the onset of the COVID-19 pandemic in 2020.
Source: Michigan Department of Health and Human Services, Behavioral Risk Factor Surveillance System, 2011-2024
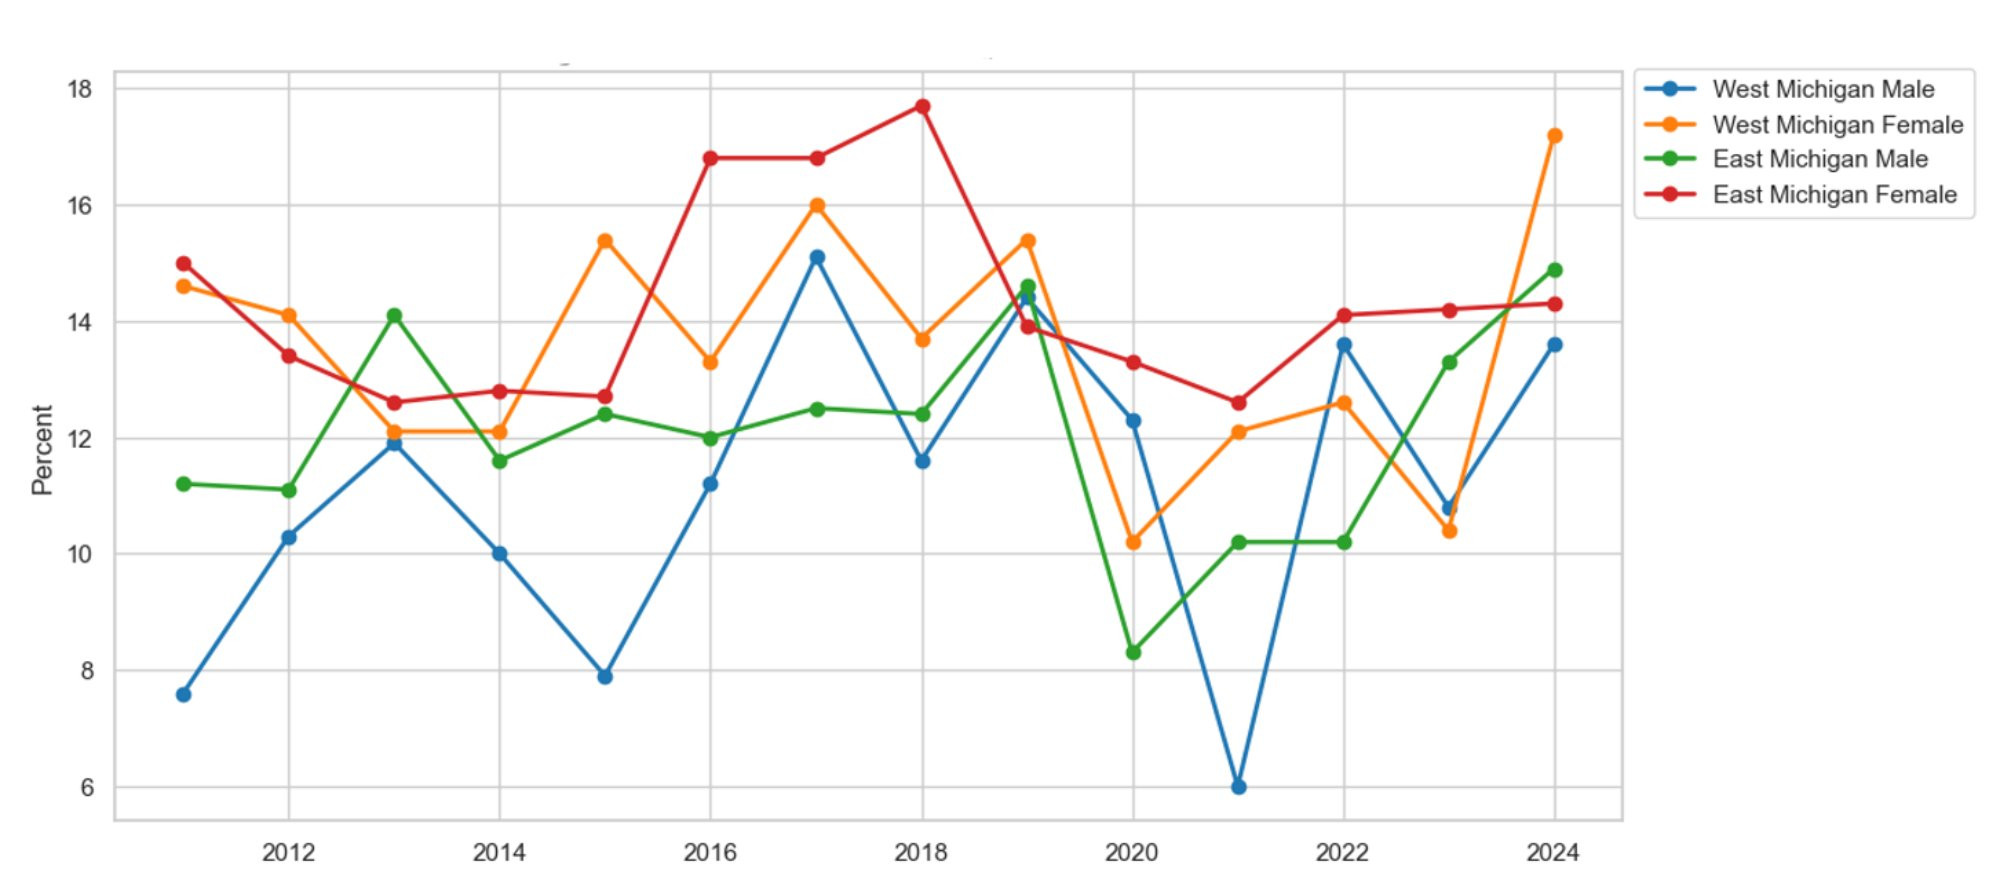
Figure 20 shows the prevalence of kidney disease by gender and region. Our female dataset appears to remain relatively stable over time. However, males have seen an increase in the prevalence of kidney disease in both locations. For example, since 2011, the percentage of male survey respondents in West Michigan with a kidney disease diagnosis has risen by 3.6 percent. Meanwhile, 2.6 percent more males in East Michigan reported having kidney disease in 2024 compared to 2011. Now, let us examine the last health issue analyzed in this section: the rise in depression and decline in mental health.
Figure 20: Kidney Disease by Gender
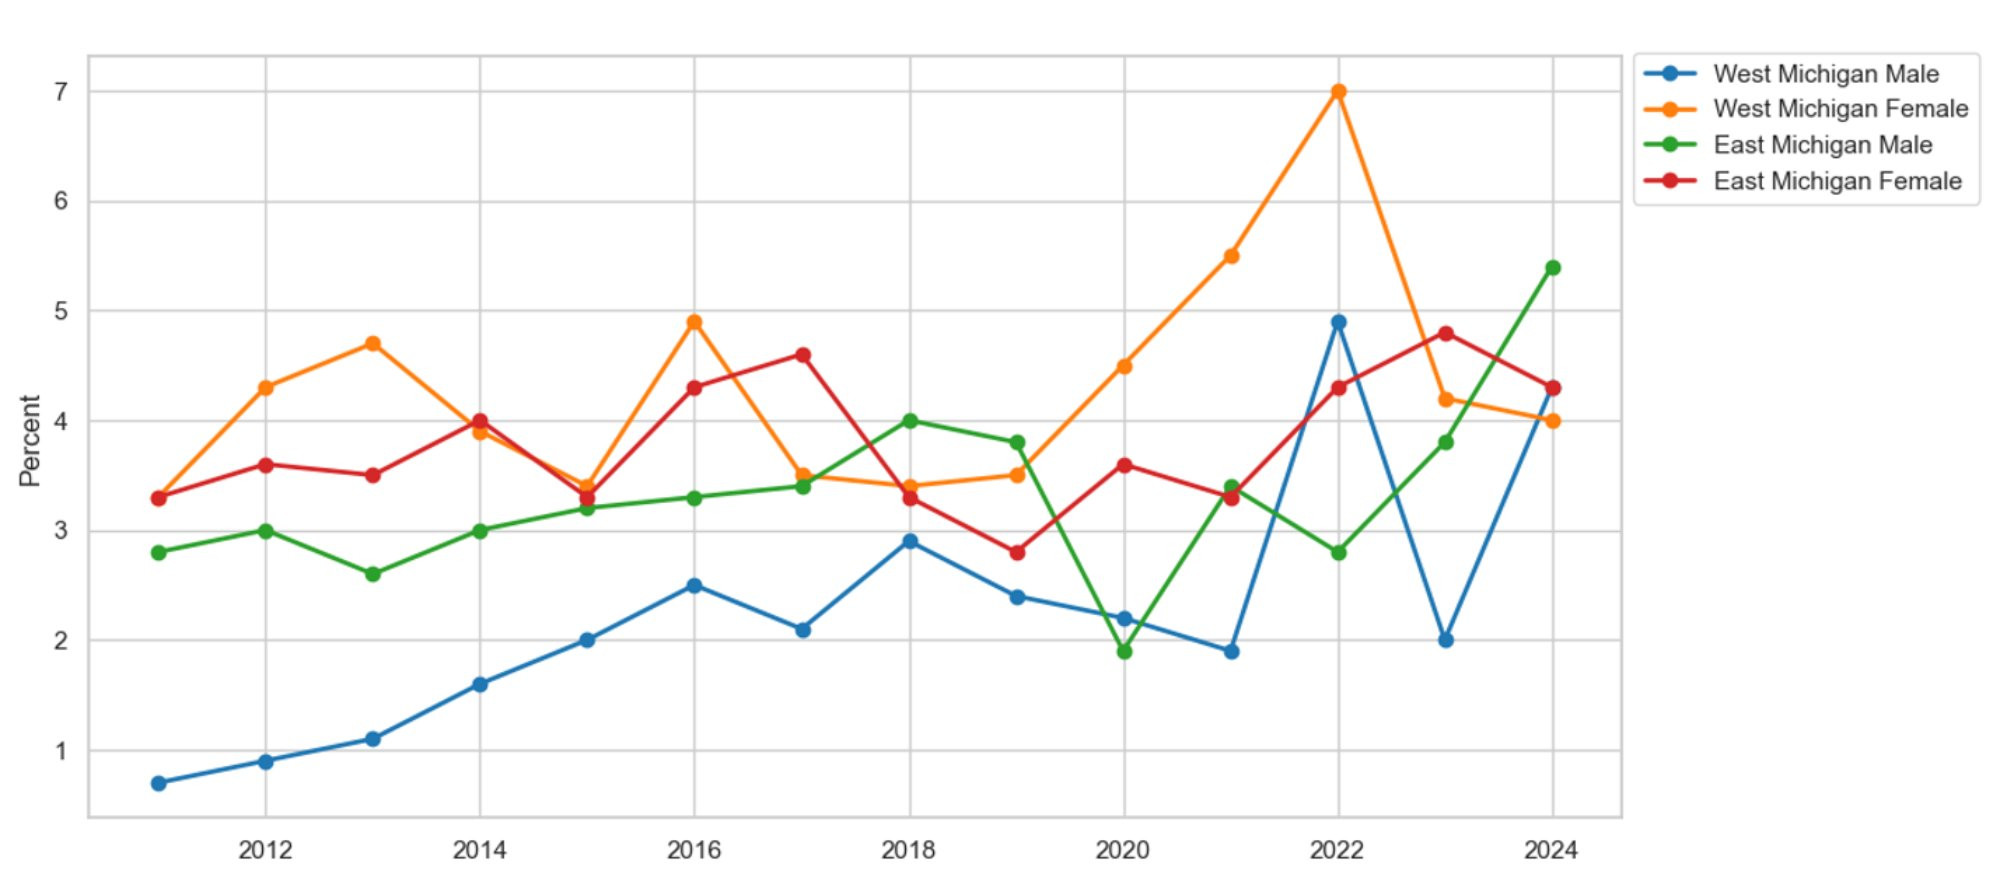
Description: Figure 20 displays the proportion of survey respondents who report having a kidney disease diagnosis by gender in East and West Michigan. On average, females report a higher prevalence of kidney disease than males in West Michigan. Additionally, kidney disease has been increasing among males since 2011, regardless of location.
Source: Michigan Department of Health and Human Services, Behavioral Risk Factor Surveillance System, 2011-2024
Depression and Poor Mental Health
Figure 21 shows the percentage of residents in East and West Michigan diagnosed with depression. The depression rate in both areas remained relatively steady until the COVID-19 pandemic began in 2020, when it rose significantly. Since then, 7.7 percent more people in West Michigan report having been diagnosed with depression. In 2020, 16.5 percent of East Michiganders reported depression, but by 2024, that number increased to 24.6 percent. Comparing regions, the data suggest that depression is more common among West Michiganders than East Michiganders. On average, 3.8 percent more residents in West Michigan report a depression diagnosis compared to their East Michigan counterparts. Furthermore, we analyze depression by race and gender.
Figure 21: Depression by Region
Description: Figure 21 displays the proportion of survey respondents who report having a depression diagnosis in East and West Michigan. On average, depression is more prevalent in West Michigan than in East Michigan. Additionally, depression has been increasing in East and West Michigan since the onset of the COVID-19 pandemic in 2020.
Source: Michigan Department of Health and Human Services, Behavioral Risk Factor Surveillance System, 2011-2024
Figure 22 highlights the prevalence of depression by race and region. A data transformation warrants comment. For our non-white series, we add the proportion of residents reporting 14 or more poor mental health days, noting that minorities are less likely to seek professional help and are therefore less likely to receive a depression diagnosis (Panchal et al., 2024). We find that depression is up among all races and regions, except for those non-white residents in West Michigan. For example, since 2011, 6.3 percent more West Michigan whites report a depression diagnosis; however, this increase in depression pales in comparison to the rise in depression among East Michigan non-whites. Since 2011, depression within East Michigan’s non-white community has increased by 16.1 percent. Furthermore, the graphs also highlight the racial disparity in depression. On average, 16.1 percent more non-white residents report depression compared to white residents in West Michigan. Similarly, 12.9 percent more non-whites report depression than whites in East Michigan.
Figure 22: Depression by Race
Description: Figure 22 displays the percentage of survey respondents by race in East and West Michigan who report having a depression diagnosis or experiencing 14 or more poor mental health days in the past month. On average, non-white residents report a higher rate of depression than their white counterparts in both regions.
Source: Michigan Department of Health and Human Services, Behavioral Risk Factor Surveillance System, 2011-2024
Figure 23 shows the prevalence of depression by gender and region. Similar to the racial transformation applied to the depression data, we redefine the male series by adding the proportion of survey respondents reporting 14 or more poor mental health days, which aligns with research indicating that men are less likely to seek help and therefore get a depression diagnosis (Mayo Clinic, 2024). Again, we see that depression rates remained stable until the COVID-19 pandemic in 2020, when rates by gender and region started to increase sharply. The increase in depression is especially noticeable among women. For example, since 2020, female depression rates have risen by 12.4 percent in West Michigan and 7.4 percent in East Michigan. To explain the rise in depression, we consider alcohol consumption as a potential causal factor.
Figure 23: Depression by Gender
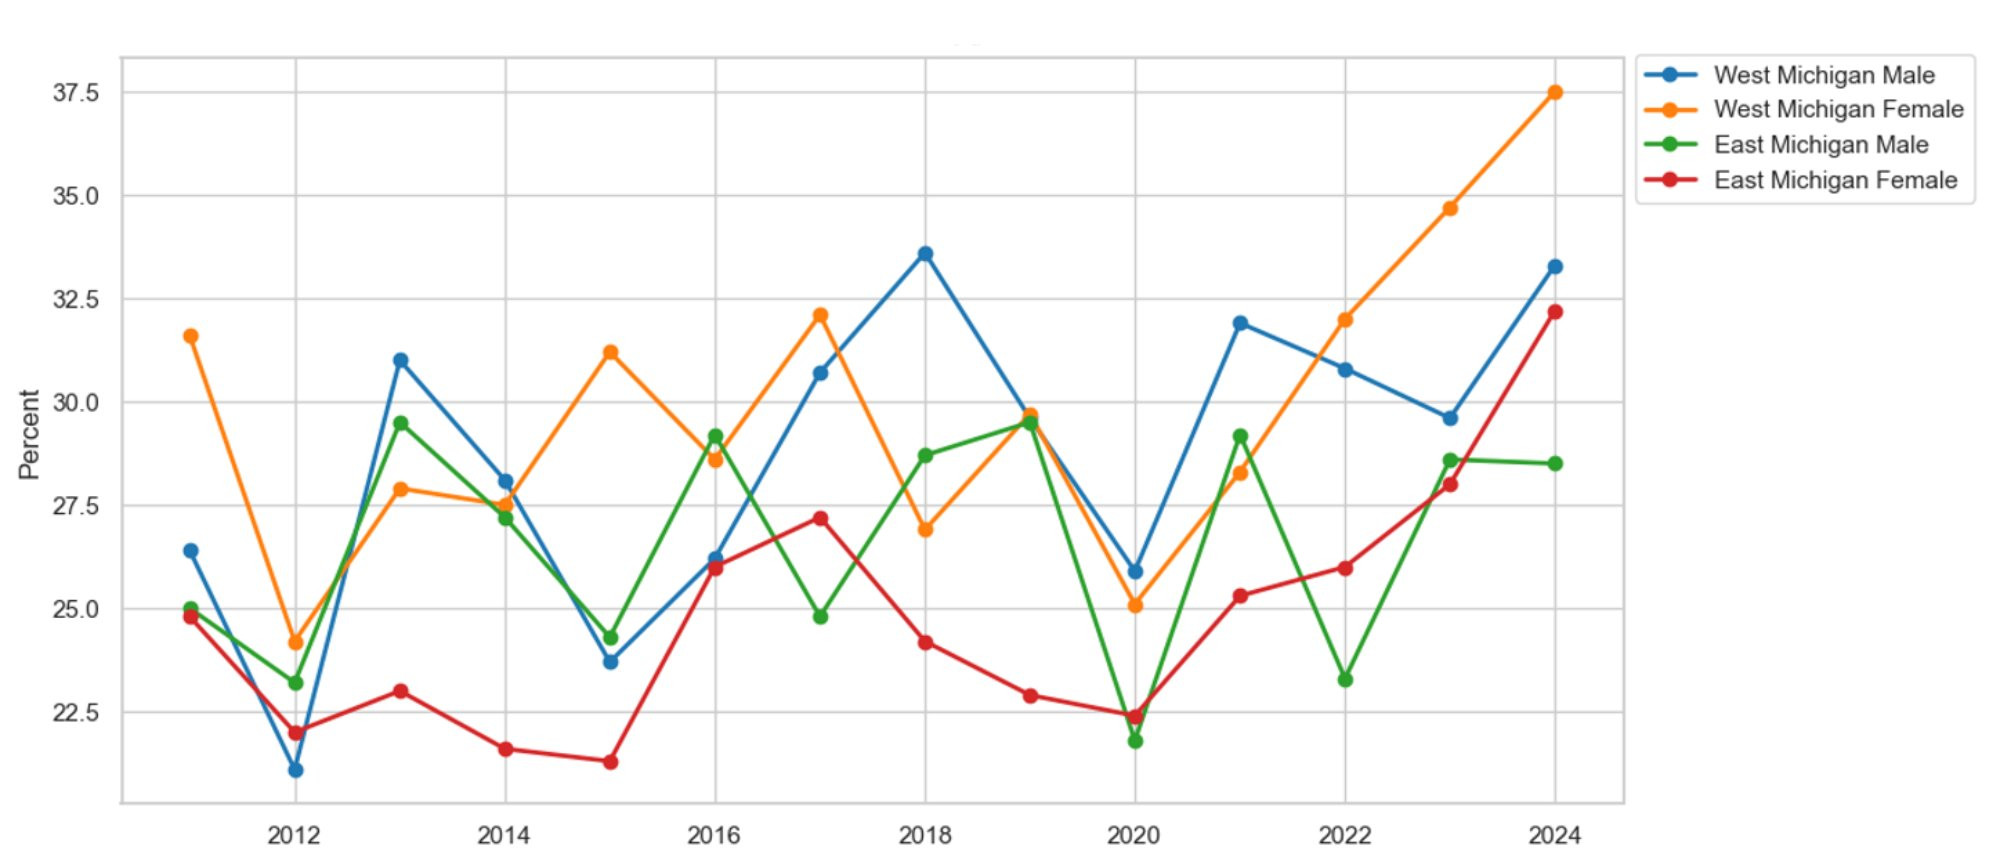
Description: Figure 23 displays the percentage of survey respondents by gender in East and West Michigan who report having a depression diagnosis or experiencing 14 or more poor mental health days in the past month. On average, depression has been increasing regardless of gender and region, with no apparent difference between genders.
Source: Michigan Department of Health and Human Services, Behavioral Risk Factor Surveillance System, 2011-2024
Figure 24 shows the percentage of survey respondents who reported drinking alcohol in the past month by region. Alcohol consumption has stayed relatively stable since 2011. However, drinking seems to be more common in West Michigan than in East Michigan. On average, 2.5 percent more West Michiganders drink than their East Michigan counterparts, which is not surprising, given that Grand Rapids is known as Beer City, USA. To comment on racial and gender disparities in drinking, we break down alcohol consumption by race and gender.
Figure 24: Alcohol Consumption by Region
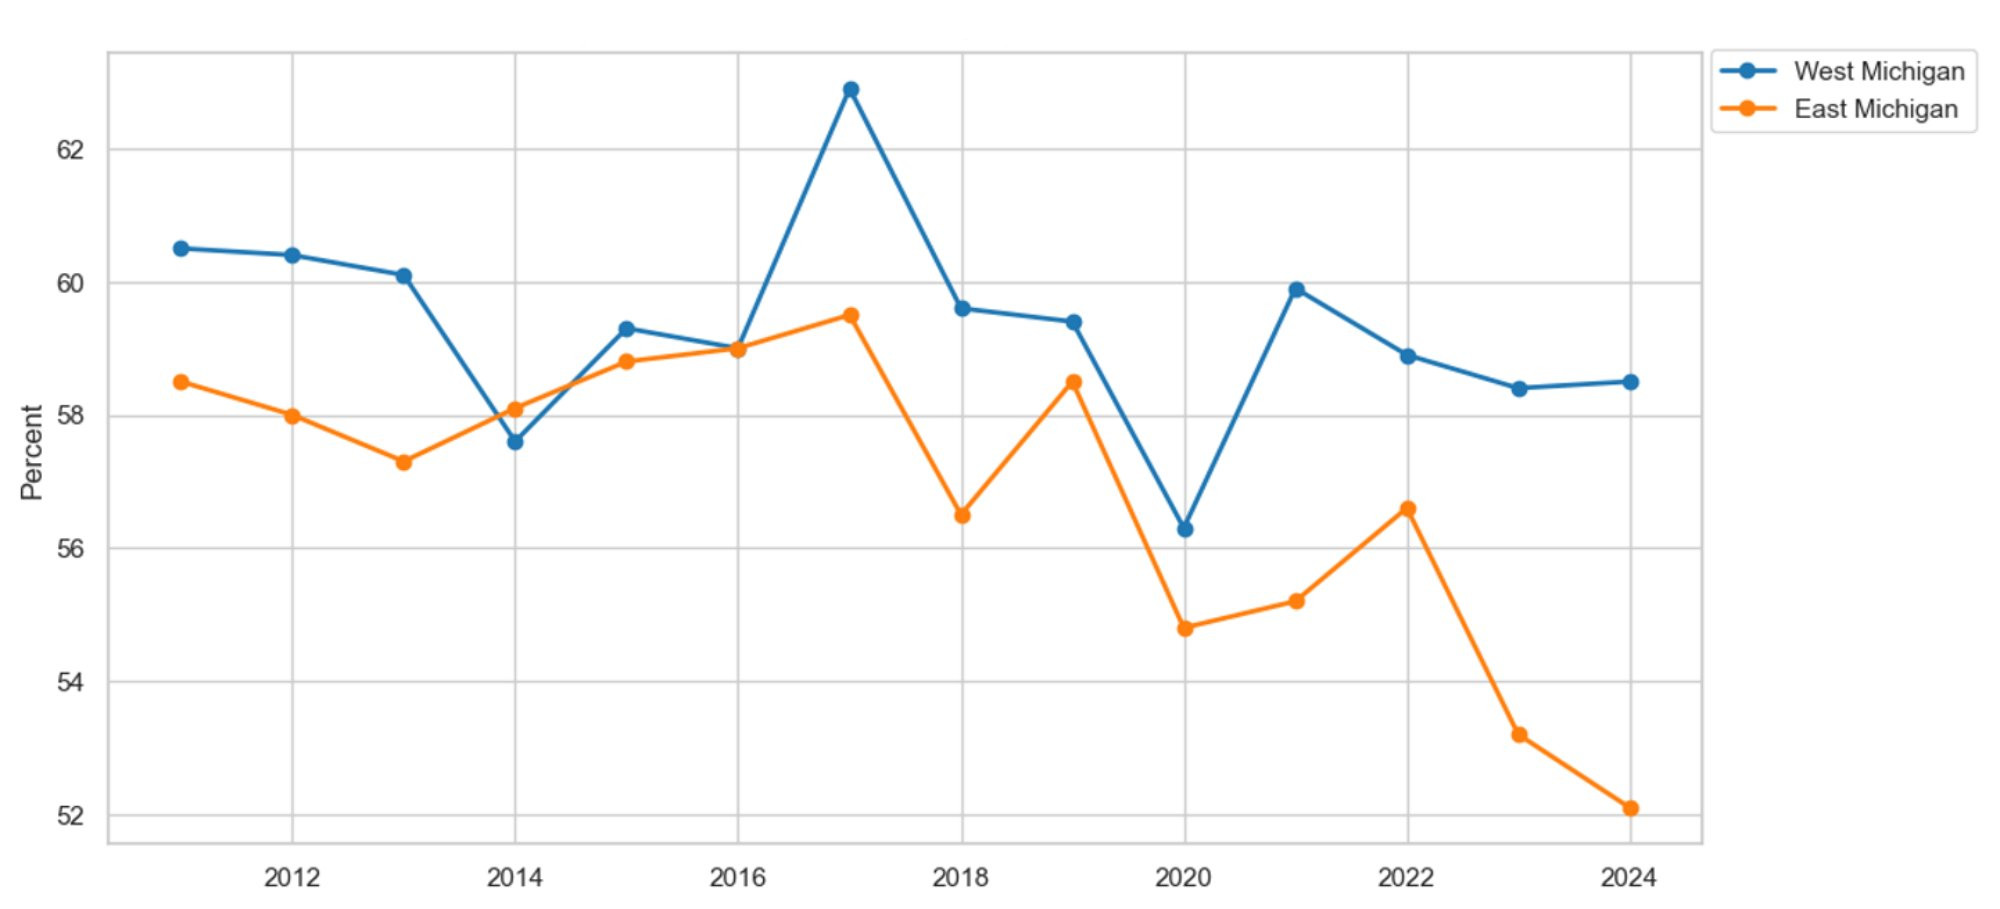
Description: Figure 24 displays the percentage of survey respondents who report having consumed alcohol in the past month in East and West Michigan. On average, alcohol consumption is higher in West Michigan than in East Michigan. Additionally, alcohol consumption is declining in East Michigan, while it remains relatively stable in West Michigan.
Source: Michigan Department of Health and Human Services, Behavioral Risk Factor Surveillance System, 2011-2024
Figure 25 illustrates the percentage of survey respondents who reported drinking alcohol in the past month, broken down by race and region. White residents are significantly more likely to drink than their non-white counterparts. On average, 12.6 percent more white residents drink alcohol than non-white residents in West Michigan. Additionally, 10.6 percent more white East Michiganders drink alcohol compared to non-white East Michiganders. There is an apparent racial disparity in alcohol consumption, with rates higher among white citizens than non-white citizens. Figure 26 shows the prevalence of alcohol use by gender and region. The data clearly reveal a gender gap, with males consuming more alcohol than females in both regions. On average, 8.6 percent more males drink compared to females in West Michigan. Similarly, among East Michiganders, 9 percent more males consume alcohol than females. Alcohol consumption may plausibly explain the rise in depression among West Michiganders.
Figure 25: Alcohol Consumption by Race
Description: Figure 25 displays the percentage of survey respondents who reported drinking alcohol in the past month by race in East and West Michigan. On average, white residents report a higher rate of drinking than non-white residents in both regions.
Source: Michigan Department of Health and Human Services, Behavioral Risk Factor Surveillance System, 2011-2024
Figure 26: Alcohol Consumption by Gender
Description: Figure 26 displays the percentage of survey respondents who reported drinking alcohol within the last month by race in East and West Michigan. On average, males report a higher rate of drinking than females in both regions.
Source: Michigan Department of Health and Human Services, Behavioral Risk Factor Surveillance System, 2011-2024
Healthcare Cost, Insurance, and Checkups
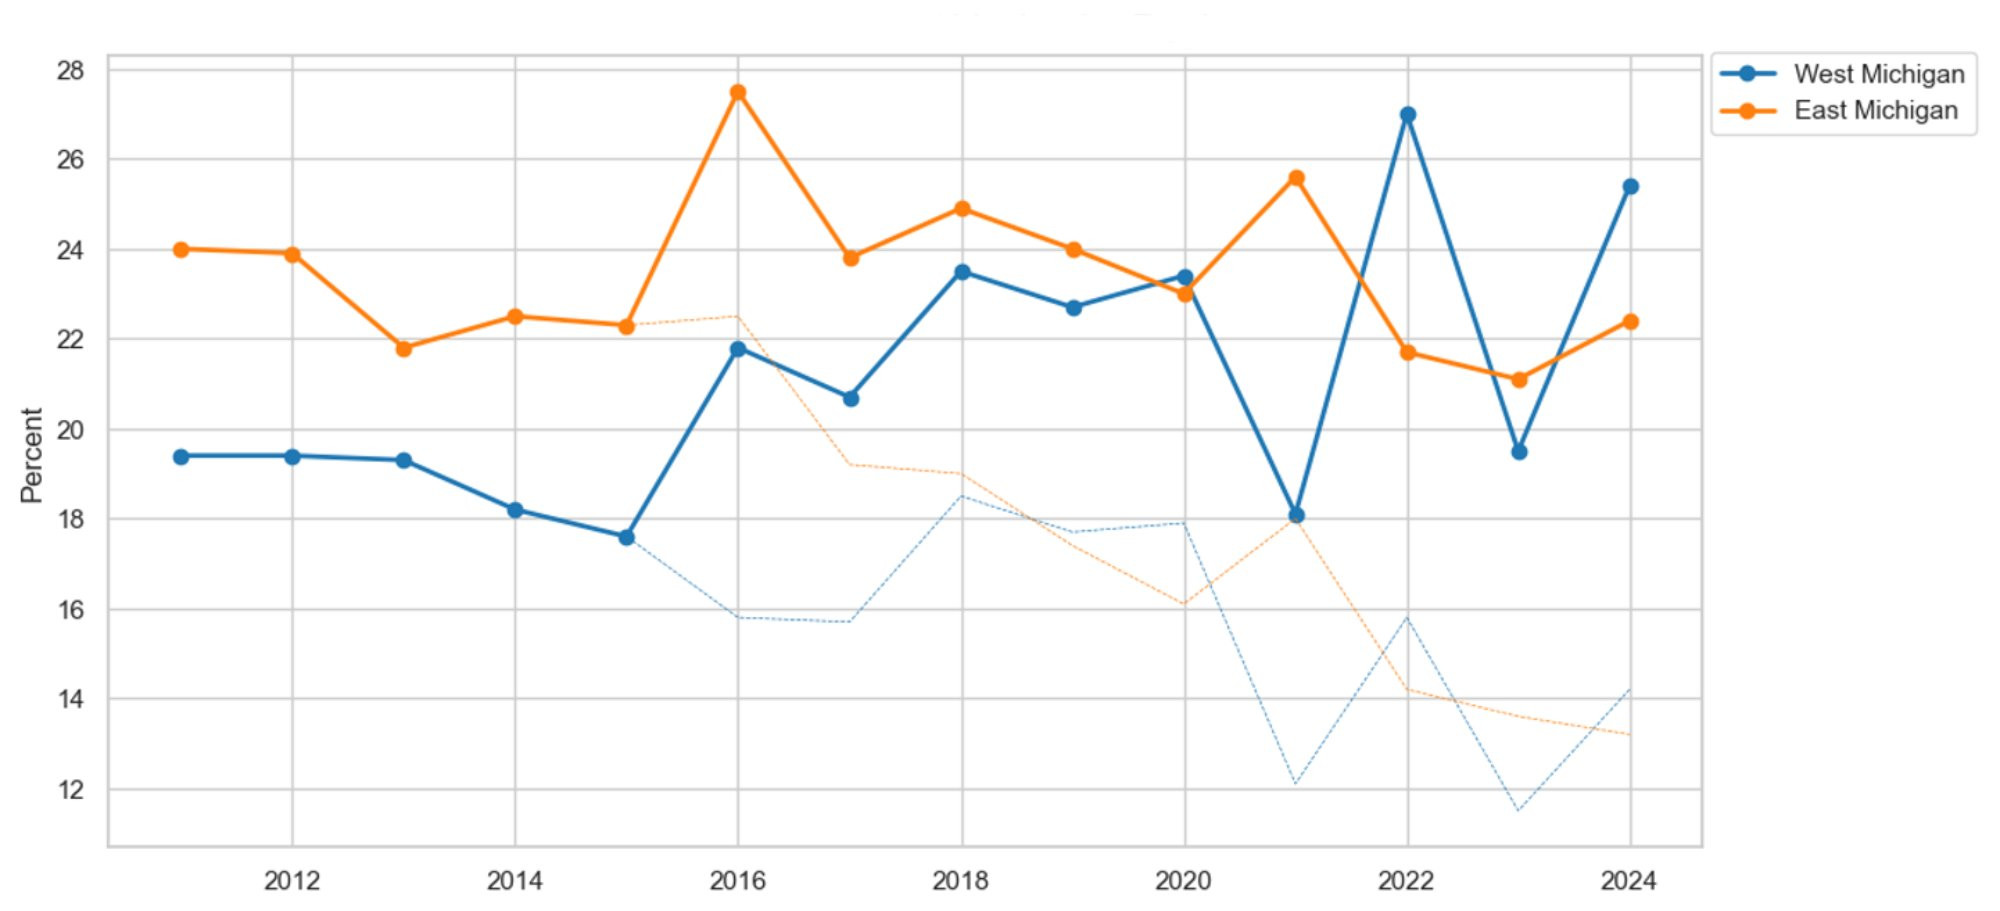
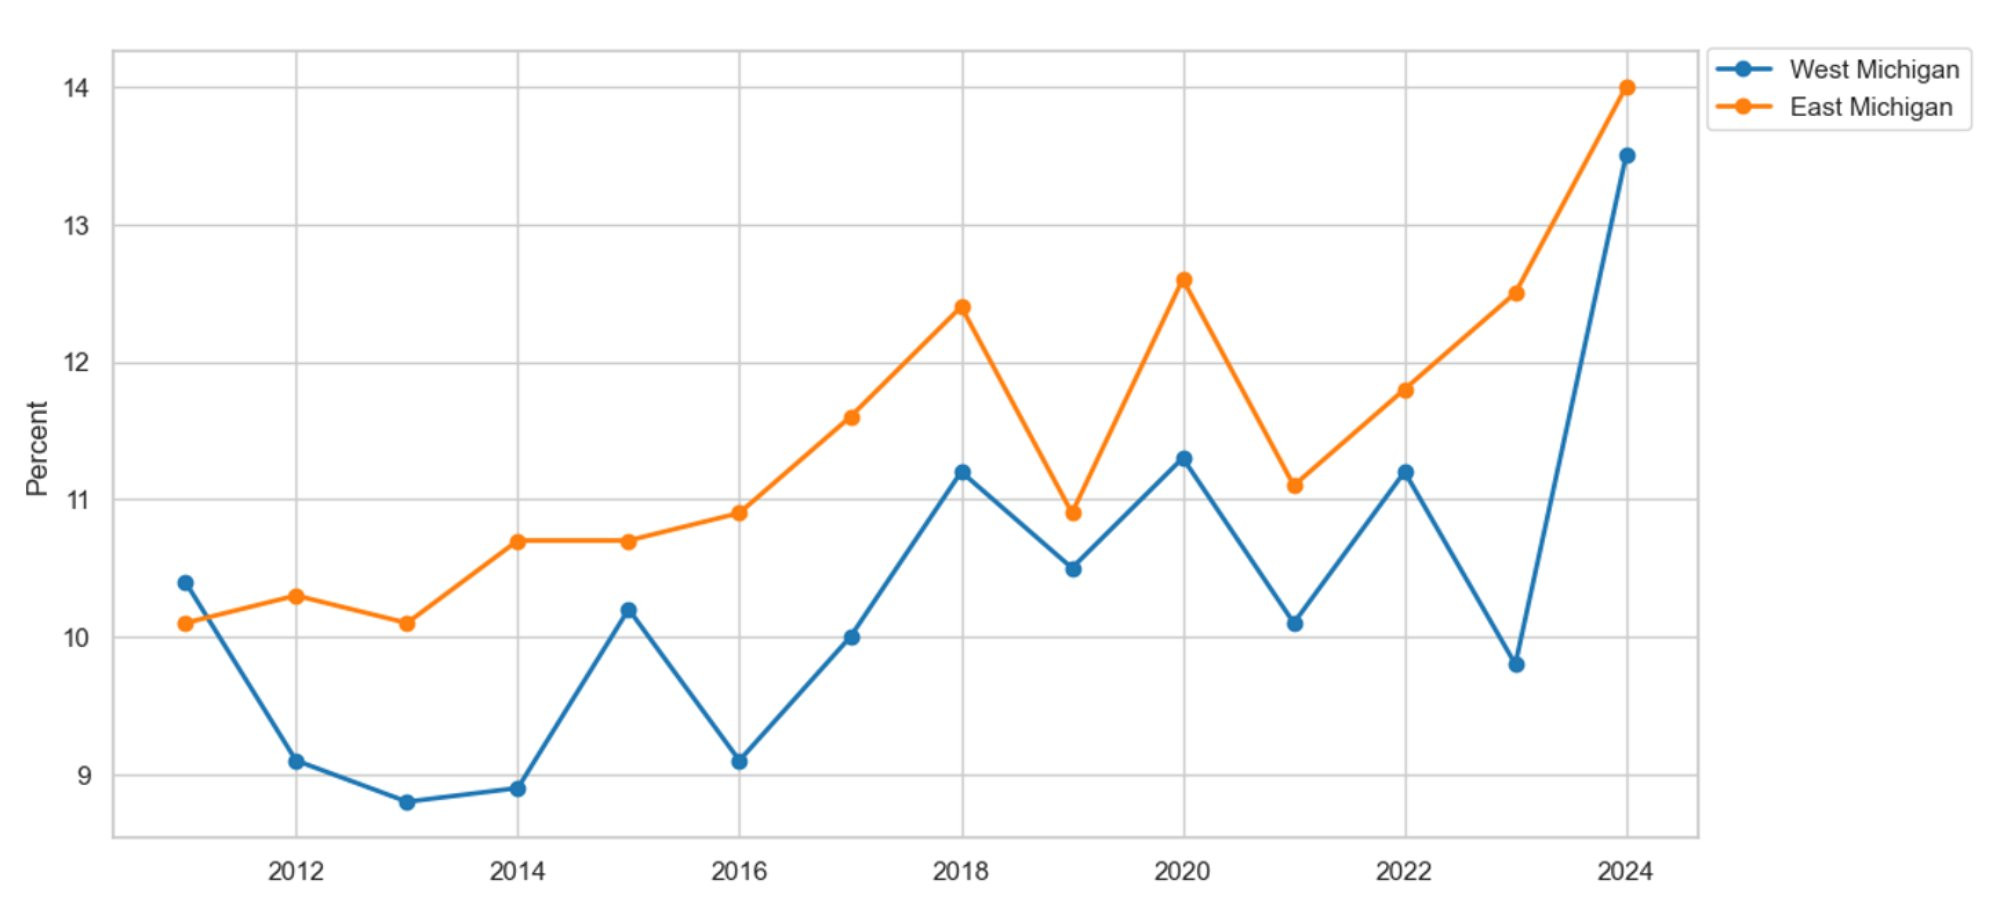
Now, we turn from different disease-prevalence metrics to the impact of the economy on our consumers. First, we focus on patients who choose to delay care due to cost. Figure 27 shows the share of survey respondents who delay care because of cost, broken down by region. The graph highlights the challenges caused by the COVID-19 pandemic. Before the pandemic and after the Great Recession, healthcare became more affordable, as shown by a decrease in the percentage of people delaying care due to cost from 2011 to 2020. However, with the start of the pandemic in 2020, healthcare has become less affordable, leading more people to delay care due to costs, which is consistent with the empirical literature on delayed care during the pandemic (Aslim et al., 2022; Gonzalez et al., 2021; Song, et al., 2021). Since 2021, 5.1 percent more West Michiganders report delaying care due to cost. At the same time, 3.7 percent more East Michiganders have delayed care due to cost. Furthermore, we break down delayed care by race and gender. However, we report only on racial differences, not on gender differences, because there are few differences between the sexes. Figure 28 graphs delayed care due to cost by race and region. All series appear to follow the regional trends. However, delayed care due to cost remained high for West Michigan’s non-white residents throughout the COVID-19 pandemic. Furthermore, to delve into this phenomenon, we examine which types of care are being delayed and the economic factors that influence the decision to seek care.
Figure 27: No Care Due to Cost by Region
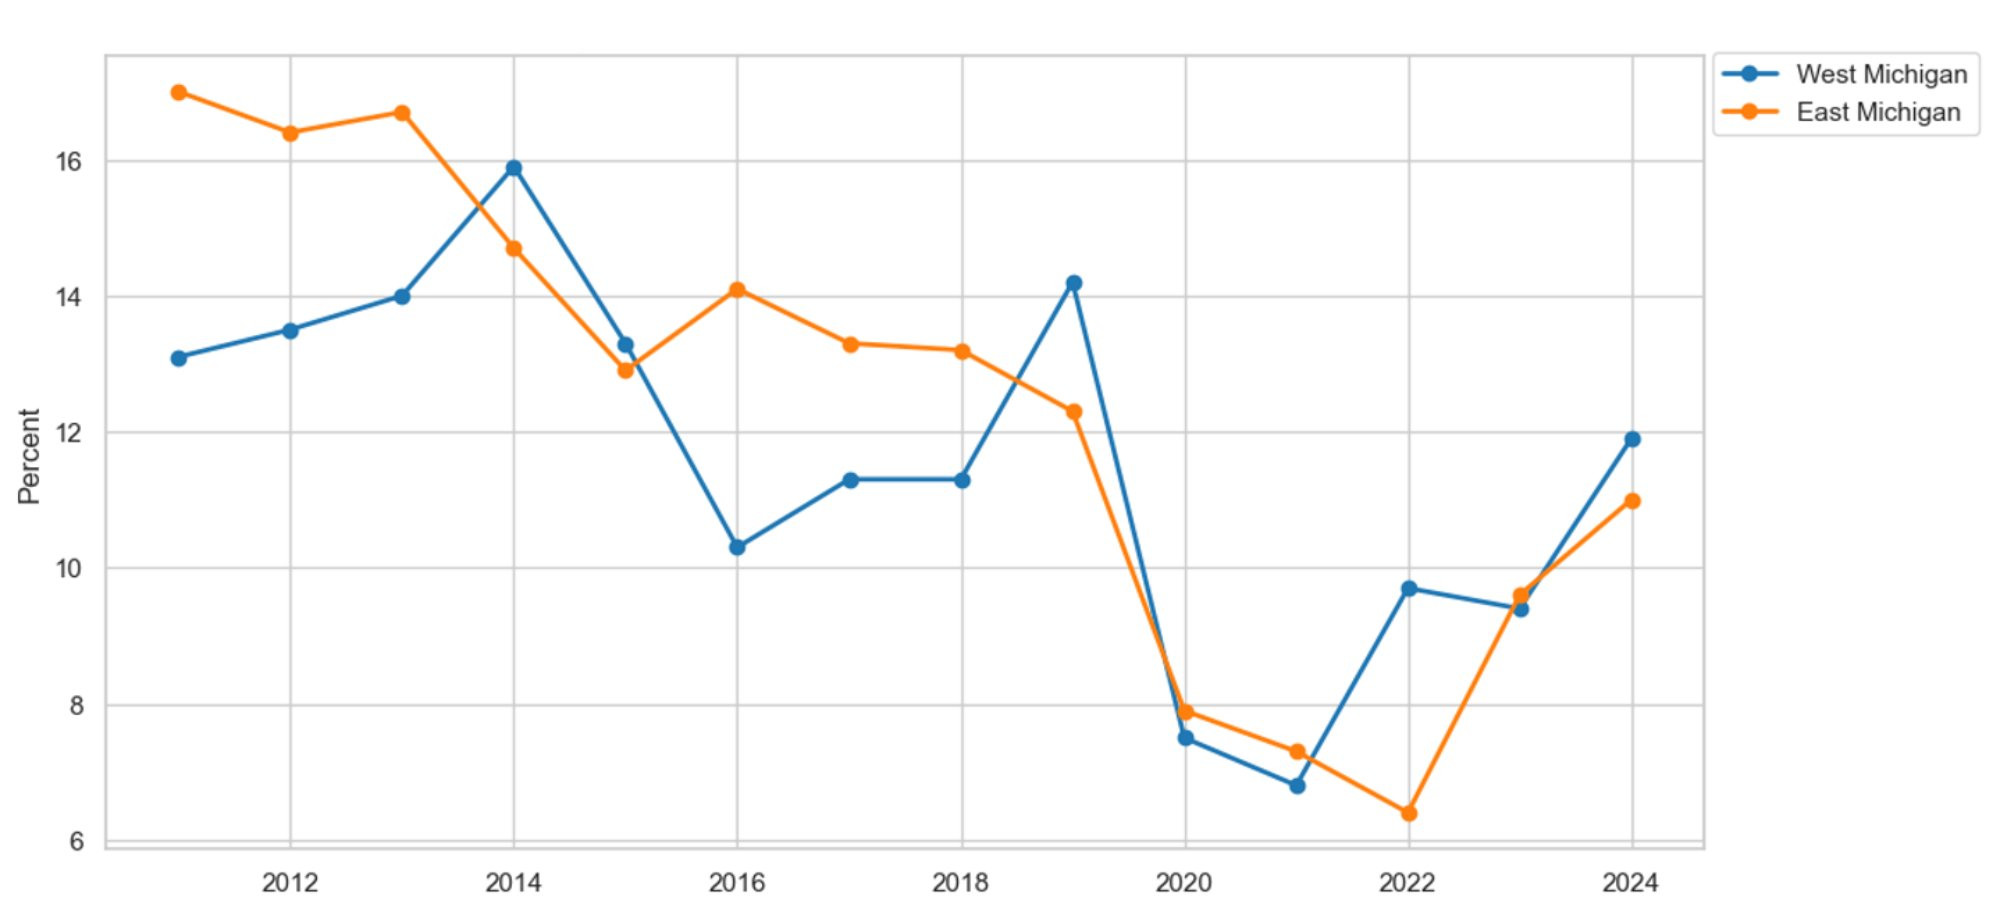
Description: Figure 27 shows the percentage of survey respondents in East and West Michigan who report needing to see a doctor but are prevented from doing so by cost. Overall, the rate of patients delaying care due to cost has decreased in East and West Michigan since 2011. However, since the start of the COVID-19 pandemic in 2020, more patients have been delaying needed care due to expense.
Source: Michigan Department of Health and Human Services, Behavioral Risk Factor Surveillance System, 2011-2024
Figure 28: No Care Due to Cost by Race
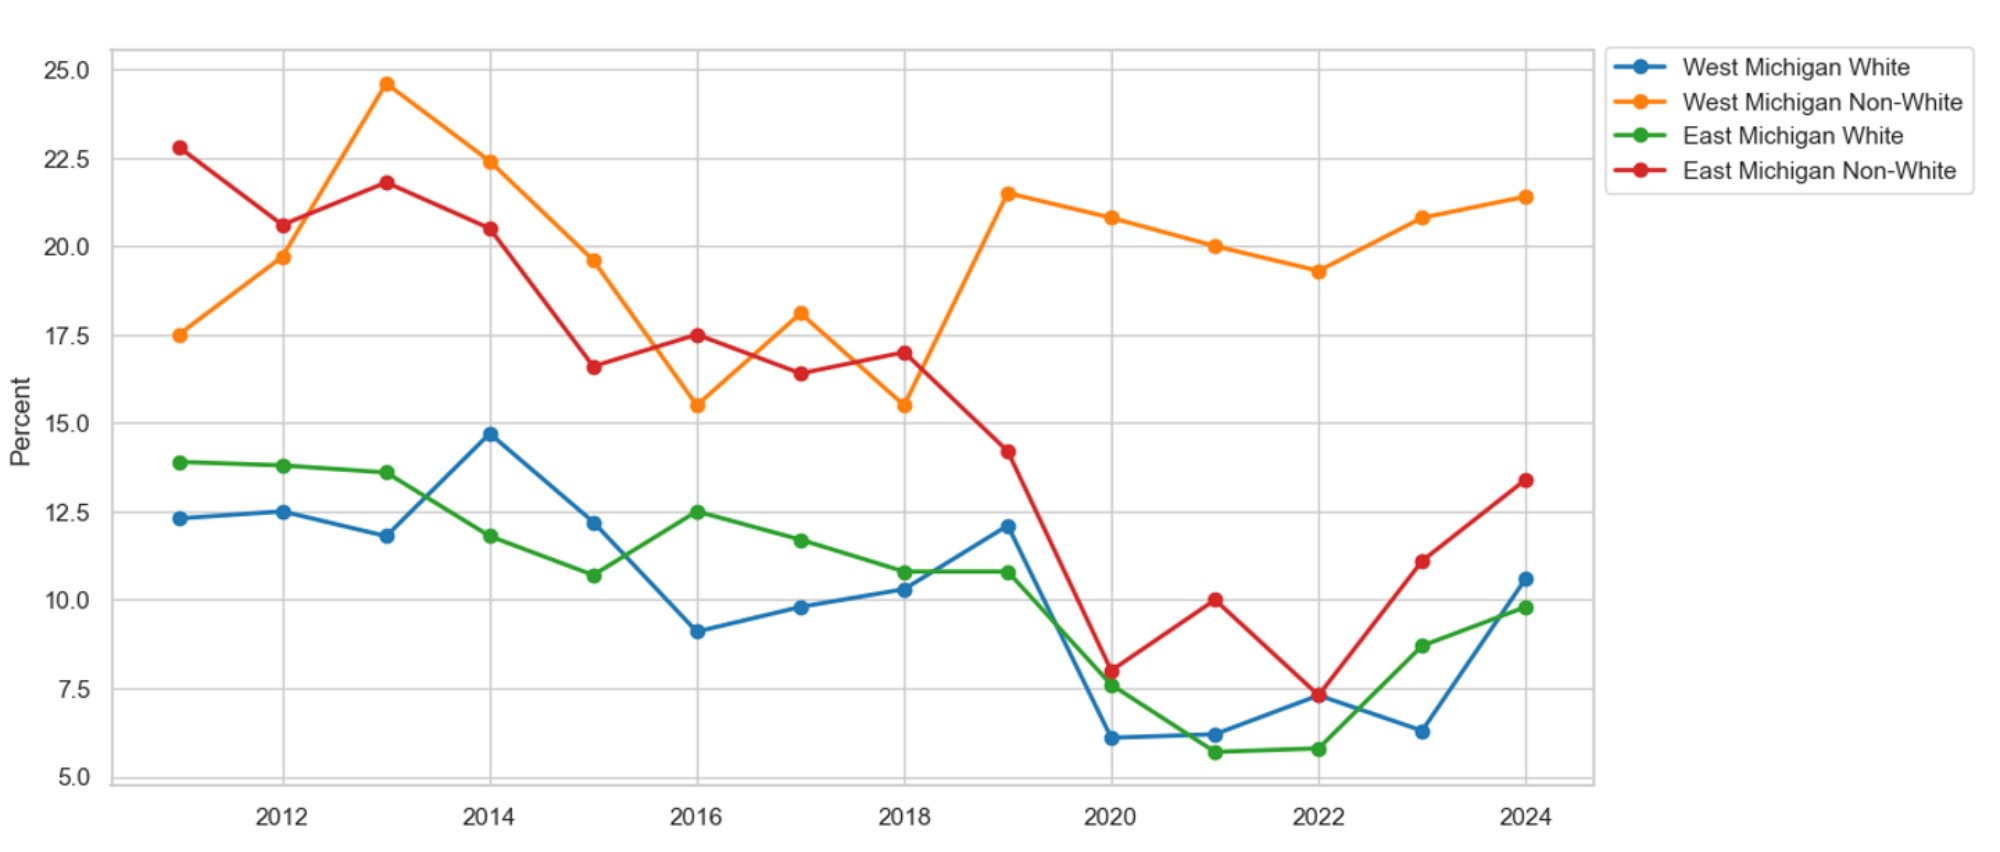
Description: Figure 28 shows the percentage of survey respondents in East and West Michigan, by race, who report needing to see a doctor but are unable to due to cost. Overall, the rate of patients delaying care because of cost has declined across all races and regions, except among non-white patients in West Michigan, which has stayed stable and remains higher than any other demographic.
Source: Michigan Department of Health and Human Services, Behavioral Risk Factor Surveillance System, 2011-2024
Figure 29 displays the regional inflation rates using the implicit price deflator from the U.S. Bureau of Economic Analysis. We compare these inflation rates to the Federal Reserve's (Fed) 2 percent inflation target for a healthy economy. On average, we find that the actual inflation rates before the COVID-19 pandemic were significantly below the Federal Reserve's historical target, indicating that healthcare was more affordable prior to the recent recession. Since the start of the pandemic, however, the average inflation rate of 4.9 percent has been more than twice the Fed's target, suggesting that households are feeling the financial strain and may postpone care due to cost concerns.
Figure 29: Inflation Rate
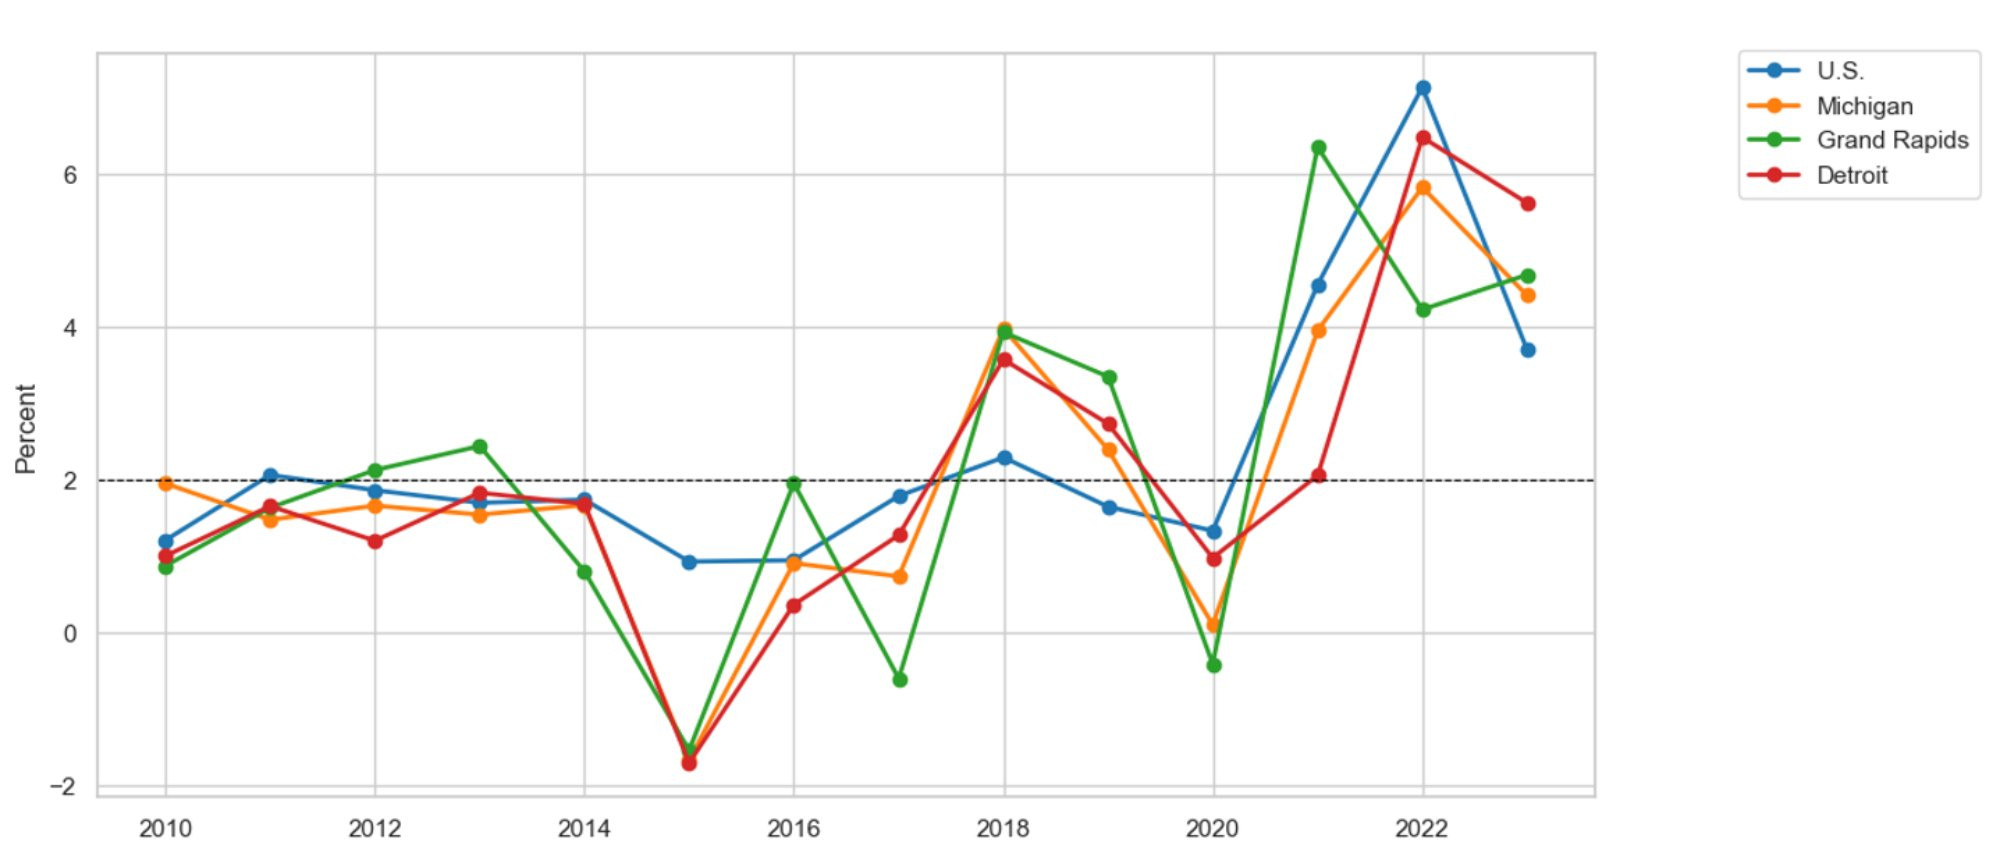
Description: Figure 29 shows the inflation rate based on the implicit price deflator in the U.S., Michigan, Grand Rapids, and Detroit. On average, the inflation rate before the COVID-19 pandemic in 2020 was below the Federal Reserve's target for a healthy economy. Since the start of the COVID-19 pandemic, however, the inflation rate has been twice the Federal Reserve’s historical target.
Source: U.S. Bureau of Economic Analysis, Federal Reserve Bank of St. Louis
Another factor influencing the cost of care is whether a patient has health insurance to cover part or all of a procedure. Figure 30 shows the proportion of survey respondents with health insurance coverage. Since 2011, the number of people covered by health insurance has increased in both East and West Michigan. However, since the start of the pandemic, the number of people with coverage has decreased in East Michigan and remained stable in West Michigan. Therefore, the rise in delayed care due to cost may partly result from a decline in insurance coverage, which would lead to higher out-of-pocket expenses for uninsured individuals. A similar pattern appears in the racial data.
Figure 30: Covered by Health Insurance by Region
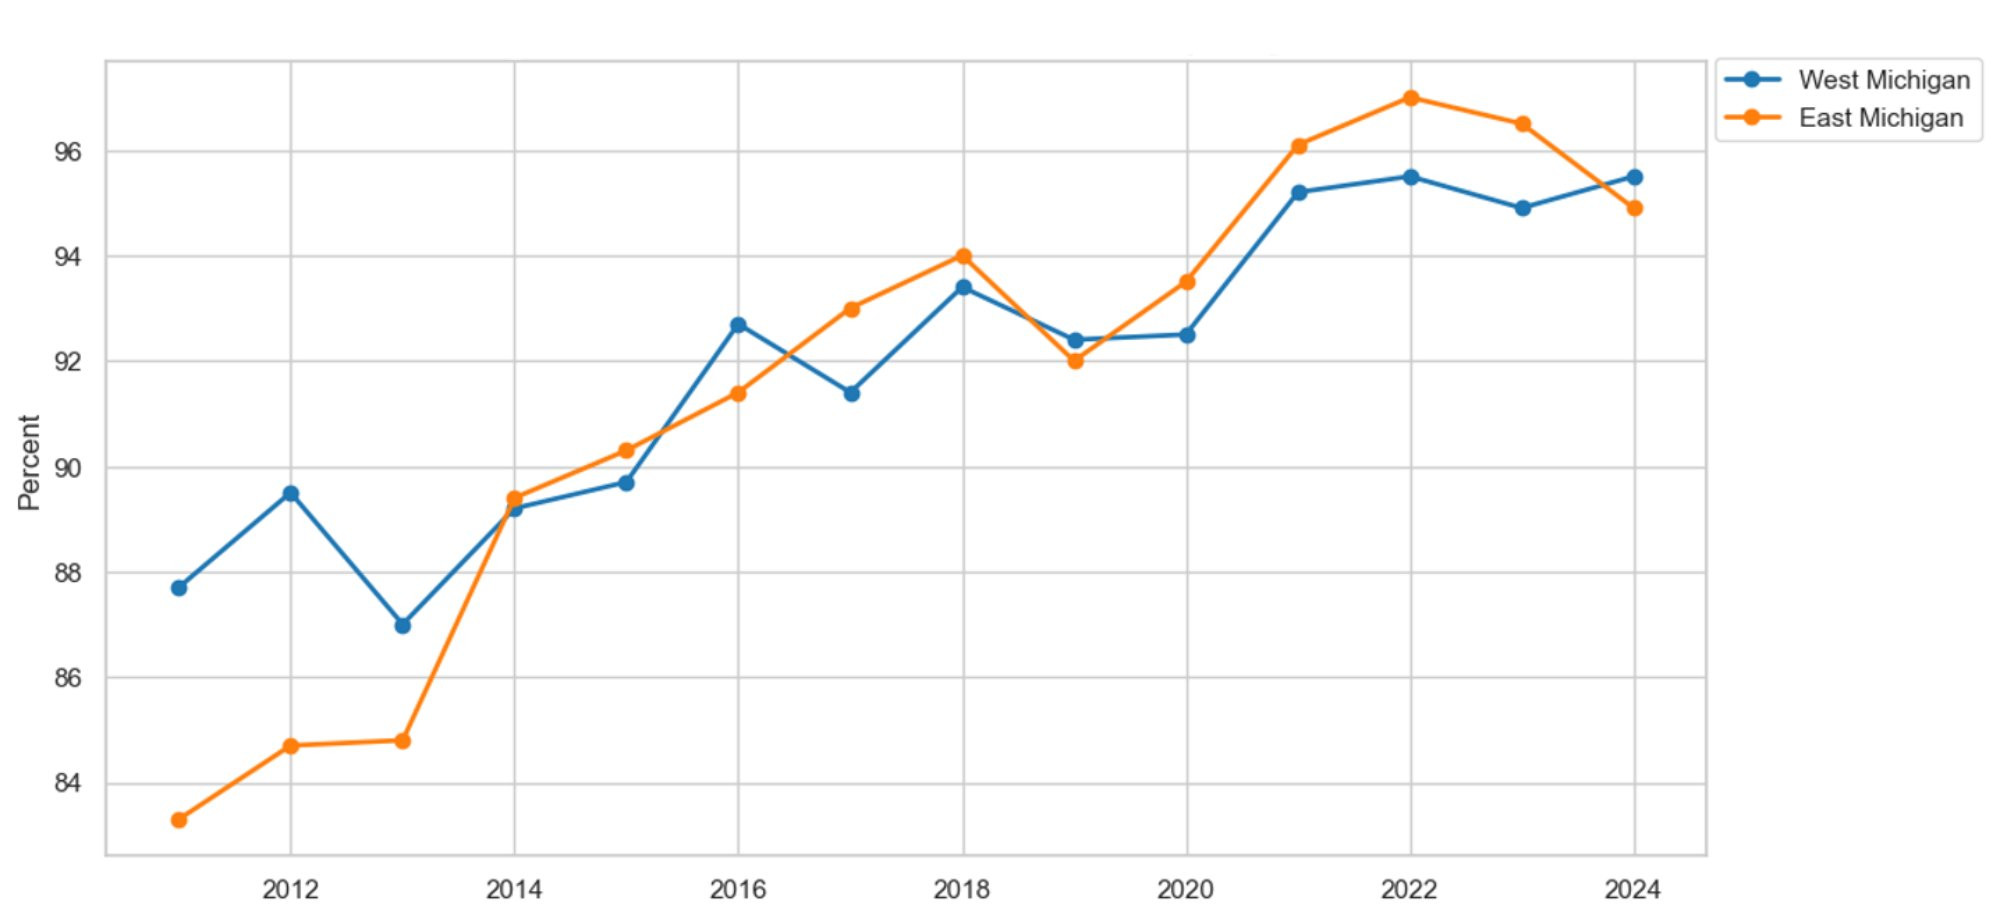
Description: Figure 30 shows the percentage of survey respondents in East and West Michigan who report having health insurance. On average, the proportion of the population covered by health insurance has increased in both regions since 2011. However, since 2022, health insurance coverage has been declining in both areas.
Source: Michigan Department of Health and Human Services, Behavioral Risk Factor Surveillance System, 2011-2024
Figure 31 displays health insurance coverage by race and region. Once again, the data show that, regardless of race and region, insurance coverage has decreased since the start of the pandemic. This decline is especially noticeable among West Michigan’s non-white population. Since 2020, 8.3 percent fewer non-white residents in West Michigan have health insurance, which can result in higher out-of-pocket costs and delayed care.
Figure 31: Covered by Health Insurance by Race
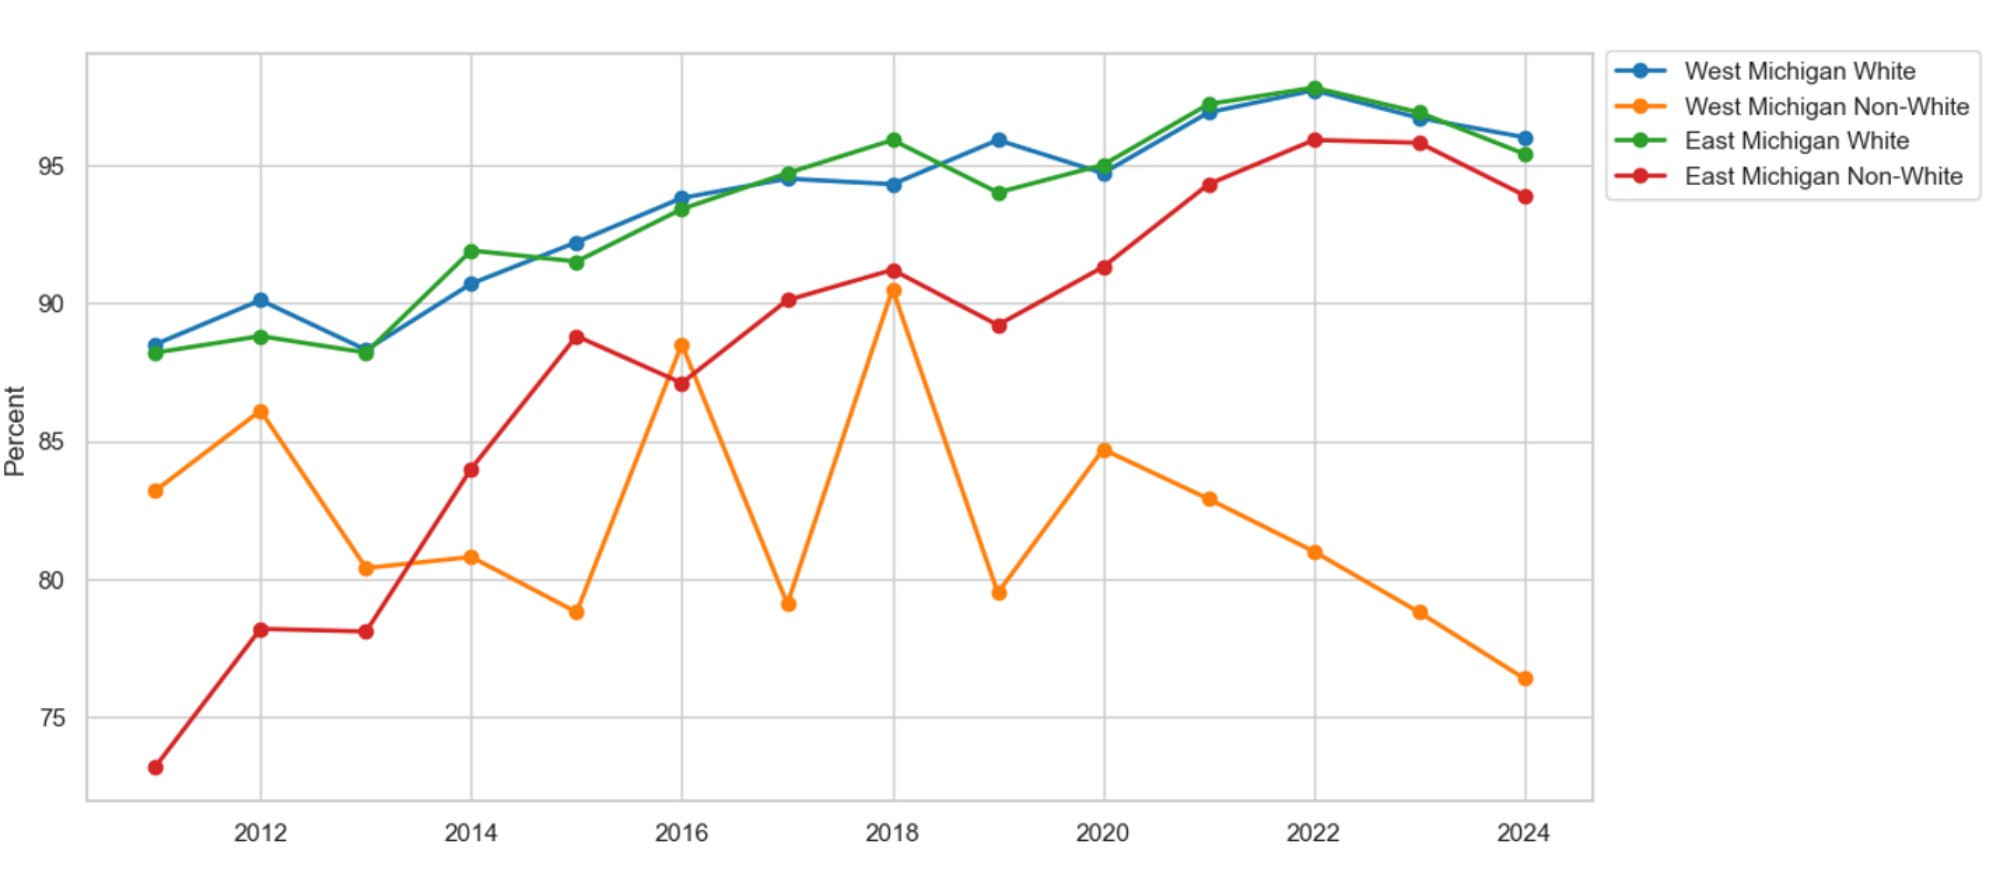
Description: Figure 31 displays the percentage of survey respondents in East and West Michigan who report having health insurance by race. Overall, the rate of the population with health insurance has increased across races and regions, except among West Michigan’s non-white residents, who have experienced a decline in coverage since the pandemic began in 2020.
Source: Michigan Department of Health and Human Services, Behavioral Risk Factor Surveillance System, 2011-2024
Lastly, we examine the types of care being postponed. Are patients delaying routine procedures, such as annual checkups covered by health insurance, or postponing elective procedures that insurance providers cover less frequently? Figure 32 displays the percentage of survey respondents who had an annual checkup in the past year by region. On average, routine checkups increased by 13.4 percent in East and West Michigan, respectively, indicating that those delaying care are more likely to postpone elective procedures that may not be fully covered by insurance. Figure 33 shows routine checkups by gender and region, noting that checkups by race show little variation between races. However, a gender gap exists in routine checkups, with women more likely than men to have a checkup in both regions. On average, 9.3 percent more women than men received a checkup in West Michigan. Similarly, in East Michigan, the female checkup rate is 8.1 percent higher than the male rate.
Figure 32: Routine Checkup by Region
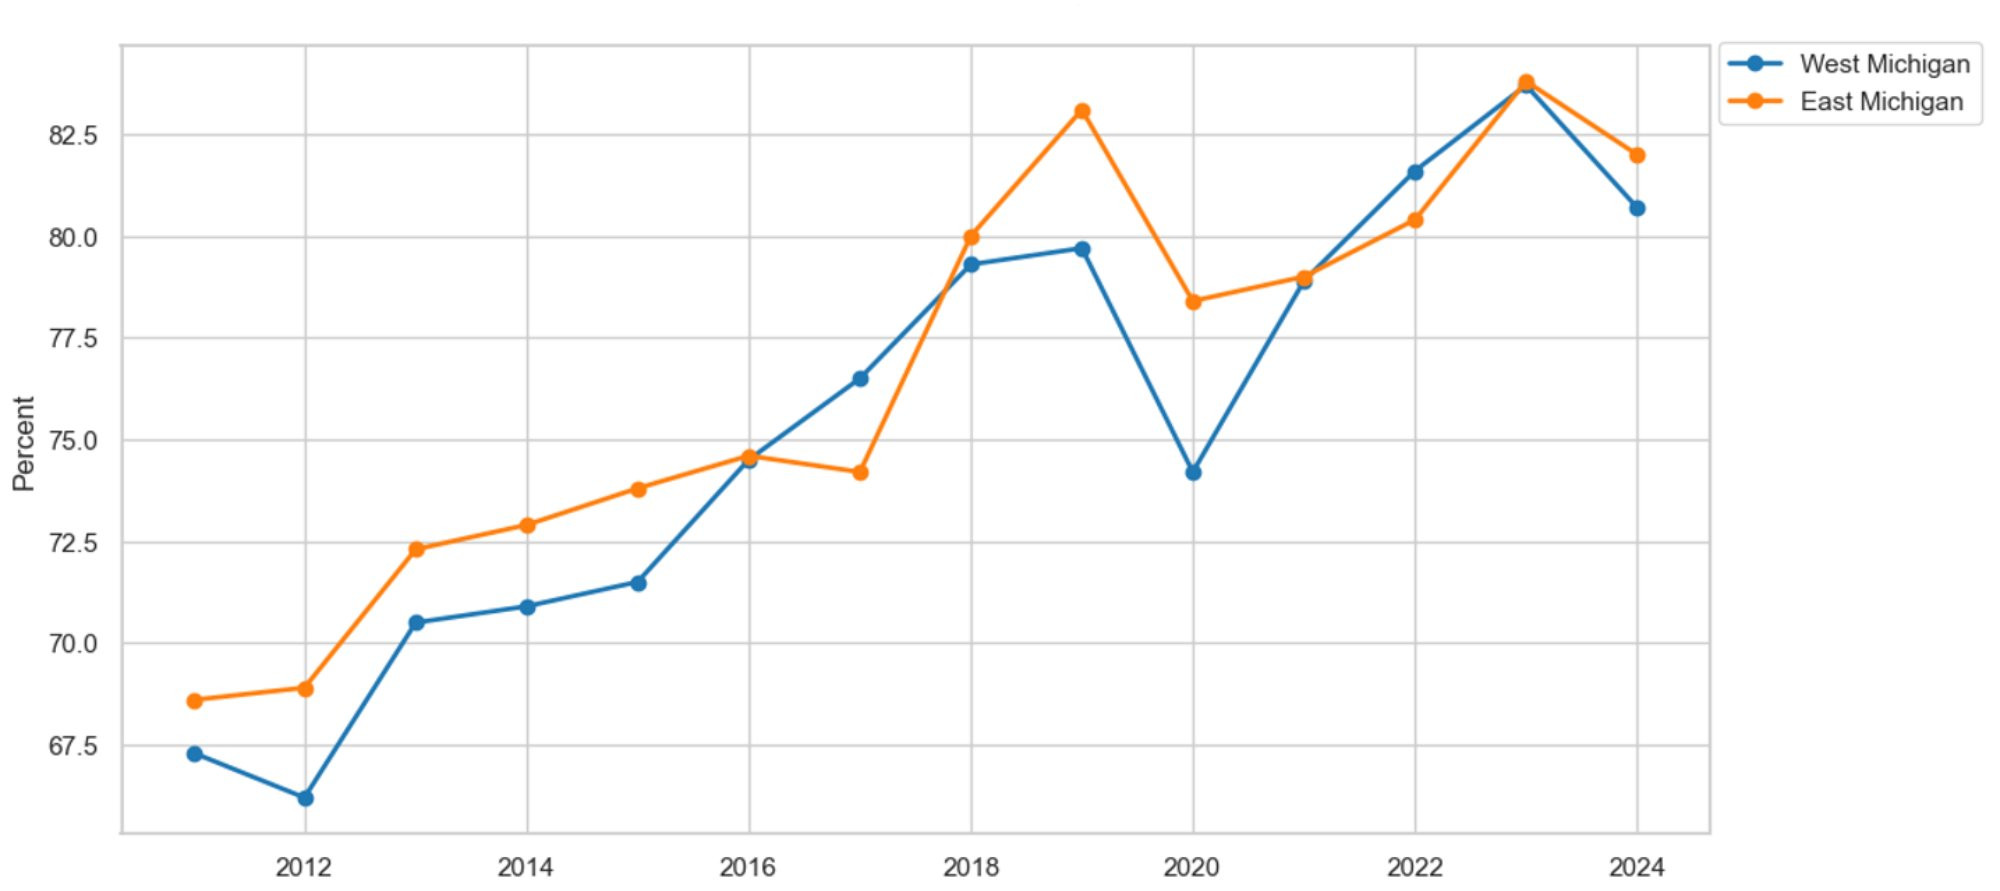
Description: Figure 32 shows the percentage of survey respondents in East and West Michigan who report having had a routine checkup within the past year. On average, routine checkup rates have increased in both regions since 2011. However, since 2023, routine checkups have declined in both areas.
Source: Michigan Department of Health and Human Services, Behavioral Risk Factor Surveillance System, 2011-2024
Figure 33: Routine Checkup by Gender
Description: Figure 33 shows the percentage of survey respondents in East and West Michigan who report having had a routine checkup within the past year by gender. On average, women are more likely than men to get routine checkups, regardless of region.
Source: Michigan Department of Health and Human Services, Behavioral Risk Factor Surveillance System, 2011-2024
References
Alliance Clinical Network. (2025). History of GLP-1 Approvals in the U.S. Retrieved from https://allianceclinicalnetwork.com/history-of-glp-1-approvals-in-the-u-s/
Aslim, E. G., Fu, W., Liu, C. L., & Tekin, E. (2022). Vaccination Policy, Delayed Care, and Health Expenditures (No. w30139). National Bureau of Economic Research.
Environmental Protection Agency. (2025). National Ambient Air Quality Standards (NAAQS) for PM. Retrieved from https://www.epa.gov/pm-pollution/national-ambient-air-quality-standards-naaqs-pm
Fair Health. (2025). Obesity and GLP-1 Drugs: A Claims-Based Analysis. Retrieved from https://s3.amazonaws.com/media2.fairhealth.org/whitepaper/asset/Obesity%20and%20GLP-1%20Drugs%20-%20A%20FAIR%20Health%20White%20Paper.pdf
Gonzalez, D., Karpman, M., Kenney, G. M., & Zuckerman, S. (2021). Delayed and forgone health care for nonelderly adults during the COVID-19 pandemic. Washington, D.C.: Urban Institute.
Mayo Clinic. (2024). Male Depression: Understanding the Issue. Retrieved from https://www.mayoclinic.org/diseases-conditions/depression/in-depth/male-depression/art-20046216
Panchal, N., Hill, L., Artiga, S., & Hamel, L. (2024). Racial and Ethnic Disparities in Mental Health Care: Findings from the KFF Survey of Racism, Discrimination, and Health. Kaiser Family Foundation. Retrieved from https://www.kff.org/racial-equity-and-health-policy/issue-brief/racial-and-ethnic-disparities-in-mental-health-care-findings-from-the-kff-survey-of-racism-discrimination-and-health/.
Song, H., Bergman, A., Chen, A. T., Ellis, D., David, G., Friedman, A. B., et al. (2021). Disruptions in preventive care: mammograms during the COVID-19 pandemic. Health Services Research, 56(1), 95-101.

By Cody Kirby, Ph.D., Visiting Faculty, Department of Economics