Demographic Changes
By Cody Kirby, Ph.D., Visiting Faculty, Department of Economics, Seidman College of Business, Grand Valley State University
Demographic changes are a demand-side determinant that significantly affects the cost of healthcare for consumers and the utilization of healthcare services. We continue to focus on population growth rates and the age distribution observed in the U.S., as well as in Michigan, specifically in West Michigan and East Michigan. We find evidence of positive population growth across all geographic samples, accompanied by continued population aging, as indicated by an increase in the size of the 65+ community. We anticipate that these population growth rates and age distribution trends will contribute to higher healthcare demand, leading to increased costs and utilization in the future.
The data analyzed in this section are extracted from the U.S. Census Bureau. Population and housing unit estimates are published annually by geographic location and age group, extending back to 1990. We define West Michigan to include the counties of Kent, Ottawa, Muskegon, and Allegan. Meanwhile, East Michigan comprises Detroit, Macomb, and Wayne counties.
Population Growth
Figure 1 displays the population growth rates observed in the U.S., Michigan, West Michigan, and East Michigan since 1990. Throughout the 1990s, West Michigan population growth outpaced the national and state averages, contributing to a rise in healthcare demand, higher healthcare costs, and increased utilization. The onset of the Great Recession in the mid-2000s ushered in a stark population decline across all geographical samples, except for the U.S. as a whole. The decrease in Michigan’s population growth, coupled with the steady national growth, suggests that the Great Recession precipitated an emigration from Michigan to the rest of the country. Since the onset of the Great Recession in 2009, West Michigan’s population has grown by 11.4 percent, compared to a 12.7 percent national growth rate, which is well above the statewide population growth rate of 1.4 percent. Meanwhile, East Michigan’s population shrank by 1.5 percent during the same period.
Figure 1: Annual Population Growth Rate, 1991-2024
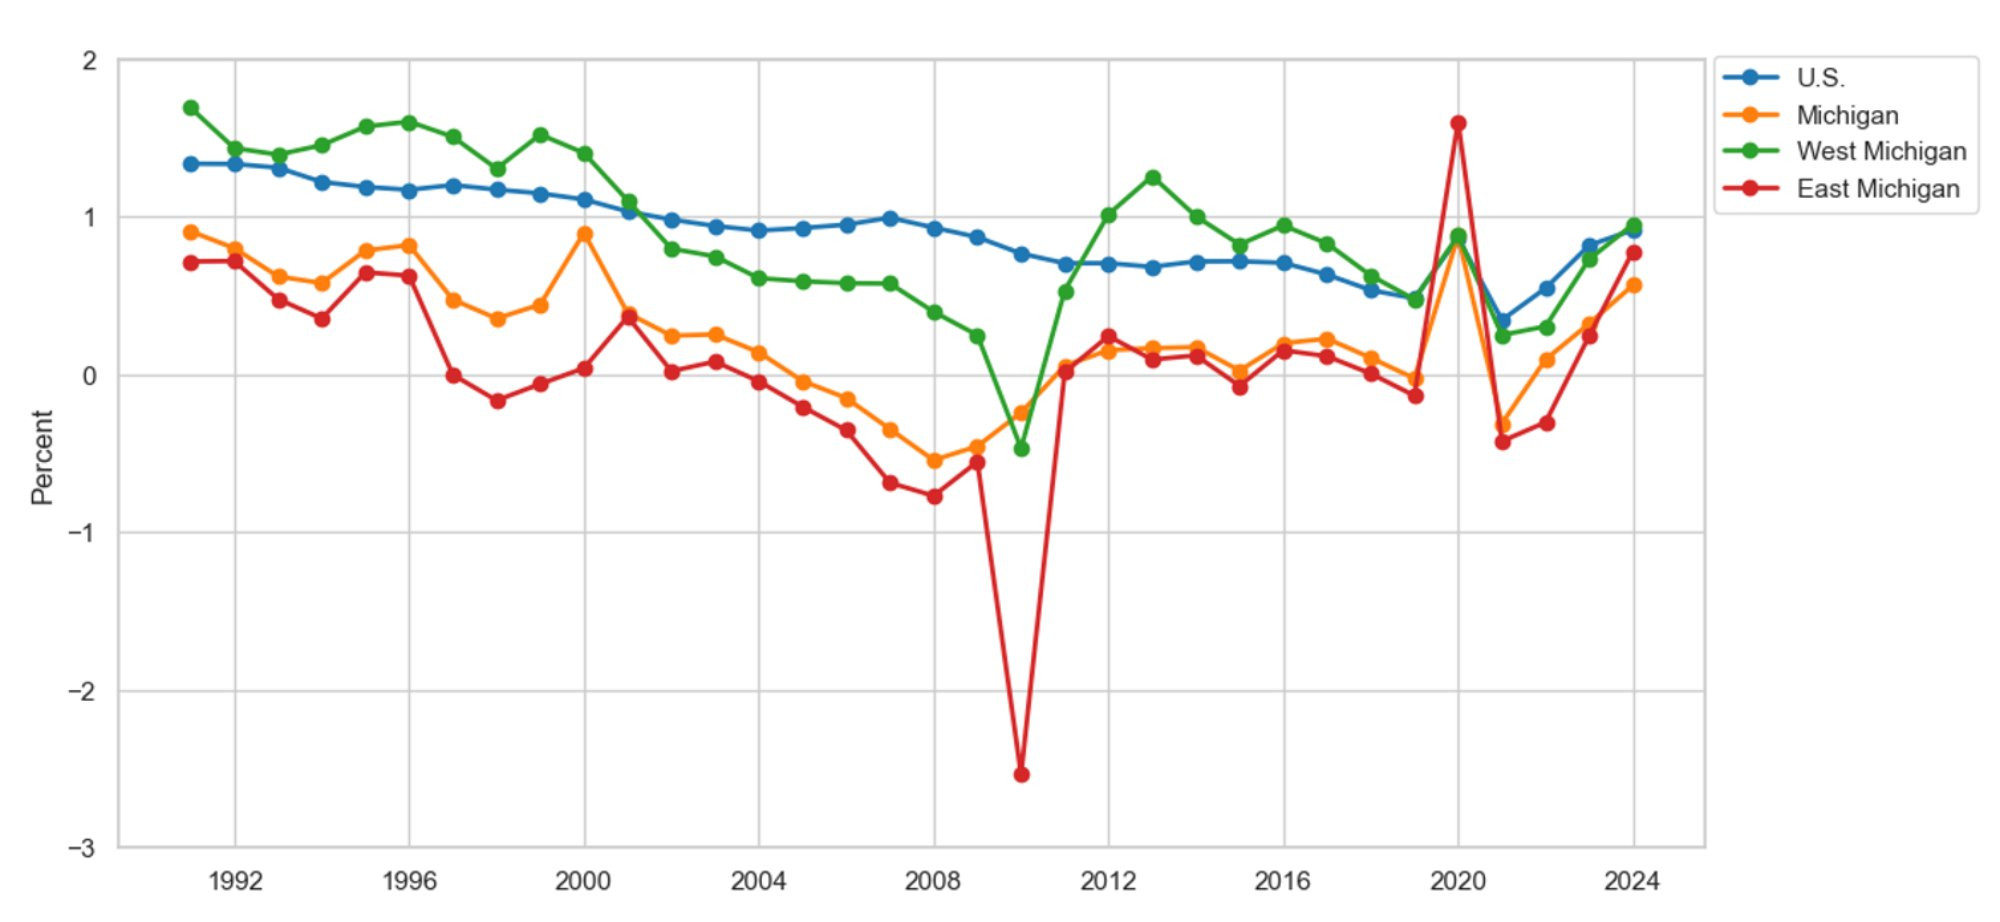
Description: Figure 1 depicts the population growth rates for the U.S., Michigan, West Michigan, and East Michigan. Population growth rates show increases in population size across all geographical samples, except in East Michigan, since 2009. Furthermore, all geographic samples indicate positive population growth since 2020.
Source: U.S. Census, Population, and Housing Unit Estimates
A contrasting story emerged in the population data during the COVID-19 pandemic. For example, the population growth observed in Michigan, West Michigan, and East Michigan in 2020 all outpaced the national growth rate during the same year. One plausible reason for the reversal in population growth during the COVID-19 pandemic lies in the cost of living. Data from the U.S. Federal Housing Finance Agency (2025a, 2025b) indicates that the average home in Michigan was 22 percent cheaper than the national average, thereby incentivizing immigration to Michigan. Since 2020, West Michigan’s population has grown by 2.3 percent, comparable to the national average of 2.7 percent. Meanwhile, East Michigan’s population has increased by 0.3 percent, compared to the state average of 0.7 percent.
Since 2023, population growth in West and East Michigan has outpaced the statewide average and compared to the national average. For example, the U.S. population increased by 0.9 percent, compared with West and East Michigan’s growth rates of 1 percent and 0.8 percent, respectively. Meanwhile, population growth at the state level lagged at 0.6 percent. We anticipate these trends will continue as Michigan’s cost of living remains well below the national average. As the population grows, we expect it to contribute positively to healthcare demand, leading to higher healthcare costs and higher utilization rates.
Age Distribution
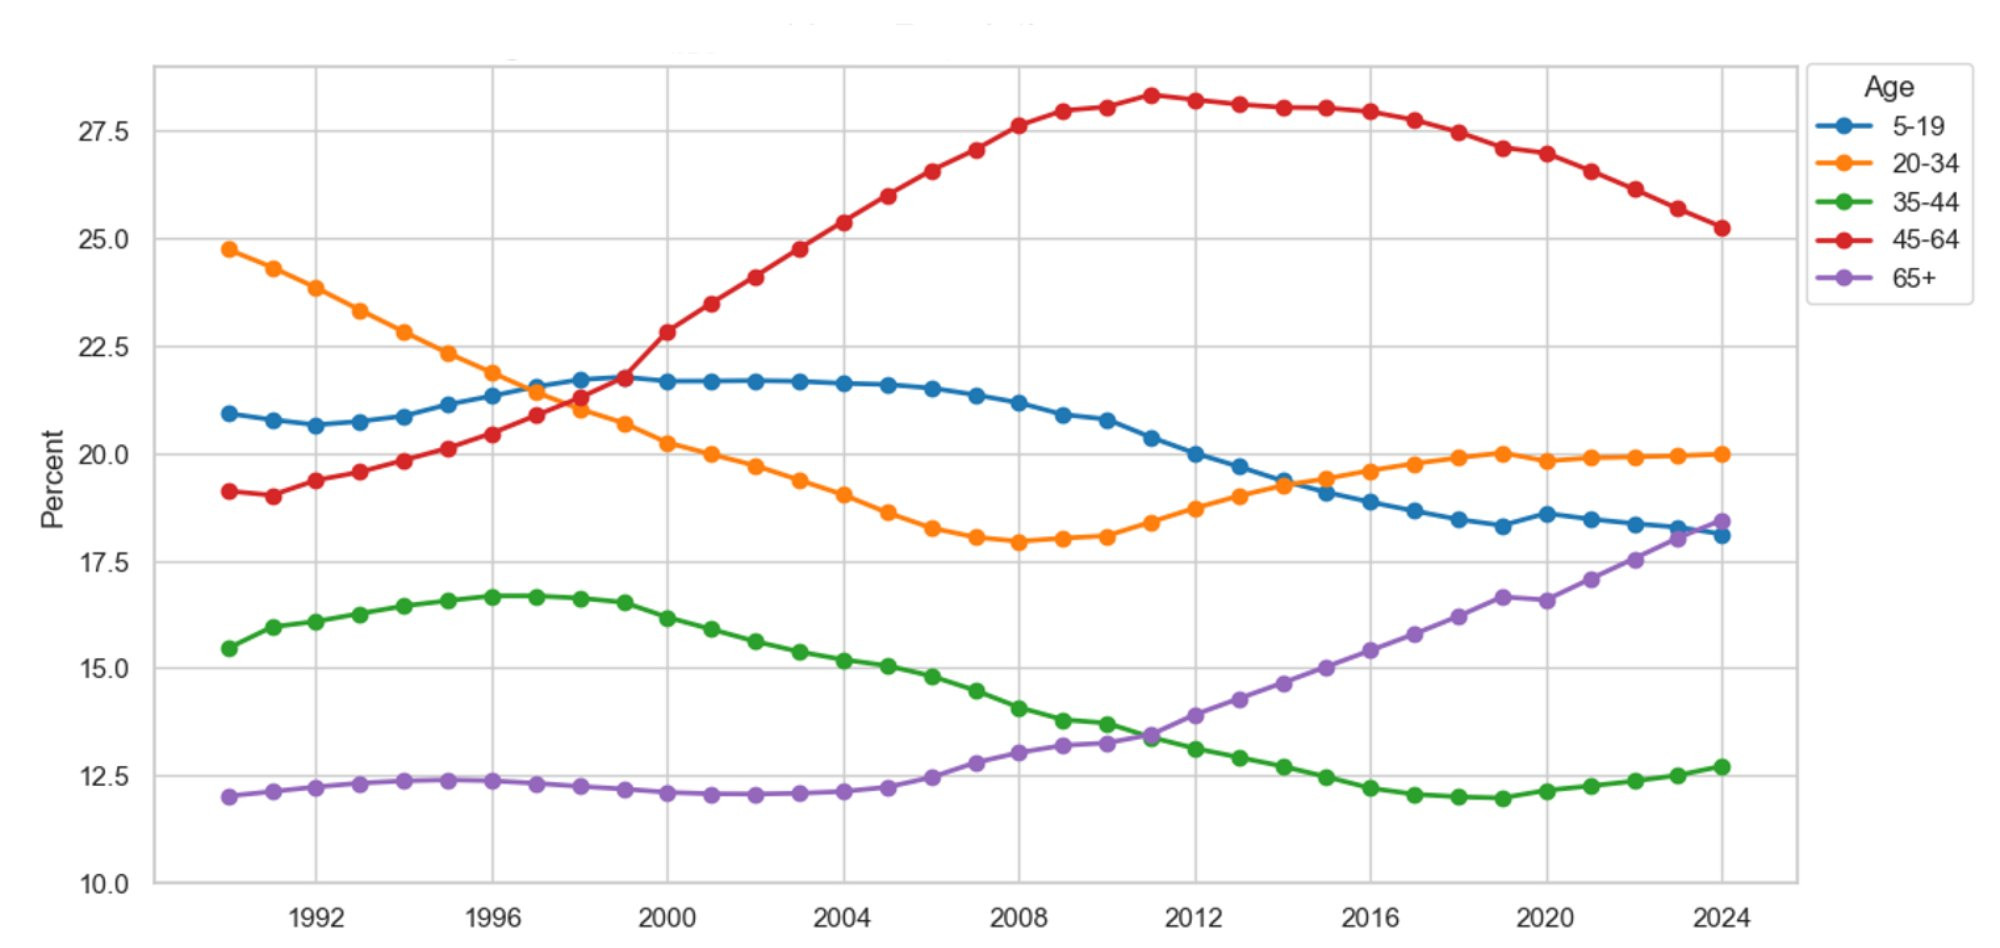
Figure 2 illustrates the evolution in the age distribution of the United States since 1990. We continue to find evidence of population aging at the national level. For example, the proportion of the total population aged 65 and older has increased from 12.5 percent to 28 percent between 1990 and 2024. Meanwhile, all younger cohorts shrank in proportion from 87.5 percent to 82 percent during the same period. Population aging increases healthcare demand as elderly citizens require more care, thereby driving higher healthcare costs and greater hospital utilization. Additionally, Figure 2 highlights the shrinking of the working-age population aged 20 to 64. For example, the share of the working-age population in the total population decreased from 58.7 percent to 57.9 percent between 1990 and 2024. As the working-age population shrinks and the elderly population surges, more strain is placed on the Medicare funding mechanism, as younger workers subsidize the healthcare costs of the 65+ population.
Figure 2: U.S. Population Distribution Over Time
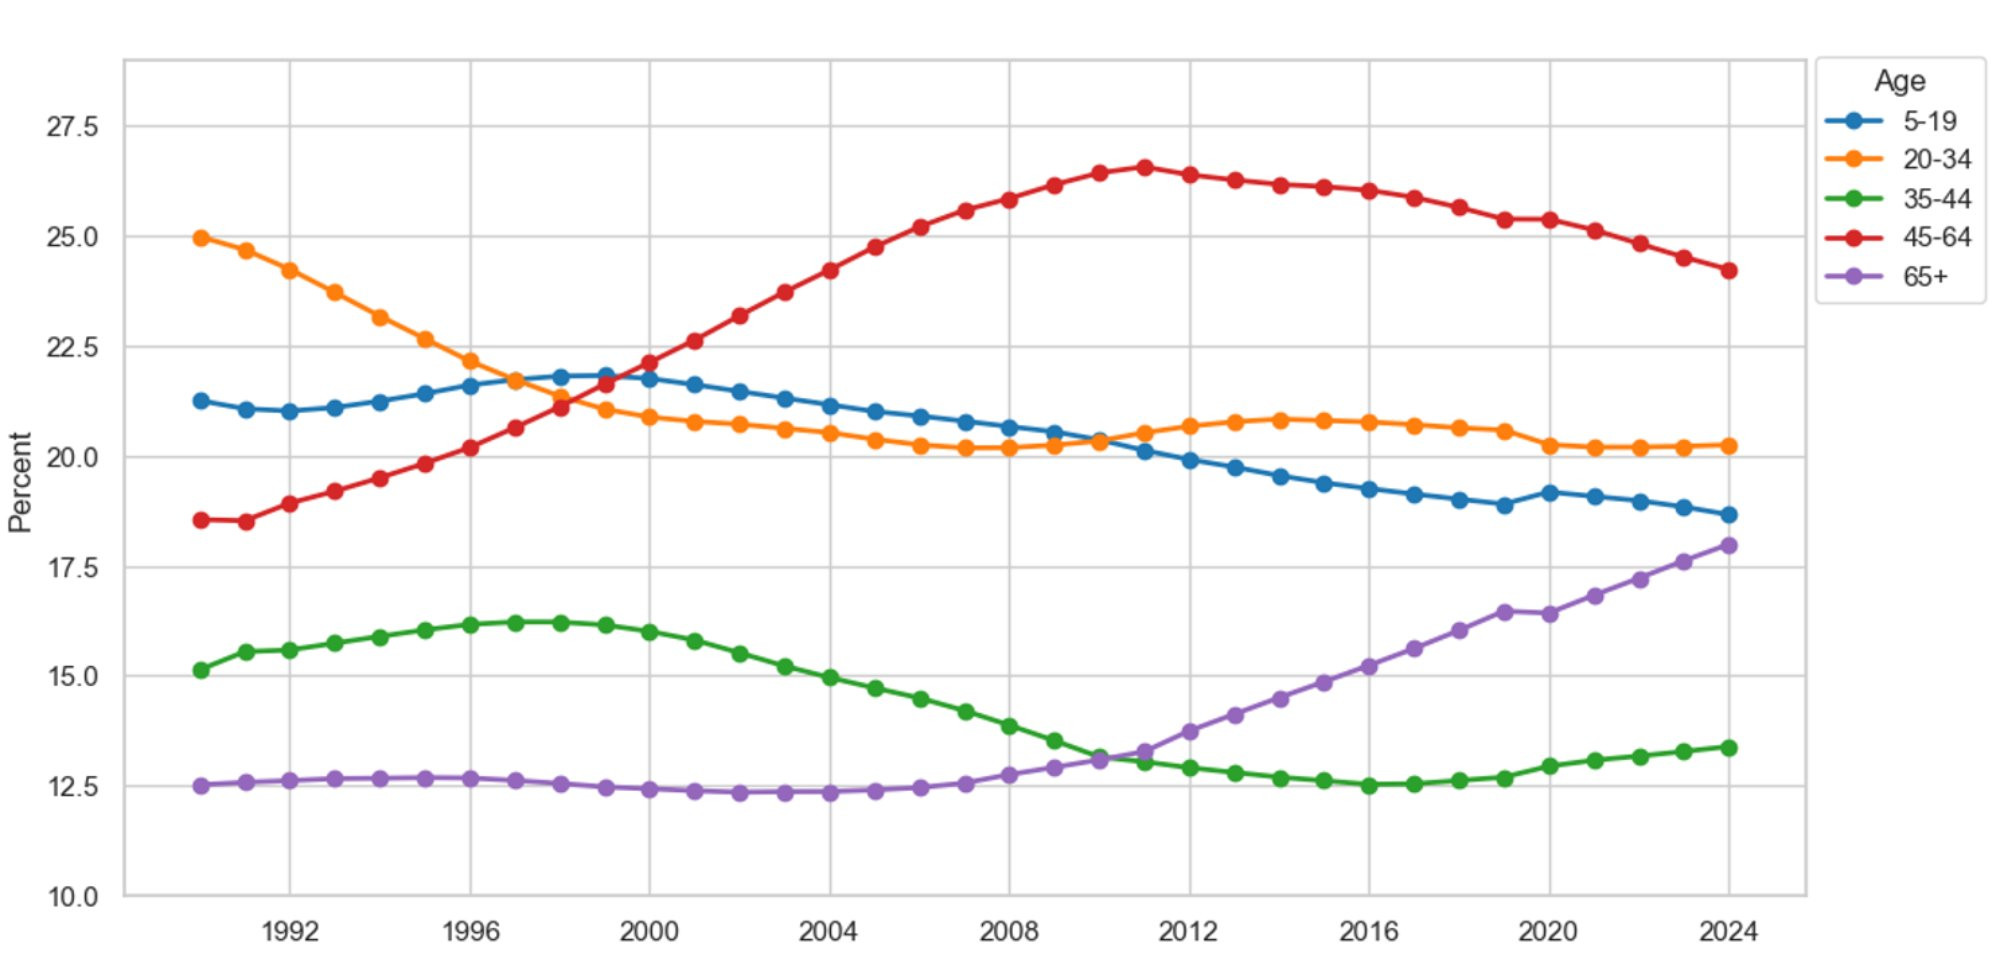
Description: Figure 2 depicts the evolution of the U.S. population distribution by select age groupings. The graph shows an increase in the population sizes of those aged 45-64 and 65+, accompanied by a decrease in the younger age cohorts. For example, persons aged 65+ made up 12.5 percent of the U.S. population in 1990, compared to 18 percent in 2024.
Source: U.S. Census, Population, and Housing Unit Estimates
Figure 3 presents Michigan’s population distribution by age cohort since 1990. The evolution in Michigan’s population closely resembles the trends observed nationally. For example, the 65+ community comprised 11.9 percent of the population in 1990, which as a share of the total population has increased to 19.6 percent in 2024. Meanwhile, the working-age population has decreased from 58.4 percent of the total population to 56.8 percent during the same period. The results put Michigan in line with national trends, which we believe will lead to higher healthcare demand, rising healthcare costs, and greater hospital strain in the future. Additionally, the results throw into question Medicare’s funding mechanism as the working-age population shrinks relative to the burgeoning older population.
Figure 3: Michigan Population Distribution Over Time
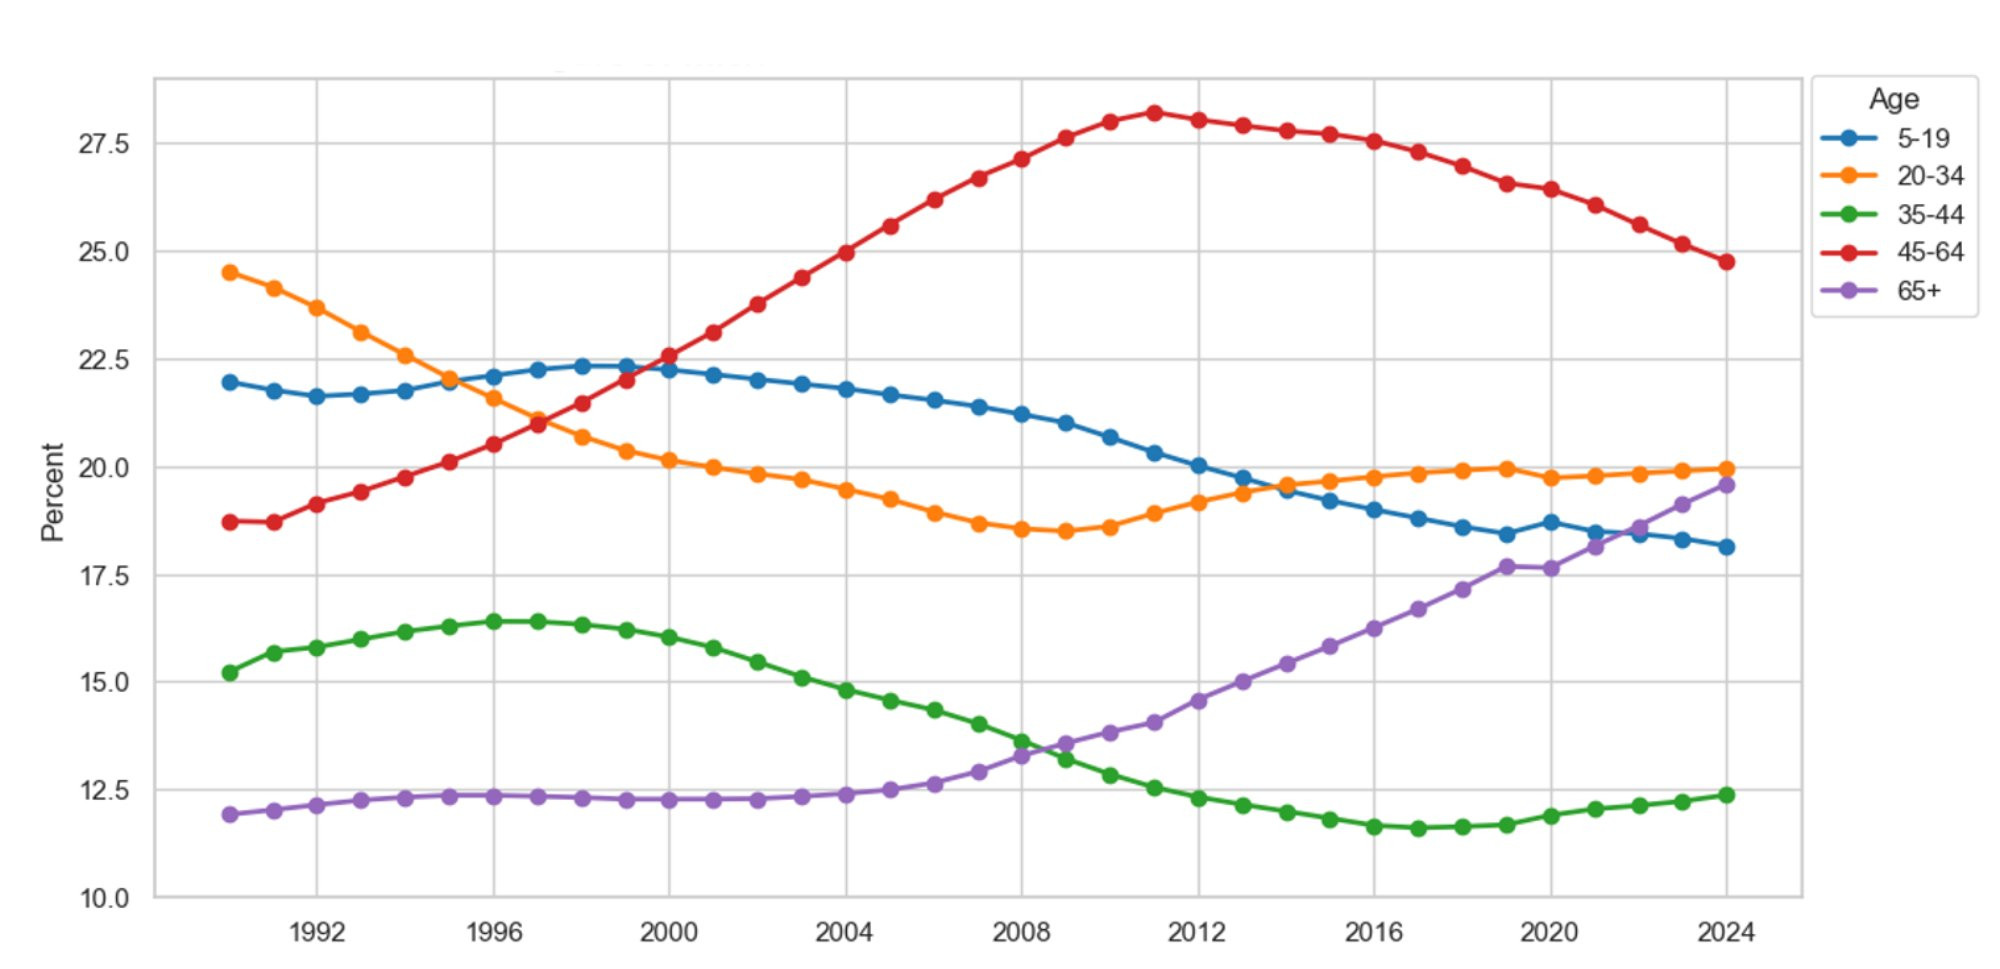
Description: Figure 3 depicts the evolution of Michigan’s population distribution by select age groupings. The graph shows an increase in the population sizes of those aged 45-64 and 65+, accompanied by a decrease in the younger age cohorts. For example, persons aged 65+ made up 11.9 percent of the Michigan population in 1990, compared to 19.6 percent in 2024.
Source: U.S. Census, Population, and Housing Unit Estimates
Figure 4 highlights the change in West Michigan’s population distribution between 1990 and 2024. West Michigan’s population distribution has evolved in a fashion consistent with the trends observed at the state and national levels. For example, West Michigan is aging, as evidenced by the increase in the 65+ population from 11 percent to 17.1 percent of the total population between 1990 and 2024. However, West Michigan’s working-age population has slightly increased from 57.3 percent to 57.5 percent during the same period, which can be explained by the 6.1 percent increase in the population aged 45 to 64. West Michigan’s population is aging, which is driving higher healthcare demand, higher healthcare costs, and greater hospital utilization.
Figure 4: West Michigan Population Distribution Over Time
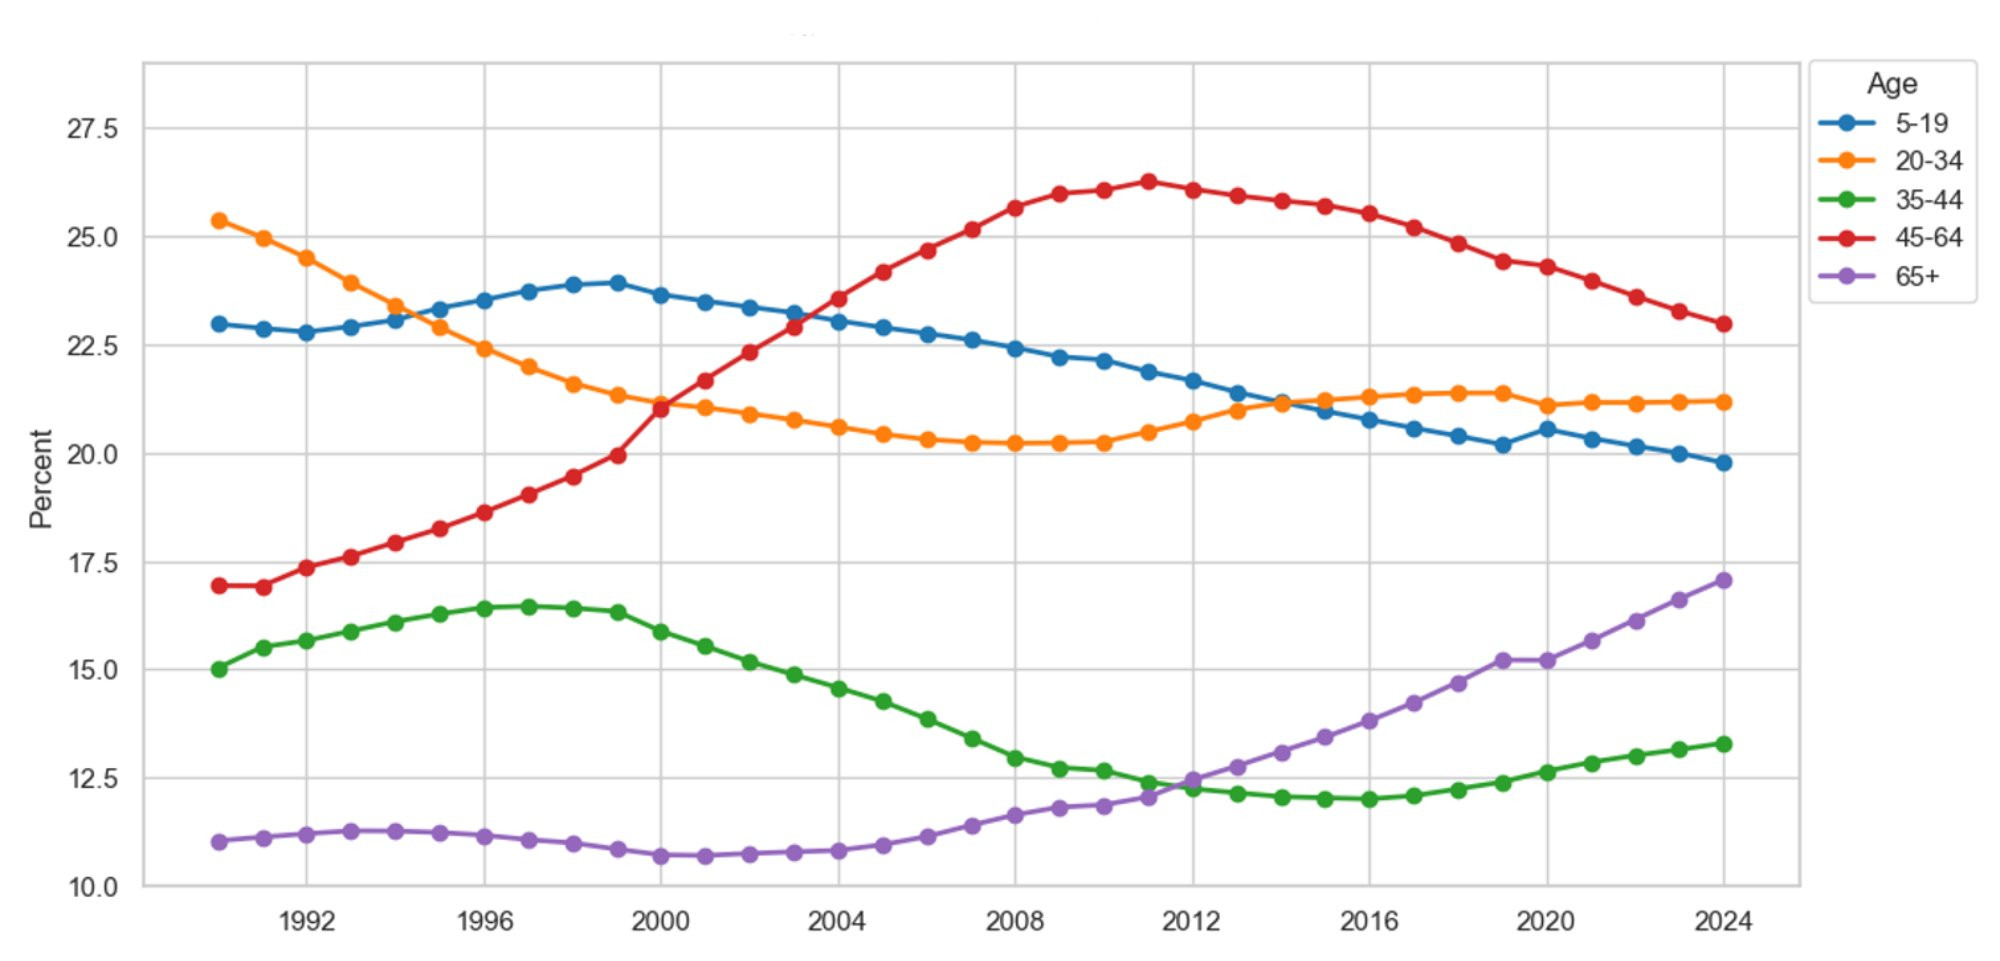
Description: Figure 4 depicts the evolution of West Michigan’s population distribution by select age groupings. The graph shows an increase in the population sizes of those aged 45-64 and 65+, accompanied by a decrease in the younger age cohorts. For example, persons aged 65+ made up 11 percent of the West Michigan population in 1990, compared to 17.1 percent in 2024.
Source: U.S. Census, Population, and Housing Unit Estimates
Finally, Figure 5 presents East Michigan’s population distribution by age cohort since 1990. Consistent with all geographical samples analyzed thus far, East Michigan’s population is aging, contributing to higher healthcare demand and increased strain on the Medicare funding mechanism. For example, the 65+ community as a fraction of the total population has increased from 12 percent in 1990 to 18.4 percent in 2024. Meanwhile, the working-age population has decreased from 59.6 percent to 58 percent during the same time period. Again, as the working-age population shrinks relative to the 65+ community, we have reason to question the viability of the Medicare funding mechanism.
Figure 5: East Michigan Population Distribution Over Time
Description: Figure 5 depicts the evolution of East Michigan’s population distribution by select age groupings. The graph shows an increase in the population sizes of those aged 45-64 and 65+, accompanied by a decrease in the younger age cohorts. For example, persons aged 65+ made up 12 percent of the East Michigan population in 1990, compared to 18.4 percent in 2024.
Source: U.S. Census, Population, and Housing Unit Estimates
In recent years, the population across all geographical samples has grown, driving a greater demand for healthcare services. Additionally, the population has continued to age, which poses a significant concern for healthcare providers and insurers moving forward, particularly given its potential impact on the Medicare funding mechanism. For example, Alemayehu and Warner (2004) find that, on average, 50 percent of lifetime healthcare spending occurs after age 65. Meanwhile, taxes on employment disproportionately fund Medicare, implying that younger working-age populations subsidize the healthcare costs of older generations. Therefore, it is pertinent to study the number of workers per beneficiary to gauge the solvency of the Medicare Part A Trust Fund.
In 1980, there were 4 workers per Medicare beneficiary. That number has since decreased to 2.8 workers per beneficiary in 2024 (Board of Trustees of the Federal Hospital Insurance and Federal Supplementary Medical Insurance Trust Funds, 2025). Furthermore, it is estimated that by 2030, the number of workers per beneficiary will decrease to 2.5 workers, pushing up healthcare costs by 30 percent; an estimate attributed exclusively to the aging population distribution. By 2033, the Medicare Part A Trust Fund is projected to cover only 89 percent of medical costs due to inflation’s impact on healthcare.
Another issue plaguing healthcare providers and insurers is the political climate and the uncertainty permeating the marketplace. To measure policy uncertainty, Baker, Bloom, and Davis (2016) developed the Economic Policy Uncertainty Index, which uses monthly frequency counts of political issues from the ten largest U.S. newspapers, including disagreements between economic forecasters and expiring tax provisions. Using the Economic Policy Uncertainty Index, we can place our current political climate in its historical context. For example, on average, 215 political issues were mentioned each month during the Great Recession, compared to 251 during the COVID-19 pandemic. Since the Trump administration took office in 2025, the increasing tariffs, coupled with the Big Beautiful Bill, have increased policy uncertainty mentions to 415 per month, making this the most uncertain time in U.S. history, even surpassing the Great Depression. How will this uncertainty affect healthcare costs and insurance coverage?
The Big Beautiful Bill will cut $1.2 trillion from healthcare programs, causing 17 million people to lose their health coverage and speeding up the insolvency timeline for the Medicare Part A Trust Fund (Lipschutz & Bers, 2025; Congressional Budget Office, 2025; KFF, 2025a, 2025b). Additionally, the tax credits passed under the Affordable Care Act are set to expire in 2026. If not renewed, out-of-pocket premiums are expected to double by 2026 (Arguello & Ducas, 2025; Lo, Levitt, Ortaliza, and Cox, 2025). In summary, we continue to find evidence of population growth, coupled with population aging, which we anticipate will drive higher healthcare demand, increased healthcare costs, and higher hospital utilization in the future. The increase in the elderly population, coupled with the decline in the working-age population, raises questions about the solvency of the Medicare Part A Trust Fund. To make matters worse, the current political climate does not favor healthcare providers and insurers, as healthcare premiums and costs are expected to rise.
References
Alemayehu, B., & Warner, K.E., (2004). The lifetime distribution of health care costs. Health Service Research, 39(3), 627-642. Retrieved from https://pubmed.ncbi.nlm.nih.gov/15149482/
Arguello, A., & Ducas, A. (2025). House republicans’ Big, ‘Beautiful’ Bill would make health care more expensive for Americans with Medicare and other insurance. Center for American Progress. Retrieved from https://www.americanprogress.org/article/house-republicans-big-beautiful-bill-would-make-health-care-more-expensive-for-americans-with-medicare-and-other-insurance/
Baker, S.R., Bloom, N., & Davis, S.J. (2016). Measuring economic policy uncertainty. The Quarterly Journal of Economics, 131(4), 1593-1636. Retrieved from https://academic.oup.com/qje/article-abstract/131/4/1593/2468873?redirectedFrom=fulltext&login=false
Board of Trustees of the Federal Hospital Insurance and Federal Supplementary Medical Insurance Trust Funds. (2025). 2025 Annual Report. Retrieved from https://www.cms.gov/oact/tr/2025
Congressional Budget Office. (2025). Estimated Budgetary Effects of Public Law 119-21, to Provide for Reconciliation Pursuant to Title II of H. Con. Res. 14, Relative to the Budget Enforcement Baseline for Consideration in the Senate. Retrieved from https://www.cbo.gov/publication/61569
U.S. Federal Housing Finance Agency. (2025a). All Transaction Housing Price Index for Michigan. Federal Reserve Bank of St. Louis. Retrieved from https://fred.stlouisfed.org/series/MISTHPI
U.S. Federal Housing Finance Agency. (2025b). All Transaction Housing Price Index for the United States. Federal Reserve Bank of St. Louis. Retrieved from https://fred.stlouisfed.org/series/USSTHPI
KFF. (2025a). Health Provisions in the 2025 Federal Budget Reconciliation Bill. Retrieved from https://www.kff.org/medicare/tracking-the-medicare-provisions-in-the-2025-budget-bill/
KFF. (2025b). About 17 Million More People Could be Uninsured due to the Big Beautiful Bill and Other Policy Changes. Retrieved from https://www.kff.org/quick-take/about-17-million-more-people-could-be-uninsured-due-to-the-big-beautiful-bill-and-other-policy-changes/
Lipschutz, D., & Bers, A. (2025). Impact of the Big Bill on Medicare. Center of Medicare Advocacy. Retrieved from https://medicareadvocacy.org/impact-of-the-big-bill-on-medicare/
Lo, J., Levitt, L., Ortaliza, J., & Cox, C. (2025). ACA marketplace premium payments would more than double on average next year if enhanced premium tax credits expire. KFF. Retrieved from https://www.kff.org/quick-take/about-17-million-more-people-could-be-uninsured-due-to-the-big-beautiful-bill-and-other-policy-changes/

Cody Kirby, Ph.D., Visiting Faculty, Department of Economics