Major Medical Conditions: Expenditure Analysis
By Daniel Montanera, Ph.D., Associate Professor, Department of Economics, Seidman College of Business, Grand Valley State University
This analysis provides general cost information about a set of highly prevalent and expensive medical conditions. This section’s purpose is to identify and track trends in health care expenditures for selected chronic health conditions and to examine geographic differences in the cost of care. The data presented in this section are average annual member expenditures, including prescription medication expenditures, for those enrolled in private health insurance plans administered by Blue Care Network (BCN), Blue Cross Blue Shield of Michigan (BCBSM), and Priority Health (PH) for the years 2023-2024. The following factors should be considered when interpreting analyses in this section:
- Differences in benefit structures and enrollment. Both BCN and PH offer primarily HMO products while BCBSM members are predominantly enrolled in PPO plans. HMOs tend to operate through selective contracting and provider referrals, utilizing networks in order to achieve cost savings. PPOs tend to have fewer restrictions on members seeking care and, therefore, usually require additional member cost-sharing in the form of higher premiums, higher coinsurance rates, or higher copays. Because of these differences in benefit structures, evidence suggests that HMO plans are more attractive to enrollees who are healthier, who have less complex medical needs, or who have no longstanding ties to particular providers (Ji and Liu, 2007; Nicholson et al., 2004; Tchernis et al., 2006). However, some research has failed to find a substantial difference in health status for those enrolling in HMO plans (Schaefer and Reschovsky, 2002). Furthermore, enrollment changes can alter the underlying disease burden of the payer mix resulting in changes in utilization and expenditures.
- Disease selection. The health status, and thus the expenditures, for members with specific conditions might vary due to differences in demographics and health behaviors. For example, patients in some counties insured by one payer may be sicker than patients in other counties who are insured by a different payer.
- Expenditures beyond disease. In each case, the average patient expenditure data is for services not only related to the specific disease in question, but also for other unrelated medical costs the member may have incurred during the year. Differences in expenditures or treatment intensity for these unrelated health issues can result in additional variation in average patient expenditure estimates. Expenditure estimates from each insurer can vary considerably because of these factors. Thus, we average the data for all three insurers to arrive at a more robust estimate of member expenditures.
KOMA Region Expenditures
As we have done in previous versions of this publication, we choose to focus on six chronic conditions that are associated with high prevalence rates and high levels of resource utilization: asthma, coronary artery disease (CAD), depression, diabetes, hyperlipidemia, and low back pain. For comparison, we also include “healthy members,” which we define as those between the ages of 30 and 39 who had not been diagnosed with any of the six chronic conditions previously listed and who have total annual expenditures below $450,000. Figure 1a provides the average annual expenditures per member for each of these conditions in Kent, Ottawa, Muskegon, and Allegan (KOMA) counties in 2023 and 2024. In most cases, we identified members in each disease category according to specifications defined by the Healthcare Effectiveness Data and Information Set (HEDIS). We excluded Medicaid and Medicare enrollees from our expenditure estimates. Finally, all expenditure estimates in Figure 1a are reported in 2024 dollars.
Figure 1a: Average Expenditures per Member in KOMA, 2023–2024
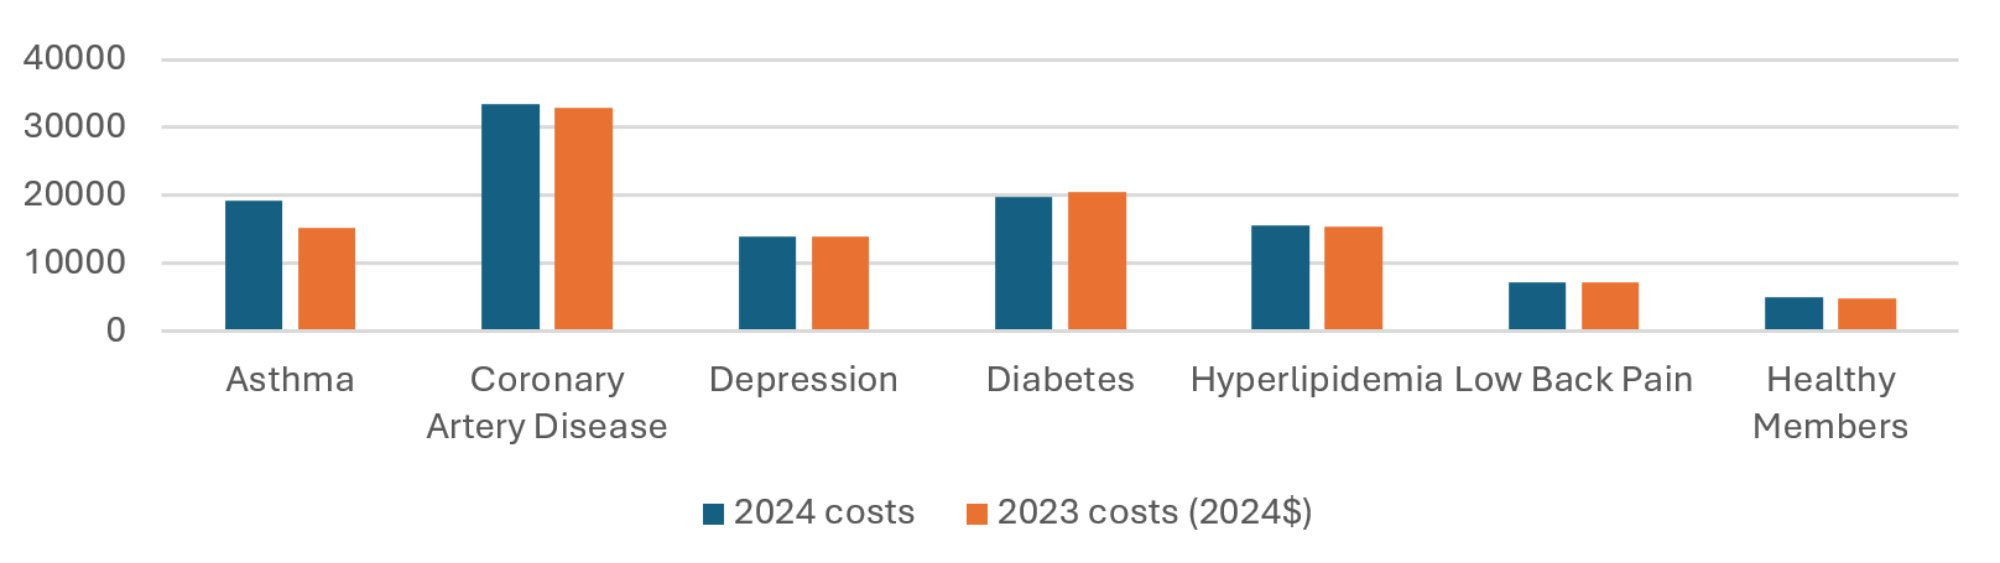
Description: The Average Expenditures per Member in KOMA, 2023-2024 graph shows average insurer real expenditures for each member diagnosed with one of six chronic conditions (asthma, coronary artery disease, depression, diabetes, hyperlipidemia, and low back pain) as well as for health members, for 2023 and 2024. In general, expenditure has not changed much, except for asthma having risen substantially.
Source: BCBSM, BCN, and Priority Health member data (2025).
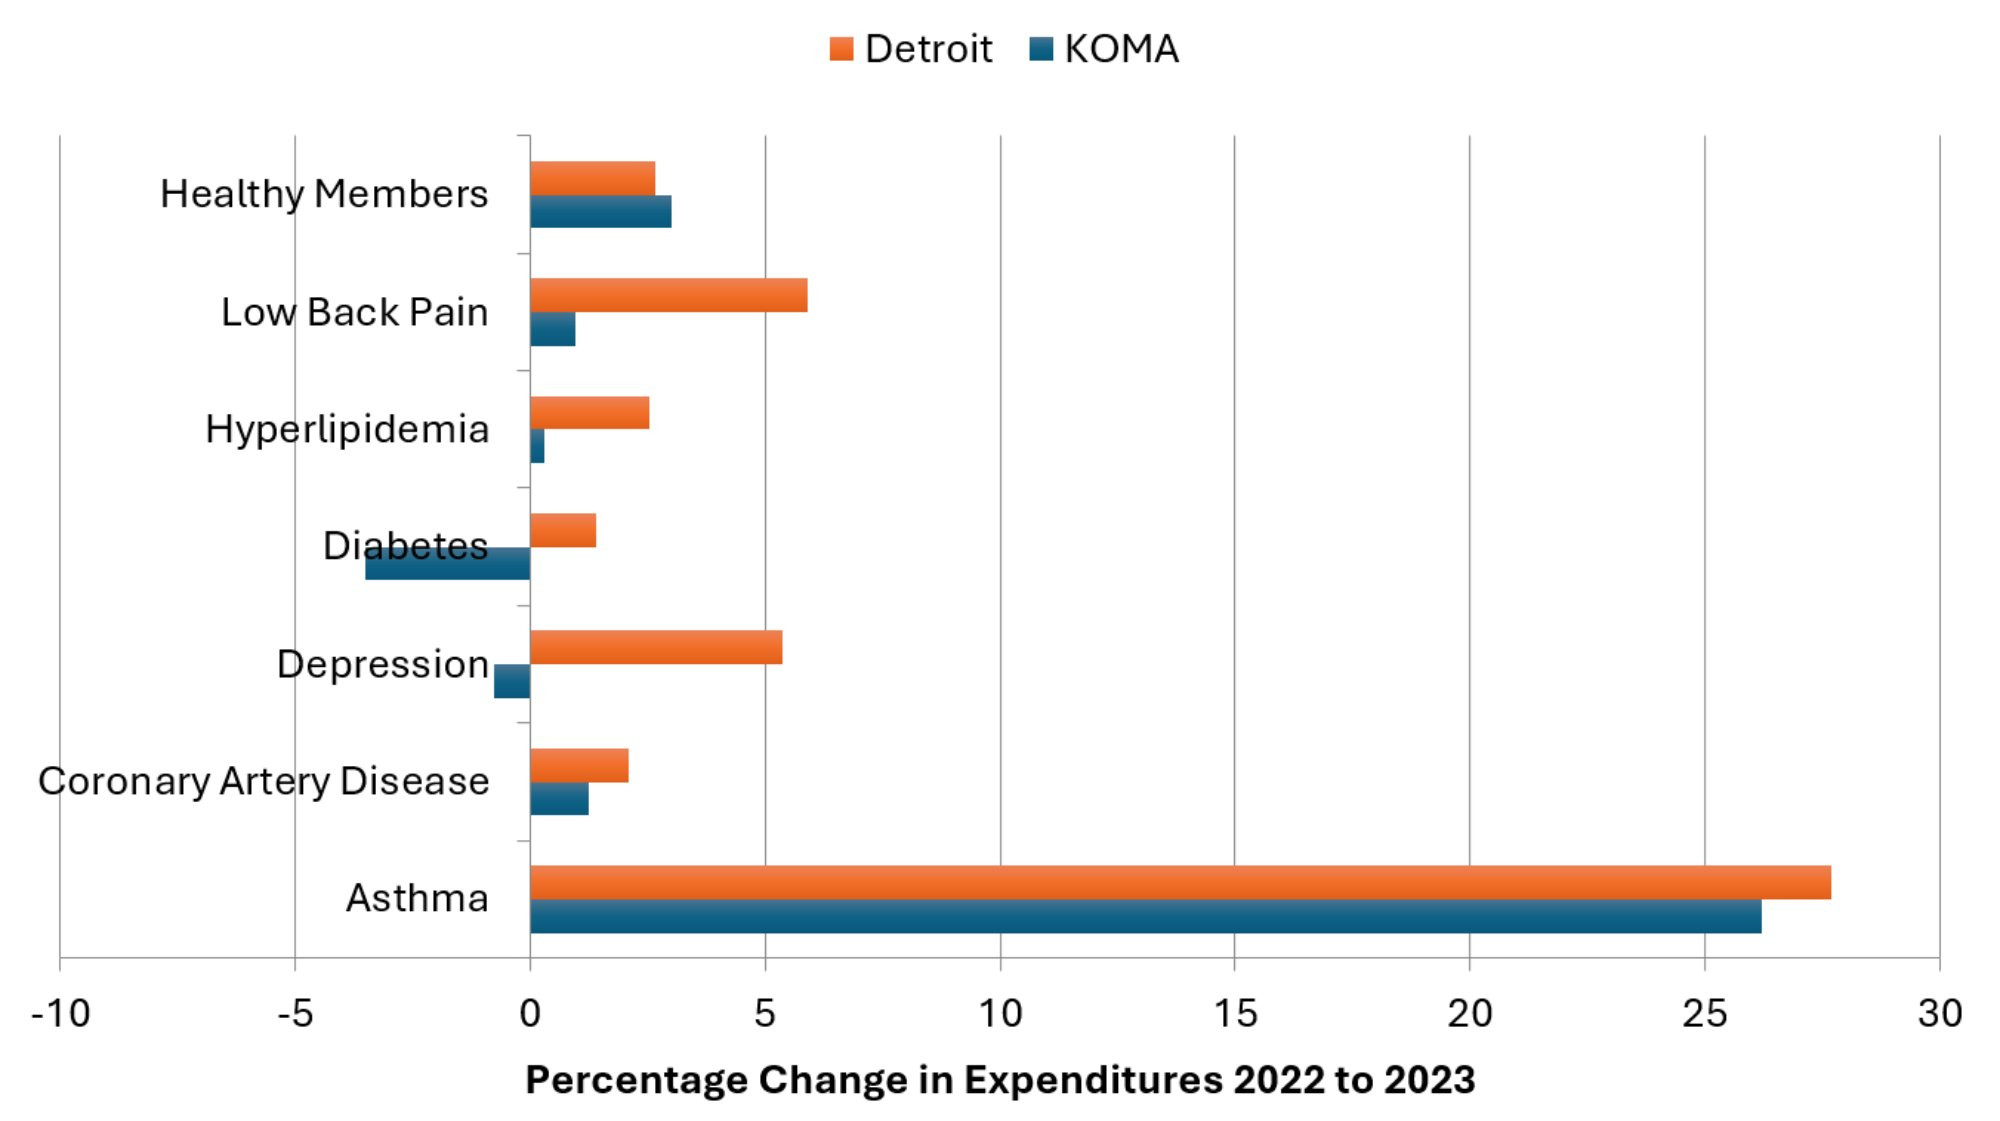
Figure 1a indicates that, with one exception, expenditures in KOMA across the chronic conditions were fairly steady from 2022 through 2023, after adjusting for inflation. This is less volatility than has been observed in recent years of this report. The obvious exception to this finding is asthma-related expenditures, which have grown 26.2 percent in real terms, greatly accelerating over the 8.7 percent growth that was observed last year. Figure 1b details all of the percentage changes in average member costs. Here, in addition to the aforementioned increases in asthma spending, we note that real expenditures increased for healthy members (+3.0 percent), CAD (+1.2 percent), low back pain (+1.0 percent), and hyperlipidemia (+0.3 percent). Expenditures decreased for depression (-0.8 percent), and diabetes (-3.5 percent). In dollar terms, the greatest average per-member changes in expenditure were seen in asthma (+$3,986) and diabetes (-$717). Unfortunately, we are unable to identify the cause of these changes in spending.
Figure 1b: Percentage Change in Average Member Costs, 2023–2024
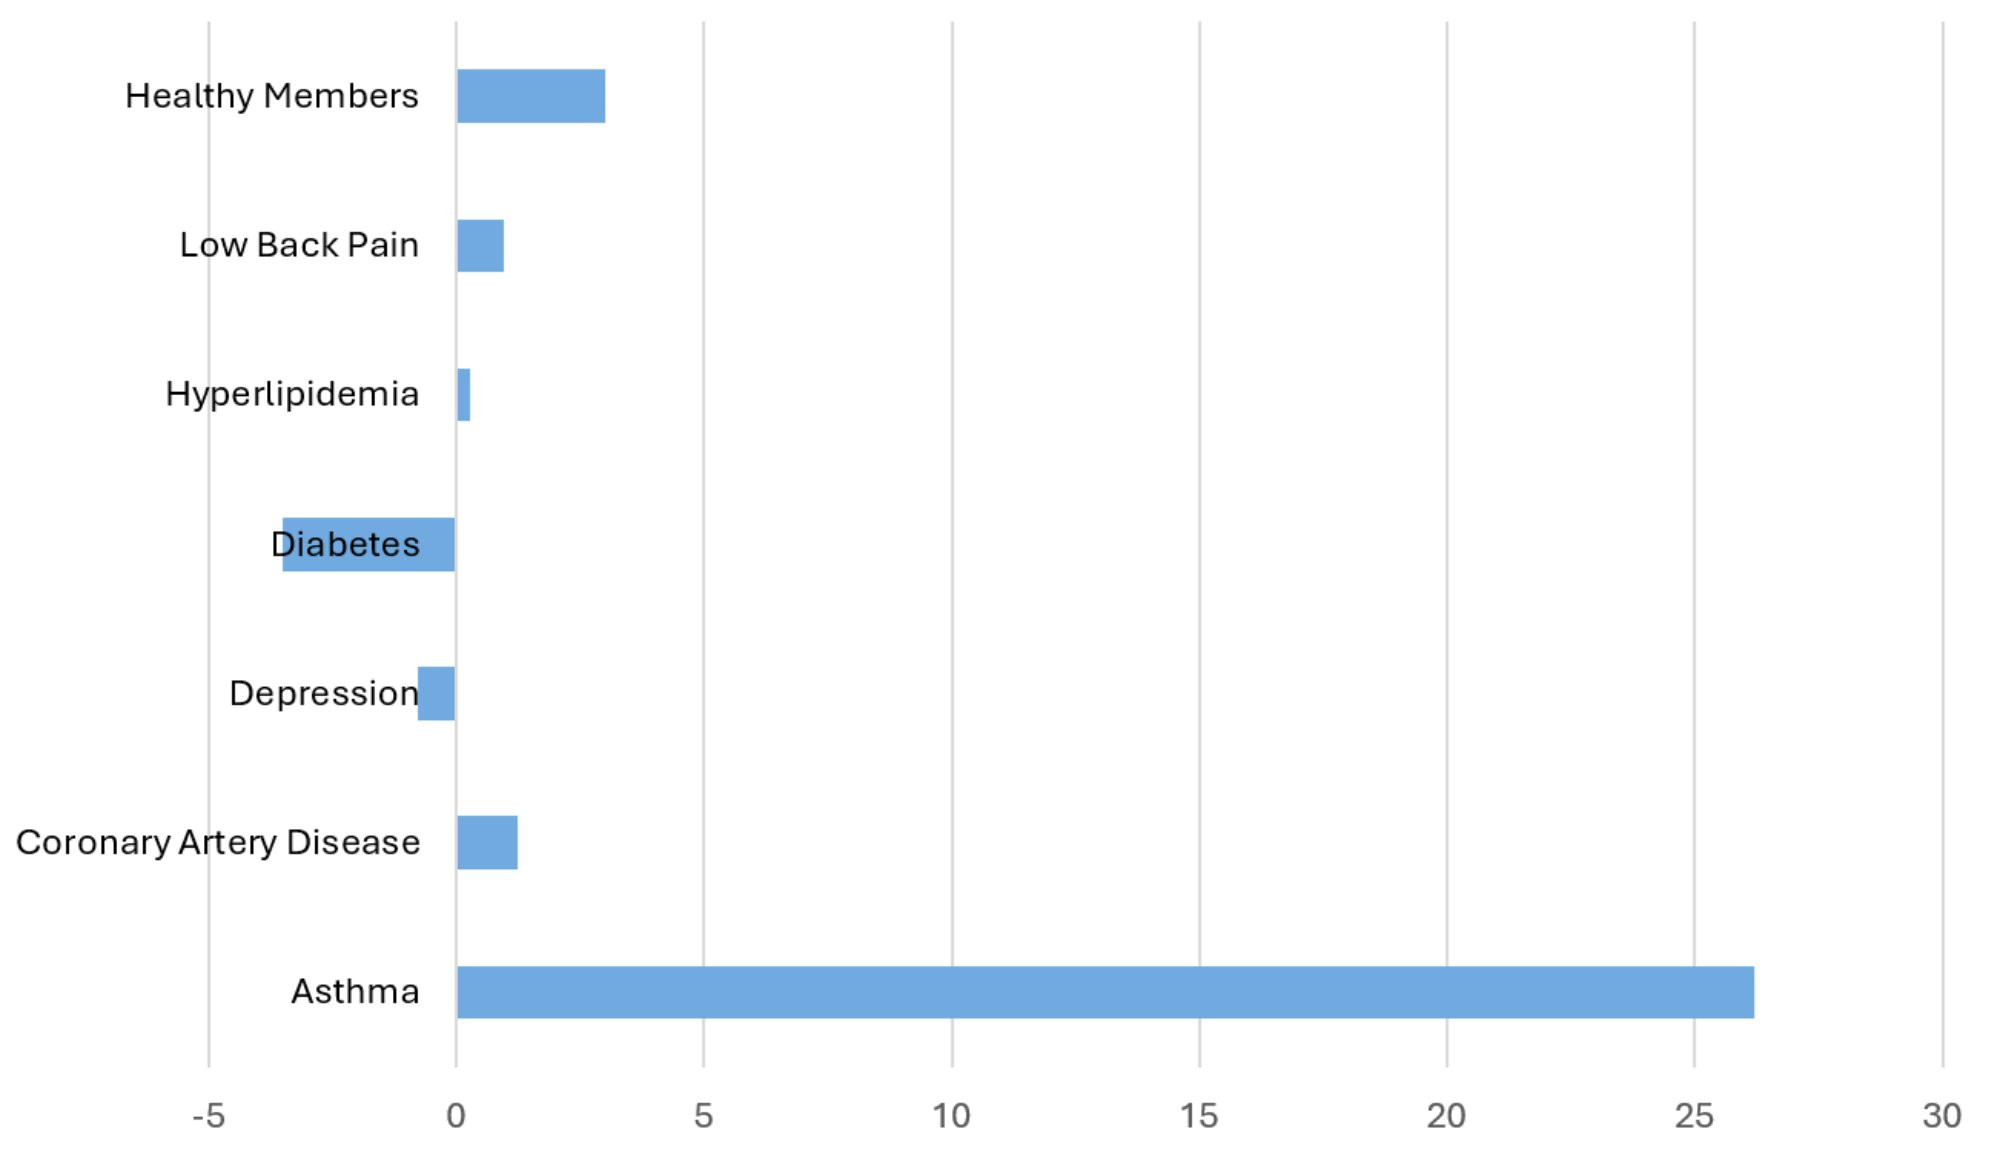
Description: The Percent Change in Average Member Costs in the KOMA Region, 2023-2024 graph shows the percent change in average insurer expenditures for each member diagnosed with one of six chronic conditions (asthma, coronary artery disease, depression, diabetes, hyperlipidemia, and low back pain) as well as for health members, from 2023 to 2024. In general, expenditure has not changed much, except for asthma having risen substantially.
Source: BCBSM, BCN, and Priority Health member data (2024).
The disease-specific shares of expenditure related to prescription drugs are presented in Figure 2. The prescription drug share of total spending for 2024 ranges from 22 percent for members with CAD to 56 percent for those diagnosed with asthma. We note that prescription drug expenditure’s share of overall disease-specific expenditures rose from 33 to 35 percent in real terms between 2023 and 2024. In dollar terms, the average real prescription drug expenditures increase between 2023 and 2024 for members diagnosed with asthma accounts for nearly all (89 percent) of the growth in asthma spending per member. The most likely reason for this finding is the changing guidelines for treatment of asthma in those over the age of 12. This involves replacing Short-Acting Beta Agonists with a combination of Inhaled Corticosteroids and Long-Acting Beta-Agonists (Global Initiative for Asthma, 2024). Based on these data, the change in prescription drug expenditure in KOMA for those diagnosed with asthma following the change in asthma treatment guidelines is $3,547, or 49.5 percent. This is important information for any investigation into the cost effectiveness of the new asthma treatment guidelines. For the remaining diagnoses, the changes in average annual real prescription drug expenditures per member in 2024 were +$169 for CAD, +$78 for depression, -$628 for diabetes, -$22 for hyperlipidemia, and +$40 for low back pain.
Figure 2: Rx Share of Average Expenditures per Member in KOMA, 2023–2024
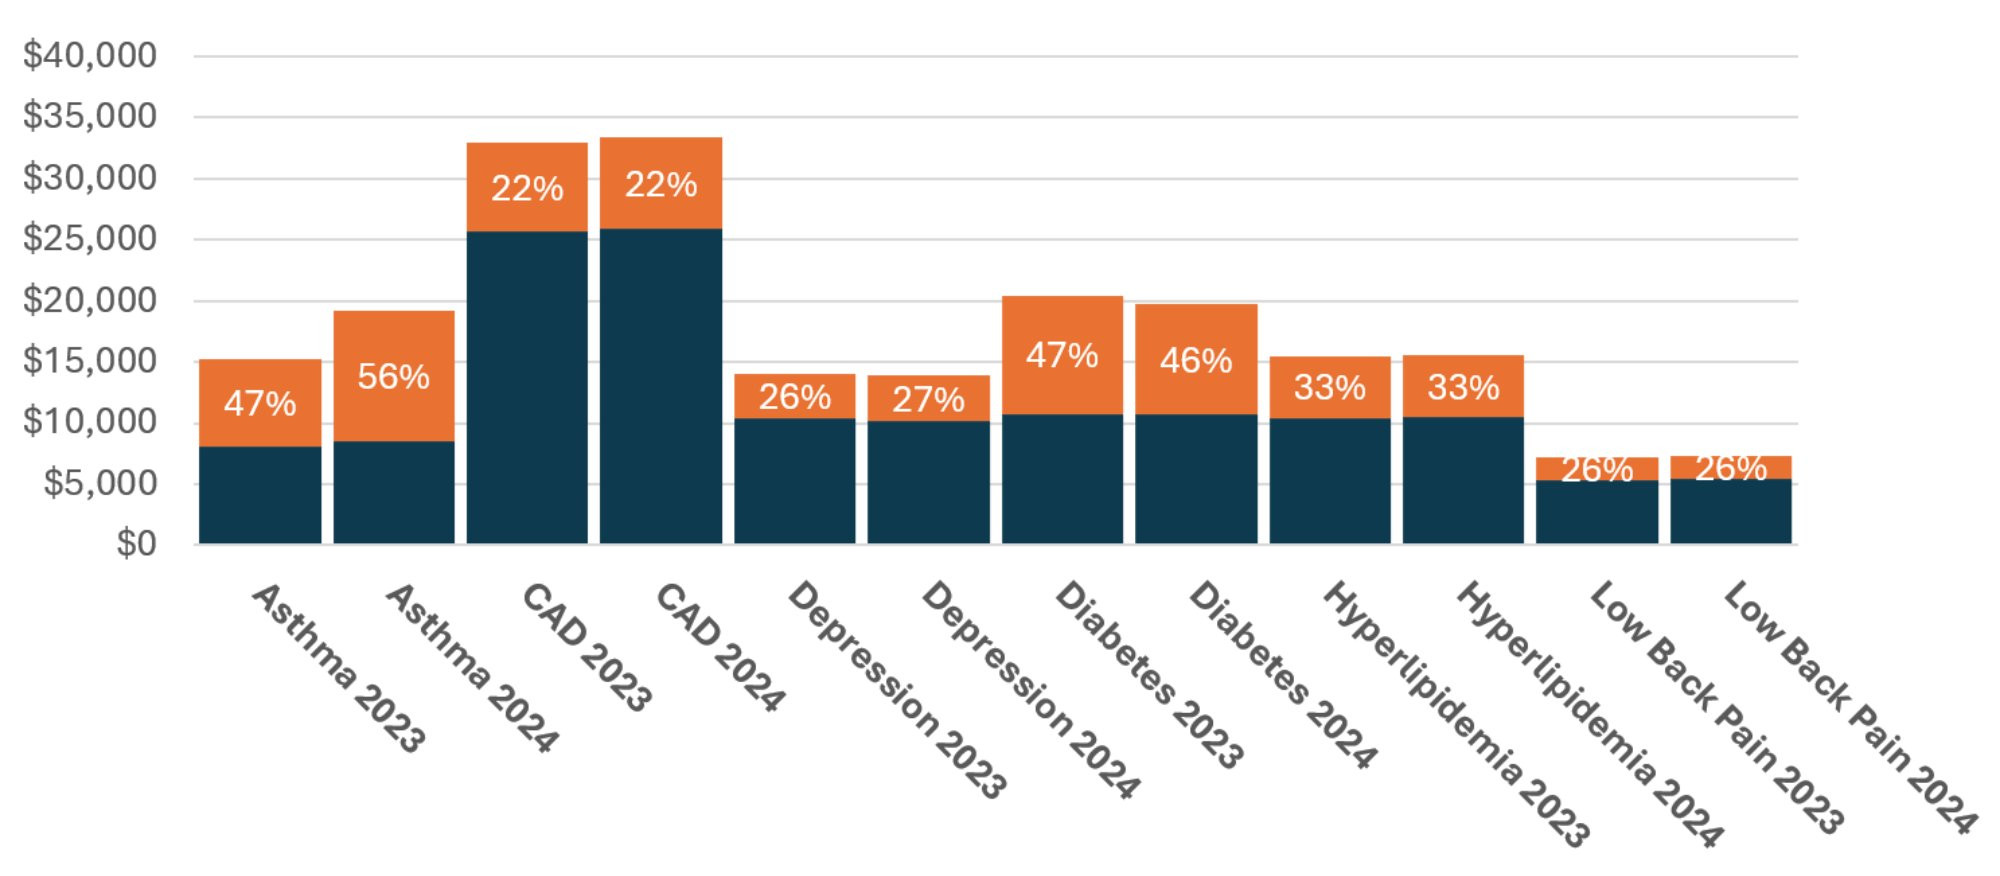
Description: The Rx Share of Average Expenditures per Member in KOMA, 2023 - 2024 graph shows the share of average insurer expenditures due to prescription drugs for each member diagnosed with one of six chronic conditions (asthma, coronary artery disease, depression, diabetes, hyperlipidemia, and low back pain) as well as for health members, from 2023 to 2024. Shares are largely unchanged, with the exception of asthma’s growing substantially.
Source: BCBSM, BCN, and Priority Health member data (2024).
Differences in Average Annual Expenditures Between KOMA and the Detroit Region
Figure 3a compares average annual per member expenditures in both the KOMA and Detroit regions. We define the Detroit region as Oakland, Macomb, and Wayne counties. Figure 3a indicates that, for 2024 across all conditions and healthy members, average expenditures are higher in the KOMA region than Detroit for four of the conditions and are lower for the other three. The percentage differences vary across diagnoses, with CAD members’ expenditures in KOMA being 19 percent higher than Detroit while depression expenditures are four percent lower. Differences in spending for the same condition between the east and west sides of the state may result from several reasons, including higher prices for care, economies of scale, greater use of medical services/technologies, or geographic differences in the underlying health of the population.
Figure 3a: Average Expenditures per Member, 2024
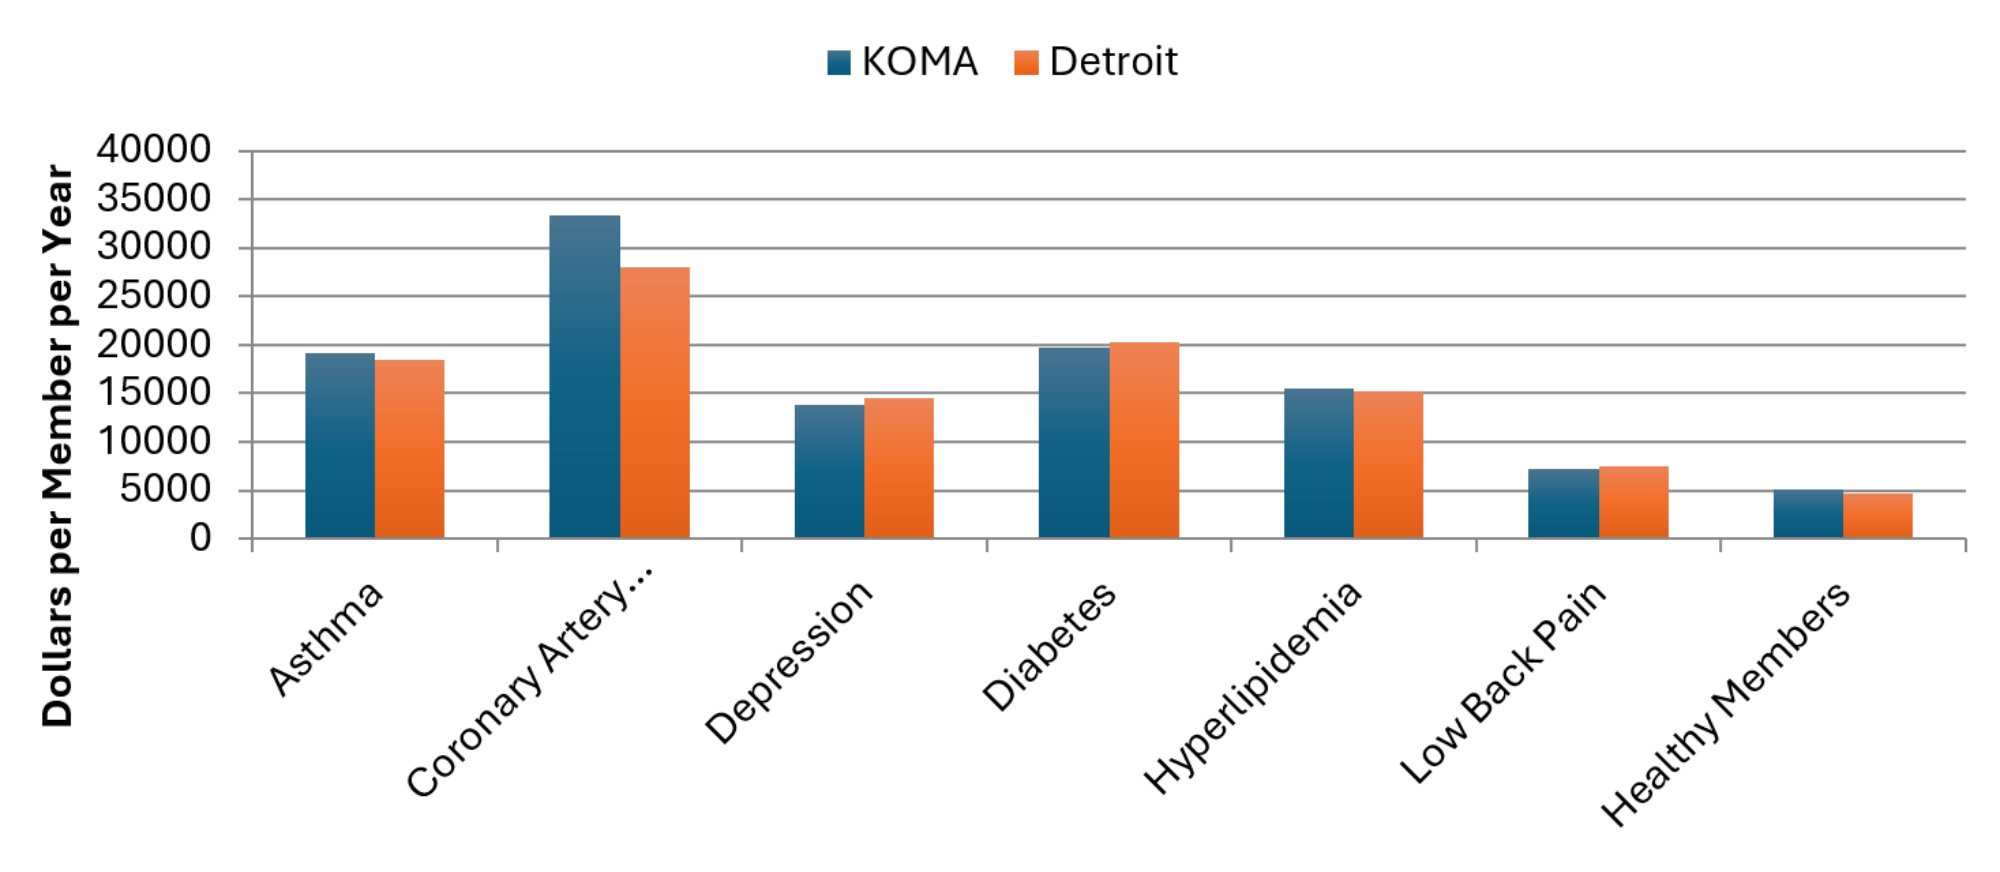
Description: The Average Expenditures per Member, 2024 graph shows the average insurer expenditures in both KOMA and Detroit regions for each member diagnosed with one of six chronic conditions (asthma, coronary artery disease, depression, diabetes, hyperlipidemia, and low back pain) as well as for health members in 2024. KOMA’s spending is higher than Detroit’s for four out of the seven categories, especially for CAD.
Source: BCBSM, BCN, and Priority Health member data (2024).
Figure 3b plots for KOMA and Detroit the percentage change in expenditures for each condition from 2023 to 2024. So, while Figure 3a provides differences in spending levels between the two regions, Figure 3b presents a more dynamic look at how those spending levels changed in the past year. This figure makes it apparent that the growth in asthma spending is not confined to west Michigan, but is a problem all over the state. Other than asthma, the data show that spending generally increased more in the Detroit region than it did in KOMA. This trend is true for every condition aside from healthy members. This was not true in the previous version of this report, where KOMA spending tended to grow faster than in Detroit. The greatest disparity in expenditure changes involved depression, with a 6.1 percentage point difference in favor of KOMA. The smallest disparity involved CAD, with only a 0.8 percentage point difference in KOMA’s favor. The broad message from Figures 3a and 3b is that real expenditures across the chronic conditions tended to increase in the Detroit region between 2023 and 2024, which spending changes were more mixed for KOMA. This is a potential source of concern for the Detroit region that is worth monitoring.
As was the case for the previous four years, we have access to the average risk scores of 2024 members, which allows us to adjust for expenditure differences between the KOMA and Detroit regions that are due to differences in the underlying health of their residents. Figure 3c reports two average member expenditure measures in KOMA across all conditions. The first measure is the actual (raw) KOMA expenditures as calculated for Figure 1a. The second is the predicted average KOMA region expenditures for these members if the KOMA risk scores were the same on average as those in the Detroit region, whose expenditures are also shown in the figure. Therefore, a comparison of the middle and right bars for each diagnosis reveals expenditure differences due to factors other than the wellness of the regional member populations.
Figure 3b: 2023–2024 Percentage Change in Average Expenditures per Member
Description: The 2023-2024 Percentage Change in Average Expenditures per Member graph shows the percent change in average insurer expenditures in both KOMA and Detroit regions for each member diagnosed with one of six chronic conditions (asthma, coronary artery disease, depression, diabetes, hyperlipidemia, and low back pain) as well as for health members, between 2023 and 2024. Expenditures typically rose more in Detroit than KOMA, and both regions show substantial increases for members with asthma.
Source: BCBSM, BCN, and Priority Health member data (2025).
The adjusted expenditures for the KOMA region in the middle columns of Figure 3c show that the spending disparities between regions are even more concerning than those identified in Figures 3a. Upon accounting for differences in the underlying health of members in the two regions, the spending gaps clearly favor the Detroit region. Considering adjusted expenditures instead of raw, the KOMA region expenditures are higher than those of Detroit by 15 percent for asthma, 27 percent for CAD, 26 percent for depression, 26 percent for diabetes, 24 percent for hyperlipidemia, 43 percent for low back pain, and 24 percent for healthy members. The adjustment reveals that the KOMA region continues to have a relatively healthy population compared to Detroit, and so the differences in raw expenditures between the regions on members with the same diagnoses must be due to other factors. Figure 3c suggests there could be additional savings in KOMA from bringing prices or treatment approaches more in line with the Detroit region for all these conditions. It is not clear how this would affect access to or quality of care in the KOMA region, however, or how much of the difference in expenditure is due to economies of scale given Detroit’s larger population, and so additional investigation is necessary before a recommendation can be made.
Figure 3c: Average Expenditures per Member with Risk-Adjusted KOMA Values, 2024
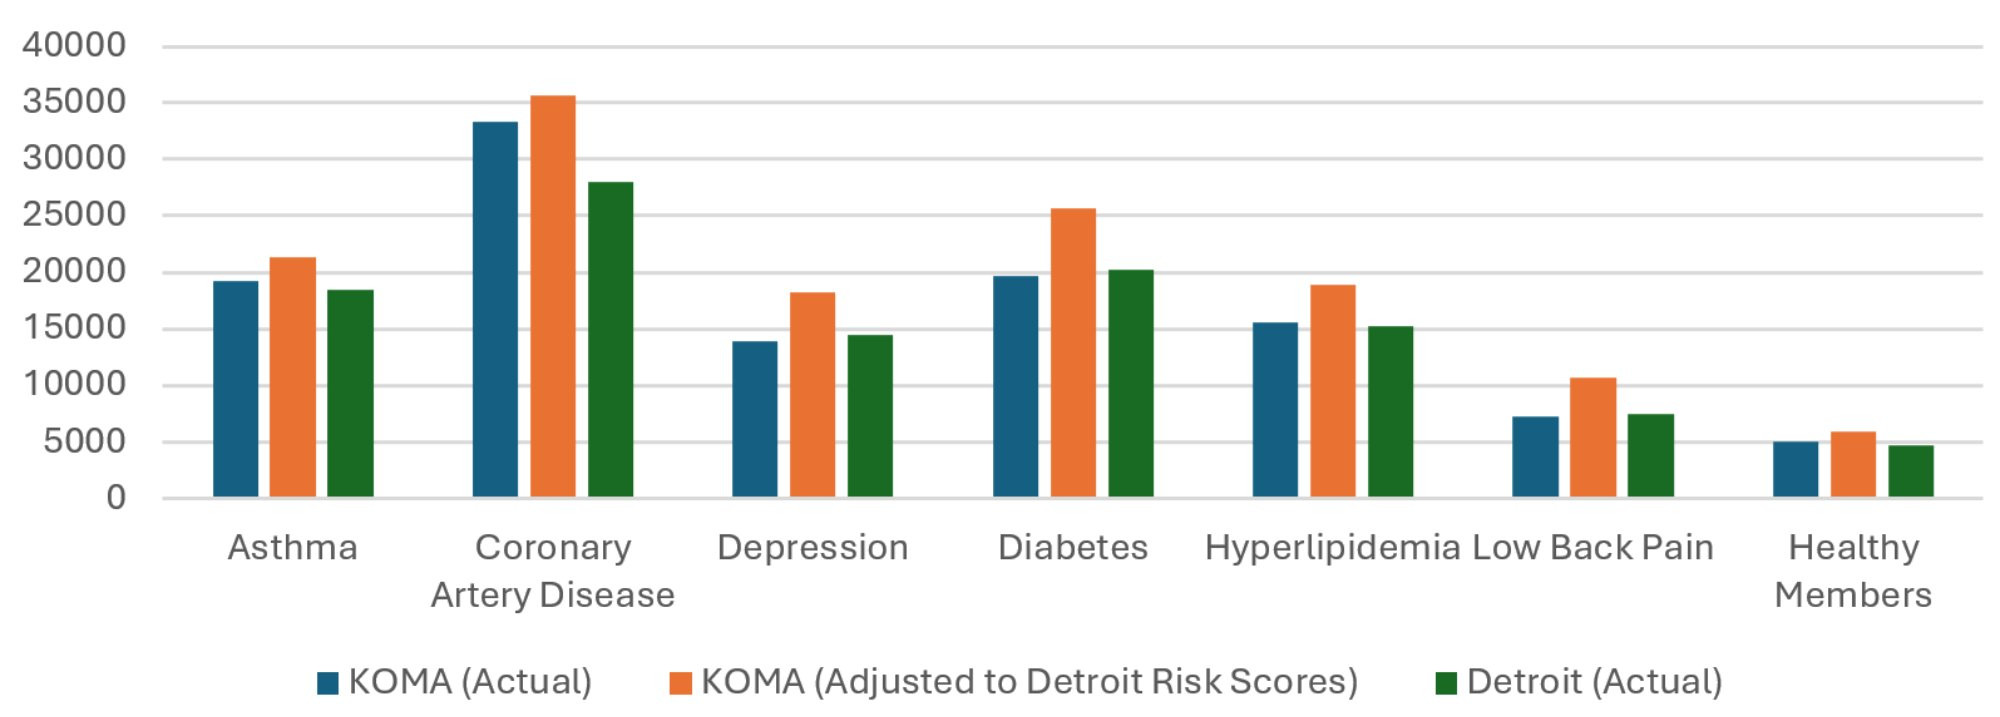
Description: The Average Expenditures per Member with Risk-Adjusted KOMA Values, 2024 graph shows the average insurer expenditures in both KOMA and Detroit regions, as well as a risk-adjusted version of KOMA’s, for each member diagnosed with one of six chronic conditions (asthma, coronary artery disease, depression, diabetes, hyperlipidemia, and low back pain) as well as for health members in 2024. The risk-adjusted KOMA expenditures tend to be significantly higher than both the unadjusted KOMA and Detroit expenditures.
Source: BCBSM, BCN, and Priority Health member data (2025).
Health Services Use
Figures 4a through 4c examine regional differences in health care utilization for each of the six conditions. This is the ninth year that we have been able to include utilization data in our analysis, and this brings us closer to identifying the causes behind the documented expenditure growth.
Figure 4a displays the average number of annual inpatient visits for members in KOMA and the Detroit region in 2024. This figure is consistent with the previous three Health Check reports in showing that hospitalization rates tend to be higher on the east side of the state than the west. For example, members with diabetes experience an average of 0.11 inpatient admissions per year in KOMA, while those in Detroit average 0.17 hospital visits per year, making KOMA’s inpatient visits per member being 34 percent lower than Detroit’s. This percentage gap in 2024 is slightly lower than the previous year’s 38 percent difference. The other conditions show both growing and shrinking gaps. Shrinking percentage gaps are observed for CAD (14 to 5 percent) and hyperlipidemia (31 to 25 percent). On the other hand, the gaps have grown for depression (17 to 18 percent), and low back pain (12 to 16 percent). Only asthma showed a percentage gap that was relatively unchanged at 27 percent. This represents some steadying when compared to the last five years, which showed substantial narrowing of the inpatient gaps in inpatient visits. For now, at least, KOMA maintains its advantage over the Detroit region in inpatient utilization.
Figure 4a: Average Annual Inpatient Visits per Member, 2024
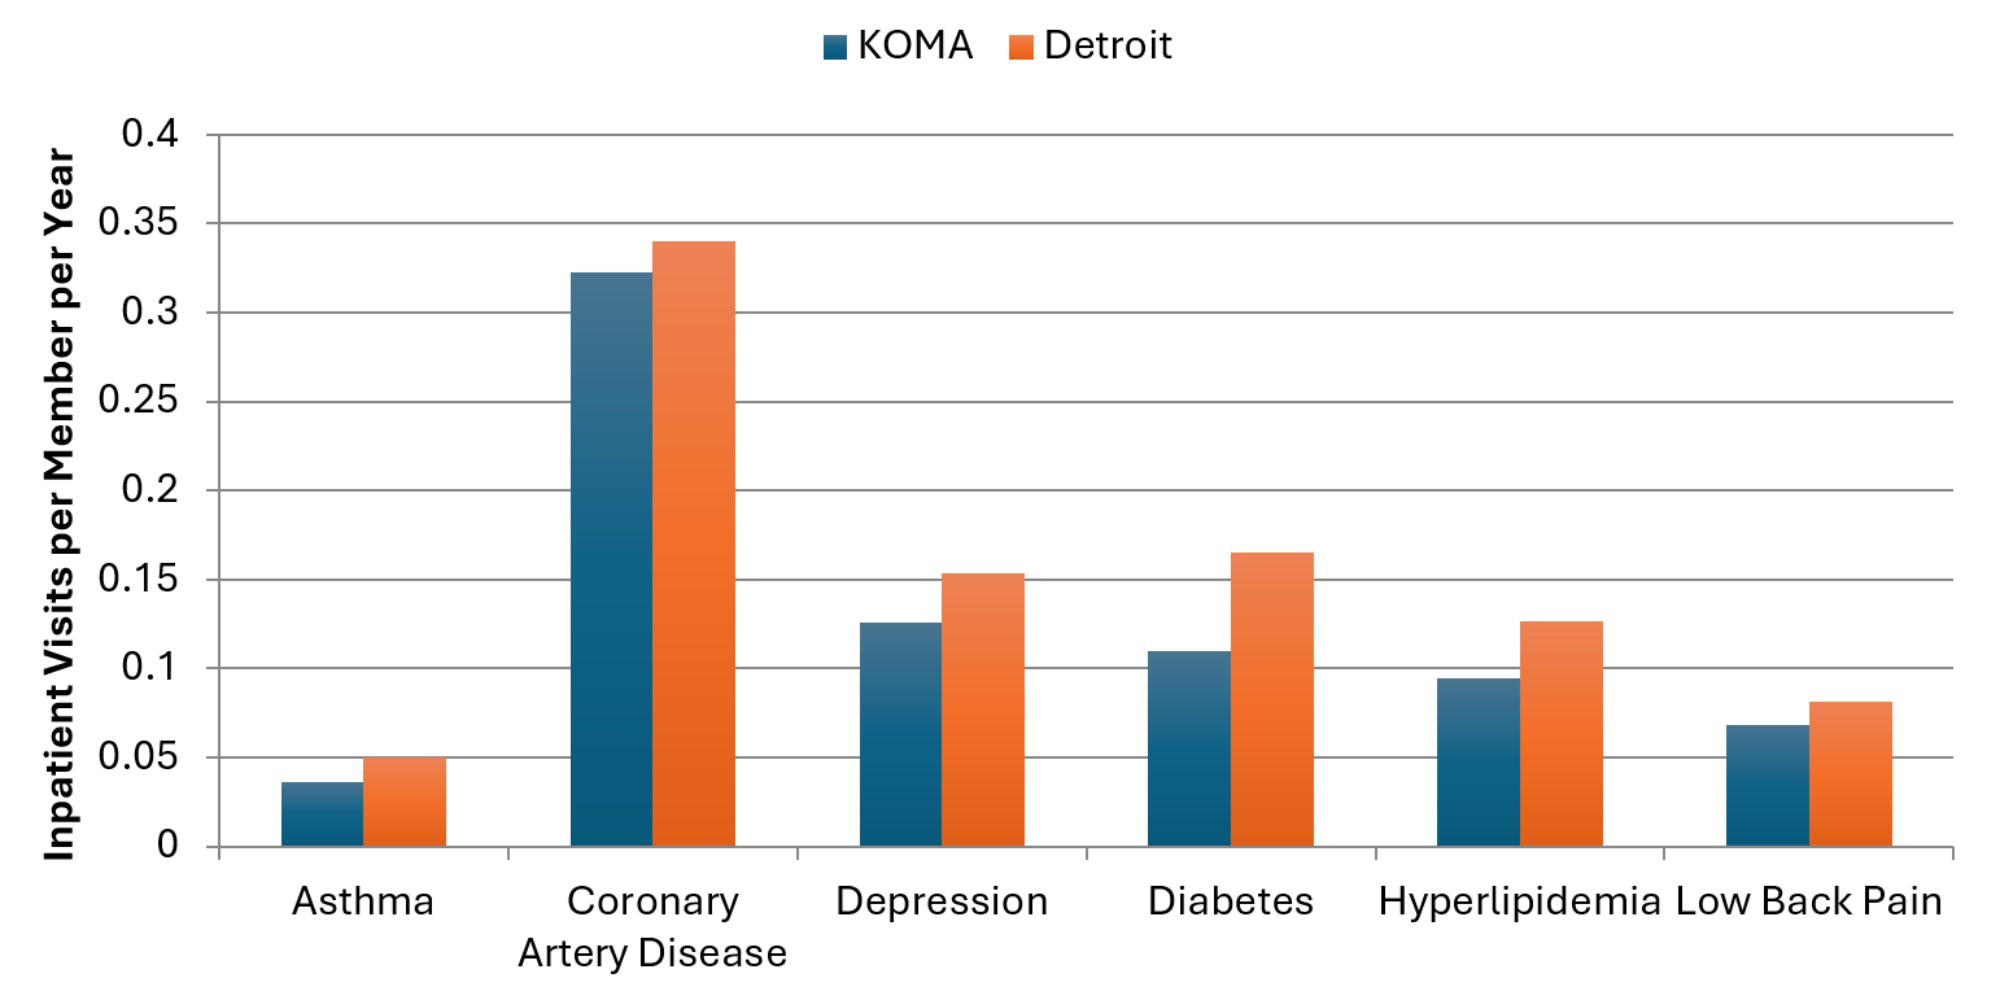
Description: The Average Annual Inpatient Visits per Member, 2024 graph shows the average annual inpatient visits per member in both KOMA and Detroit regions for each member diagnosed with one of six chronic conditions (asthma, coronary artery disease, depression, diabetes, hyperlipidemia, and low back pain) in 2024. For all chronic conditions, inpatient visits per member are higher in Detroit than in Grand Rapids.
Source: BCBSM, BCN, and Priority Health member data (2025).
Figure 4b extends the utilization analysis to emergency department (ED) use. In general, ED use has been higher in the Detroit region than in KOMA for all six chronic conditions in recent years. For example, those with a low back pain diagnosis average 0.56 ED visits per year in Detroit compared to 0.40 ED visits per year in the KOMA region (indicating that we observe approximately 29 percent fewer ED visits per member in KOMA for lower back pain than in Detroit). This gap was 34 percent in 2023, however, and so this figure continues to show some evidence of narrowing gaps between the two regions in utilization of expensive forms of care. The ED visit gap for diabetes has narrowed slightly from being 14 percent less in KOMA than in Detroit in 2023, down to 13 percent in 2024. The most significant reduction in frequency gap is seen for CAD. While those in KOMA consumed two percent fewer ED visits per member with CAD than in the Detroit region in 2023, that difference has reversed in 2024. ED visits per member with CAD are now two percent more frequent in KOMA than in Detroit. The percentage gaps for depression and hyperlipidemia are relatively unchanged. Only asthma has exhibited a growing gap in KOMA’s favor. Annual ED visits per member with asthma were 14 percent less frequent in Koma than in Detroit in 2023, but that gap has grown to 20 percent. Overall, per-member ED utilization clearly remains higher in the Detroit region than in the KOMA region for each of these diagnoses, while changes in the gaps have differed across conditions.
Figure 4b: Average Annual Emergency Department Visits per Member, 2024
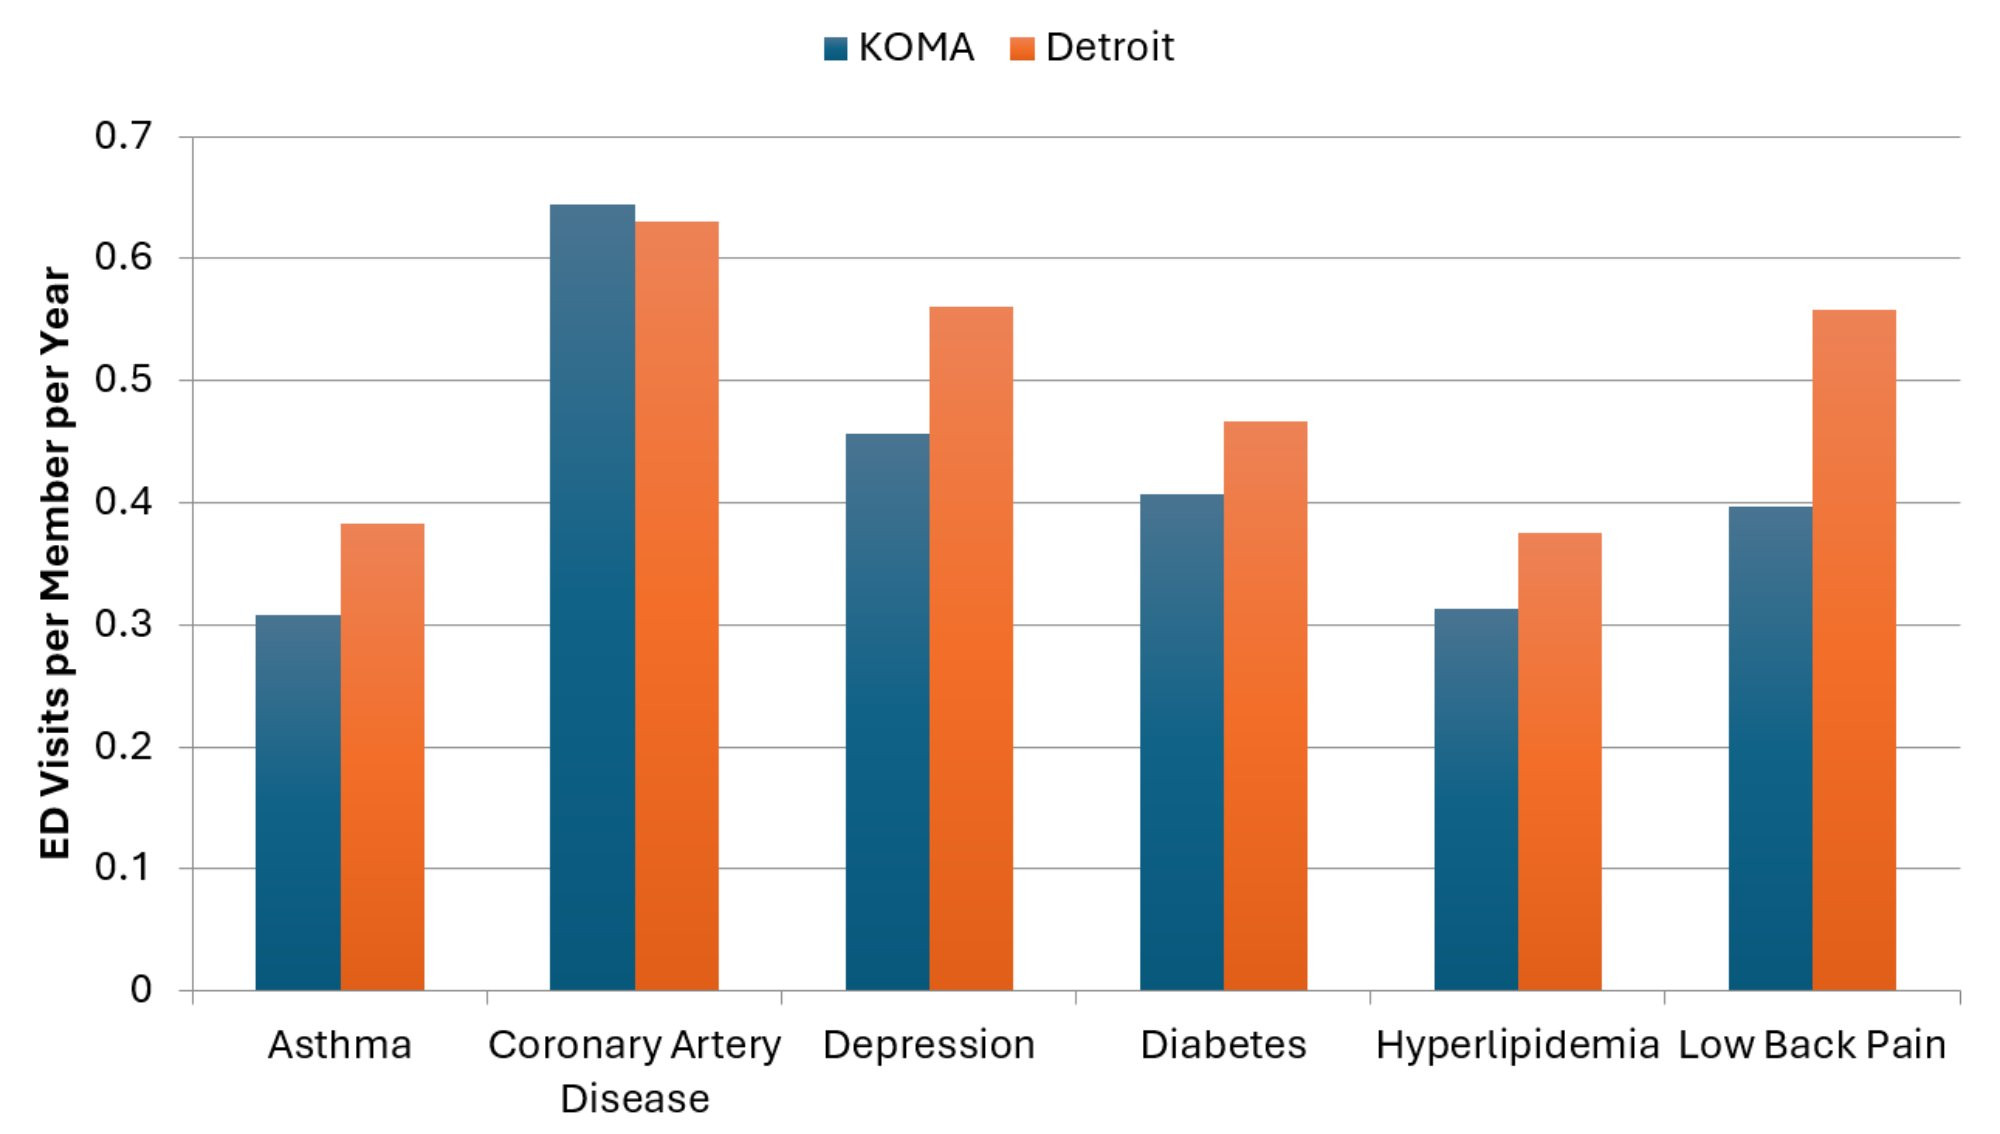
Description: The Average Annual Emergency Department Visits per Member, 2024 graph shows the average annual emergency department visits per member in both KOMA and Detroit regions for each member diagnosed with one of six chronic conditions (asthma, coronary artery disease, depression, diabetes, hyperlipidemia, and low back pain) in 2024. For all chronic conditions, except for CAD, emergency department visits per member are higher in Detroit than in Grand Rapids.
Source: BCBSM, BCN, and Priority Health member data (2025).
Next, utilization in terms of prescription drug fills is presented in Figure 4c. As in the previous report, we find evidence of higher use rates in the Detroit region than in the KOMA region. For example, the average member with diabetes in the KOMA region had 65 prescription fills in 2024 compared to 71 for individuals with diabetes in the Detroit region. Assuming that each member filled a prescription 12 times throughout the year, then this would represent an average of approximately five distinct prescriptions for a person with diabetes in KOMA and just under six distinct prescriptions for one in Detroit. Beyond diabetes, we note an average of 10 percent fewer prescription fills in KOMA than in Detroit for members with a depression diagnosis (up from 6 percent last year), and similarly 20 percent fewer prescription fills in KOMA for members with a low back pain diagnosis (up from 15 percent). Therefore, unlike inpatient visits and ED usage, rates of prescription drug utilization have grown between the two regions. This is true across all six chronic conditions in 2024.
Figure 4c: Average Annual Prescription Fills per Member, 2024
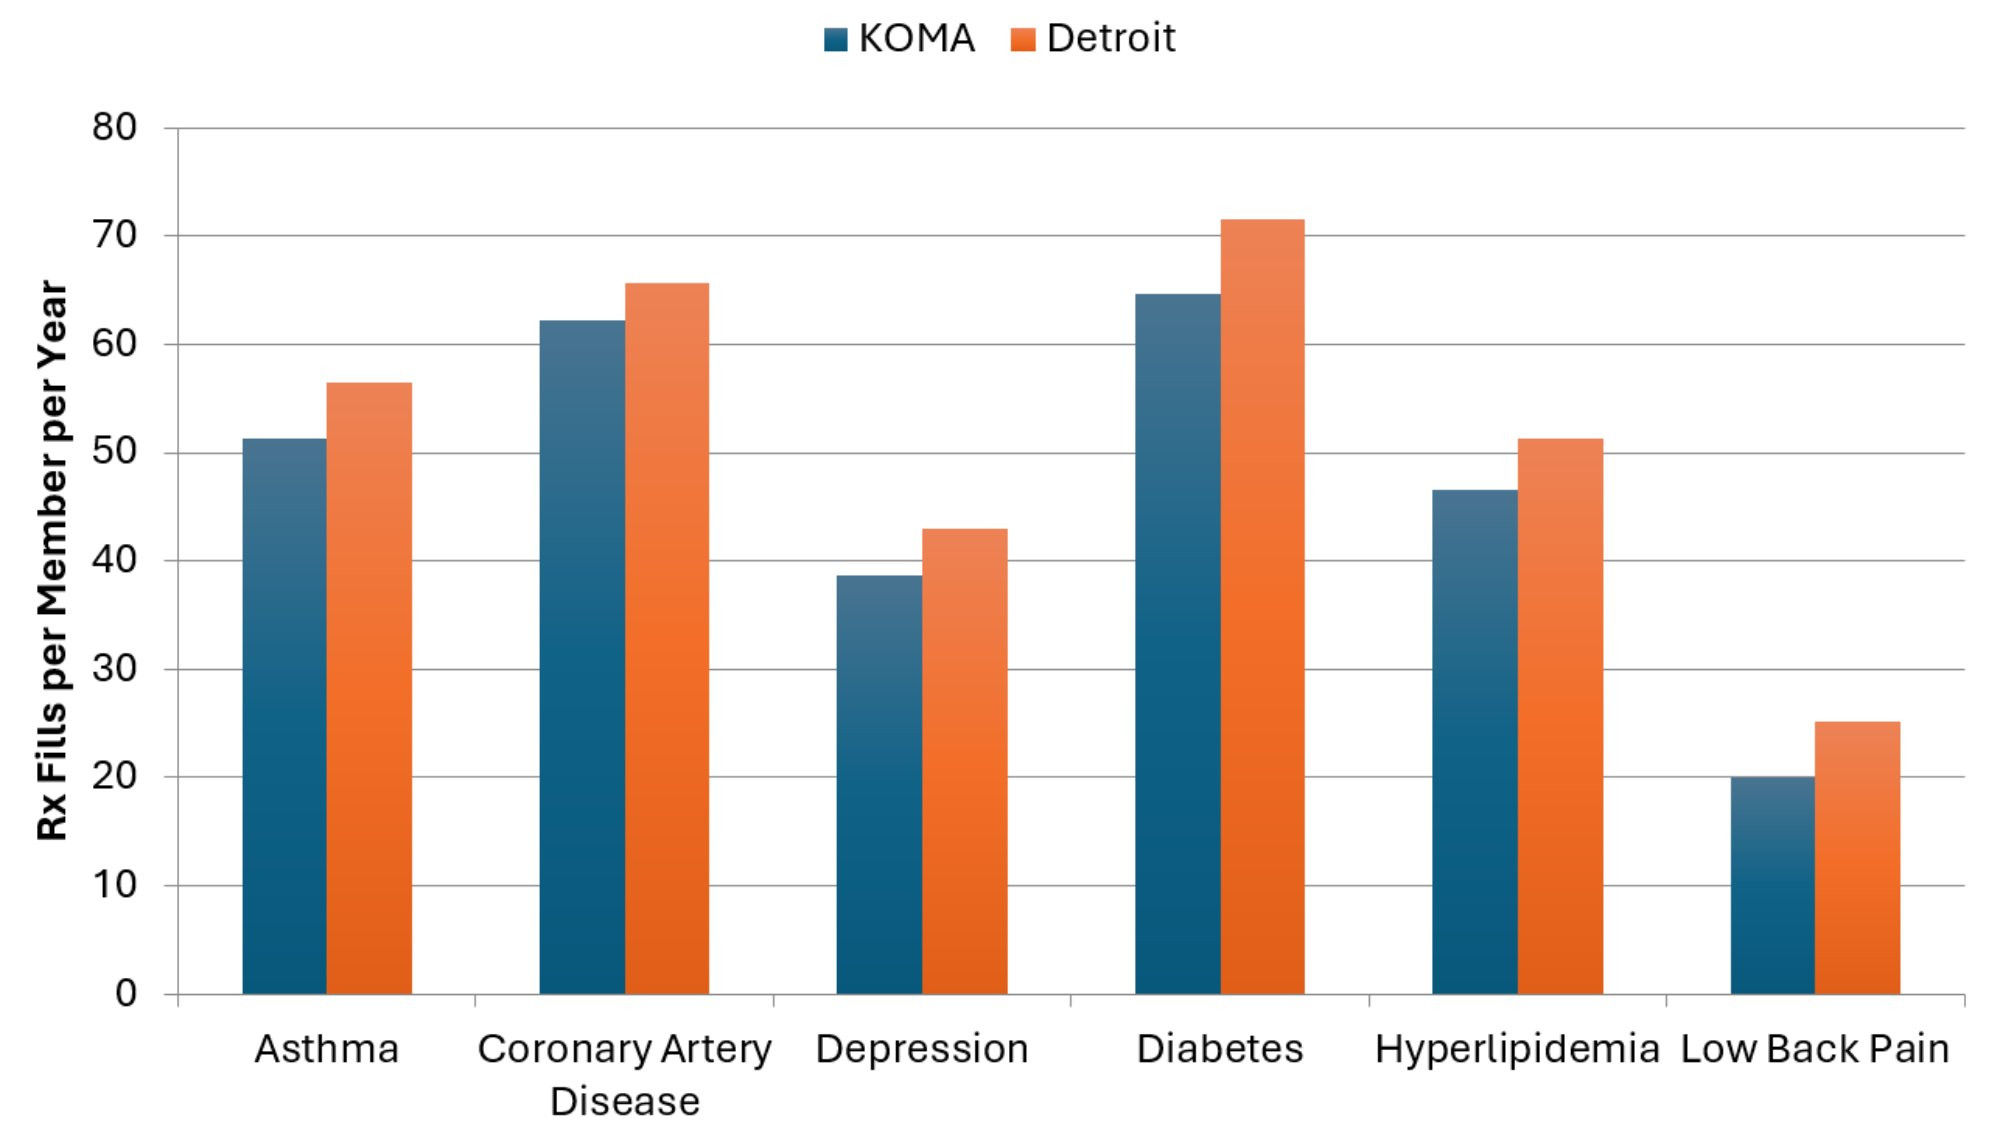
Description: The Average Annual Prescription Fills per Member, 2024 graph shows the average annual prescription fills per member in both KOMA and Detroit regions for each member diagnosed with one of six chronic conditions (asthma, coronary artery disease, depression, diabetes, hyperlipidemia, and low back pain) in 2024. For all chronic conditions, prescription fills per member are higher in Detroit than in Grand Rapids.
Source: BCBSM, BCN, and Priority Health member data (2025).
Annual telehealth visits per member constitute the final utilization metric examined here, in Figure 4d. The Detroit region continues to utilize telehealth to a greater degree than the KOMA region across all six chronic conditions. After observing massive percent changes in telehealth utilization in the years during and after the COVID-19 pandemic, the percent changes this year are relatively small (usually within 15 percent in magnitude) and so usage appears to be leveling off. Compared to 2018, the number of telehealth visits per member are between 12 times (for low back pain) and 29 times (for depression) greater in 2024. While telehealth usage still tended to fall on both sides of the state, the exception was for asthma in KOMA, where utilization grew by almost 14 percent.
Figure 4d: Average Annual Telehealth Visits per Member, 2024
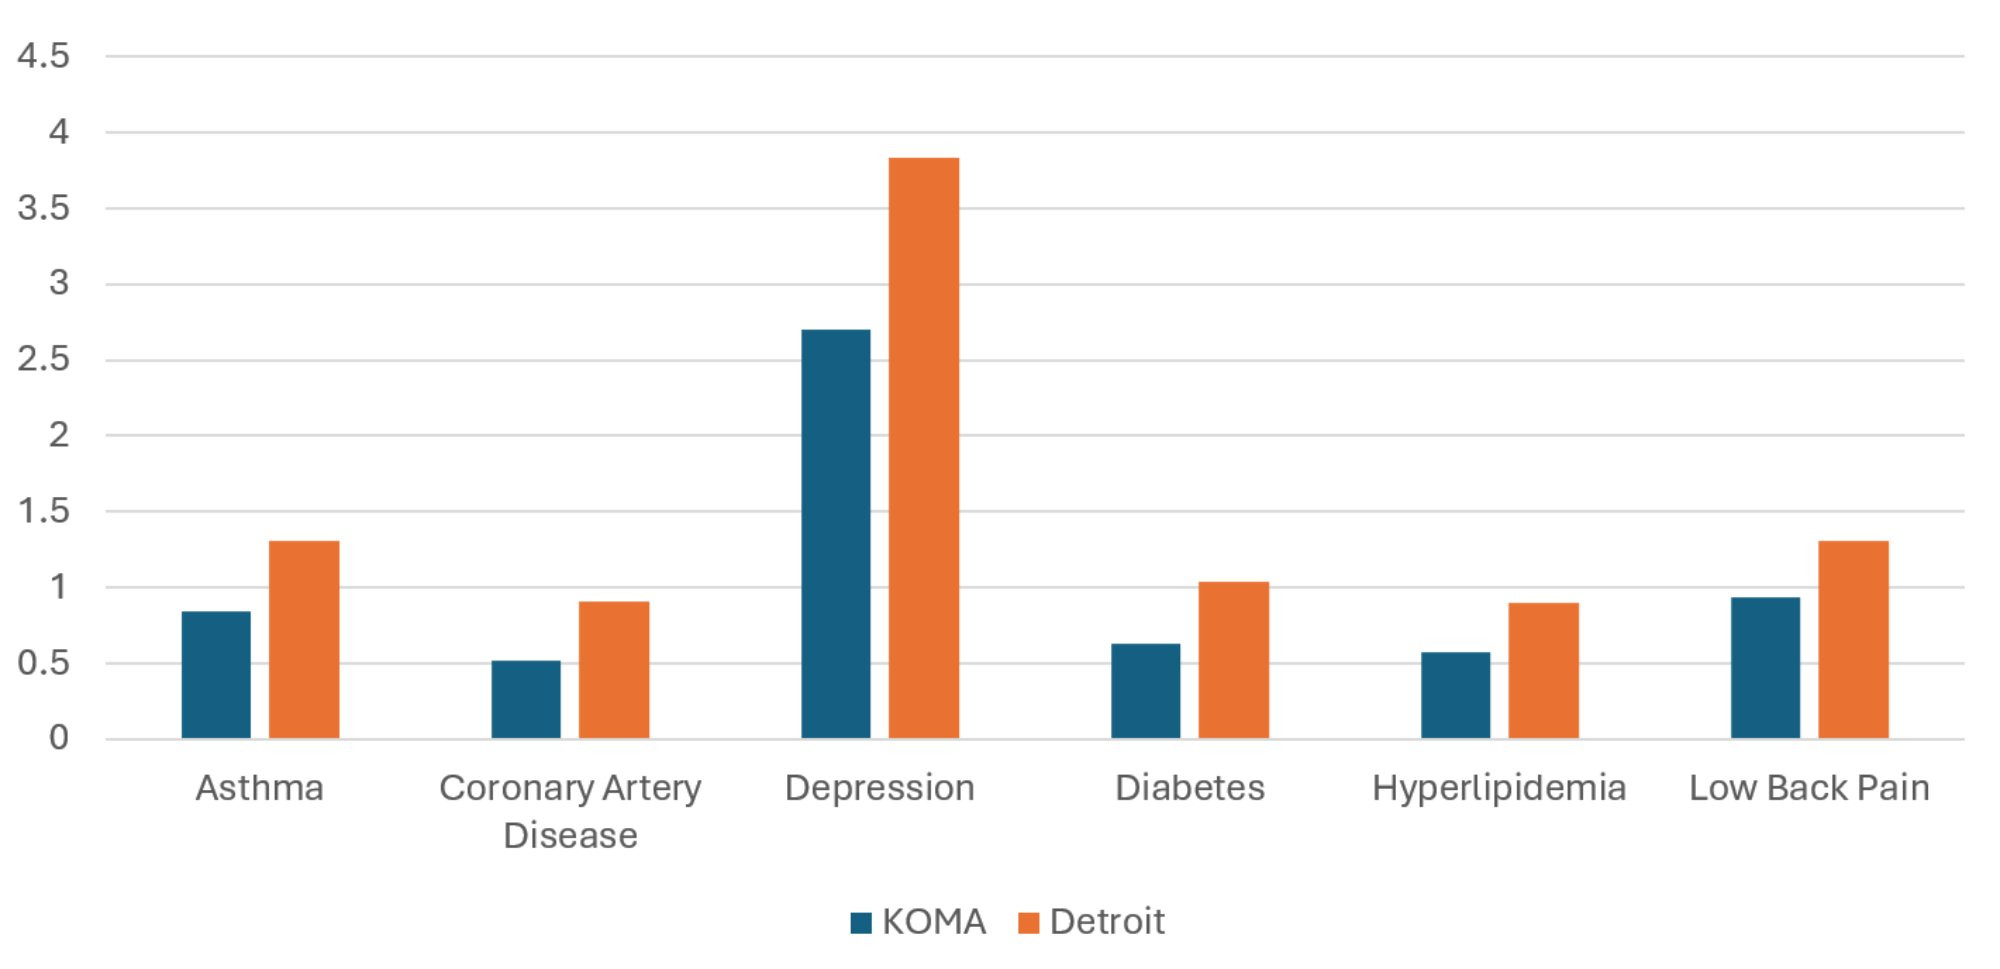
Description: The Average Annual Telehealth Visits per Member, 2024 graph shows the average annual telehealth visits per member in both KOMA and Detroit regions for each member diagnosed with one of six chronic conditions (asthma, coronary artery disease, depression, diabetes, hyperlipidemia, and low back pain) in 2024. For all chronic conditions, telehealth visits per member are higher in Detroit than in Grand Rapids.
Source: BCBSM, BCN, and Priority Health member data (2025).
Figure 4e: 2023–2024 Percentage Change in Average Telehealth Visits per Member
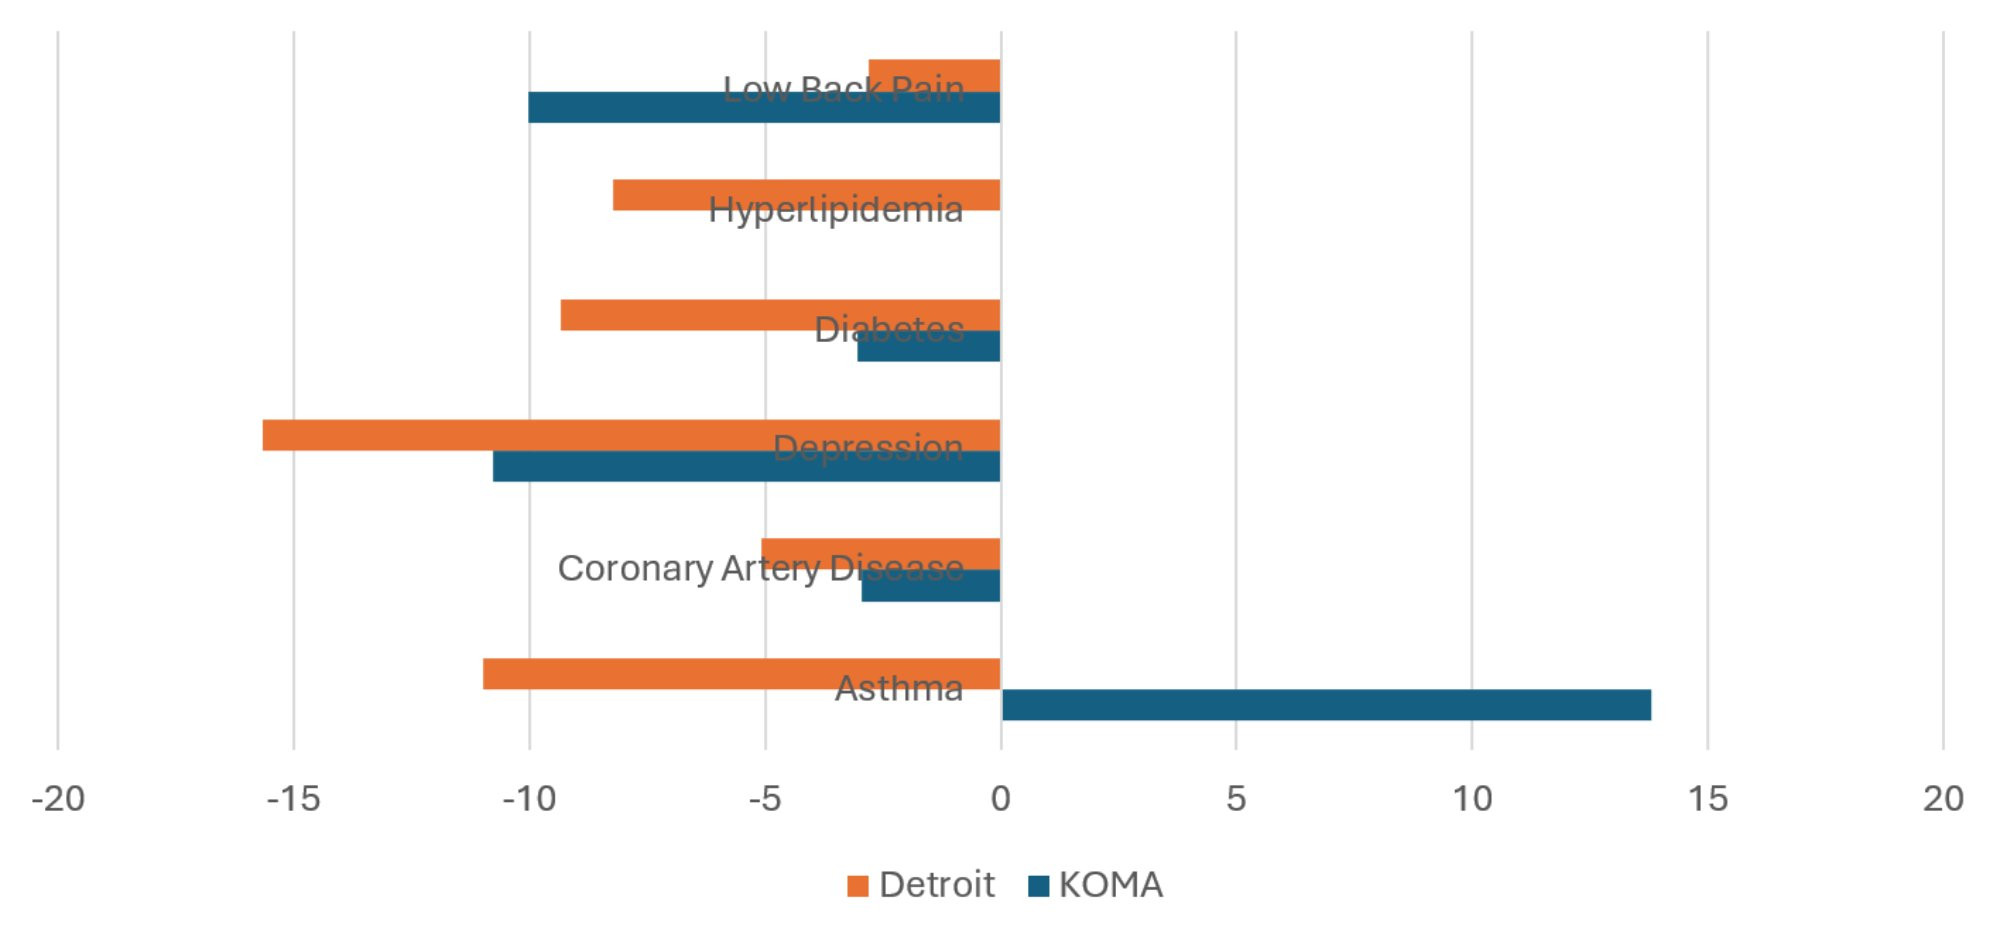
Description: The 2023-2024 Percentage Change in Average Telehealth Visits per Member graph shows the percent change in average annual telehealth visits per member in both KOMA and Detroit regions for each member diagnosed with one of six chronic conditions (asthma, coronary artery disease, depression, diabetes, hyperlipidemia, and low back pain) as well as for health members, between 2023 and 2024. For almost all chronic conditions, and in both regions, telehealth visits have declined Asthma in KOMA is the exception, where telehealth visits have increased substantially.
Source: BCBSM, BCN, and Priority Health member data (2025).
Comorbidities
In this section, we take a closer look at expenditures associated with diabetes and depression by examining the impact of additional diagnoses. Joint diagnoses and the presence of multiple comorbidities can lead to higher resource utilization and higher levels of spending. Importantly, we are not examining clinical linkages between these conditions, but rather only focusing on expenditure differences associated with multiple diagnoses. Figure 5a plots average annual member expenditures for those with only a diagnosis of diabetes, those with diagnoses of diabetes and asthma, diabetes and hypertension, diabetes and depression, and diabetes and CAD. According to Figure 5a, the addition of comorbidities greatly impacts the average expenditures associated with a diagnosis of diabetes. For example, expenditures in KOMA for a member diagnosed with diabetes and depression compared to a diagnosis of diabetes alone adds about $12,807 to the annual expenditure estimate, while a diagnosis of diabetes and CAD (instead of diabetes alone) adds $26,508 to the expenditure estimate. These are significantly higher differences for both combinations of diagnoses compared to previous years.
Figure 5a: Expenditures on Members with Diabetes and Comorbidities, 2024
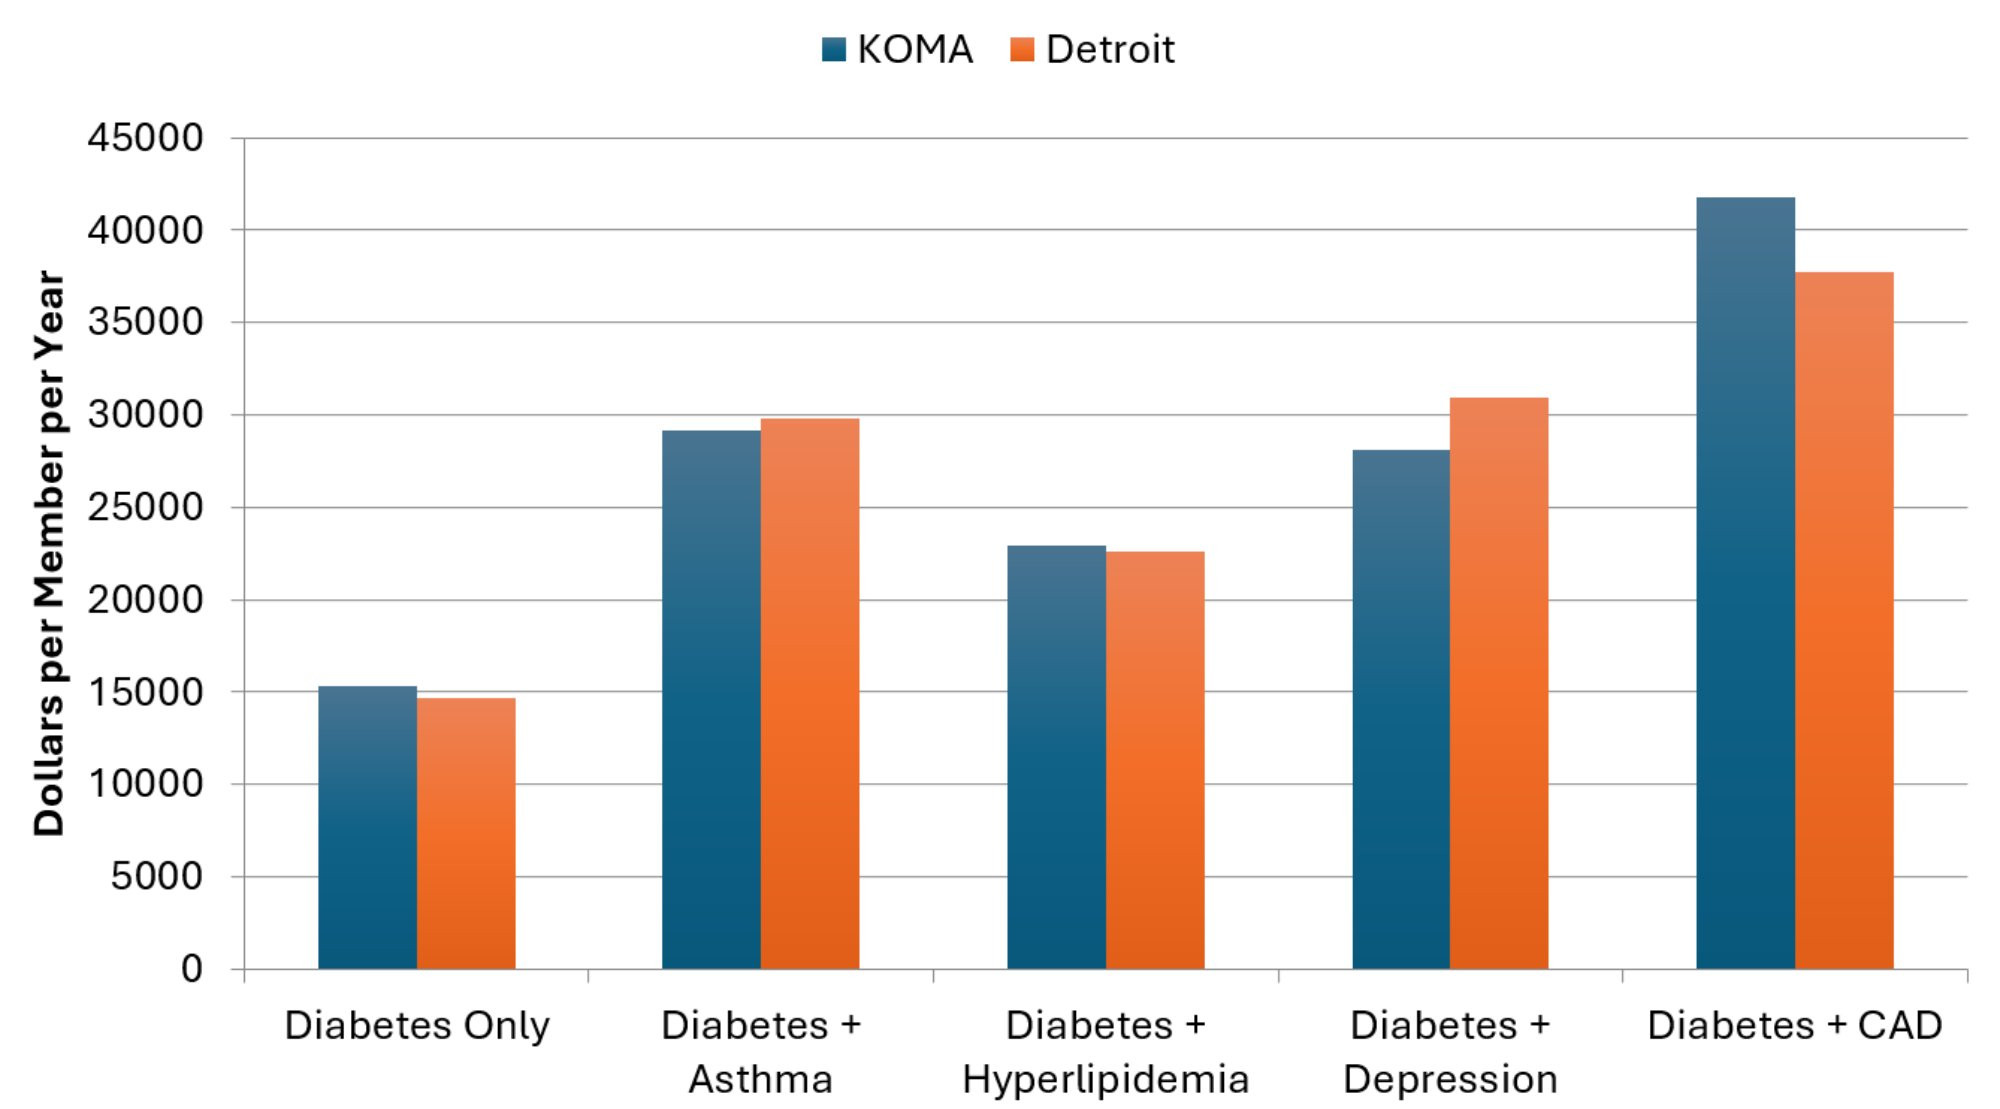
Description: The Expenditures on Members with Diabetes and Comorbidities, 2024 graph shows the average 2024 insurer expenditures in both KOMA and Detroit regions for each member with only a diabetes diagnosis, as well as diabetes in combination with asthma, hyperlipidemia, depression, and coronary artery disease. For both regions, combinations of conditions result in expenditure greater than for members with each condition separately.
Source: BCBSM, BCN, and Priority Health member data (2025).
Figure 5b displays the results of a similar analysis that focuses on depression. The results are consistent with those in Figure 5a: the presence of multiple conditions greatly increases average annual expenditures for members with depression. For example, expenditures in Detroit for a member diagnosed with depression and CAD compared to a diagnosis of depression alone adds about $34,348 to the expenditure estimate, which is an increase from the previous year.
Figure 5b: Expenditures for Members with Depression and Comorbidities, 2024
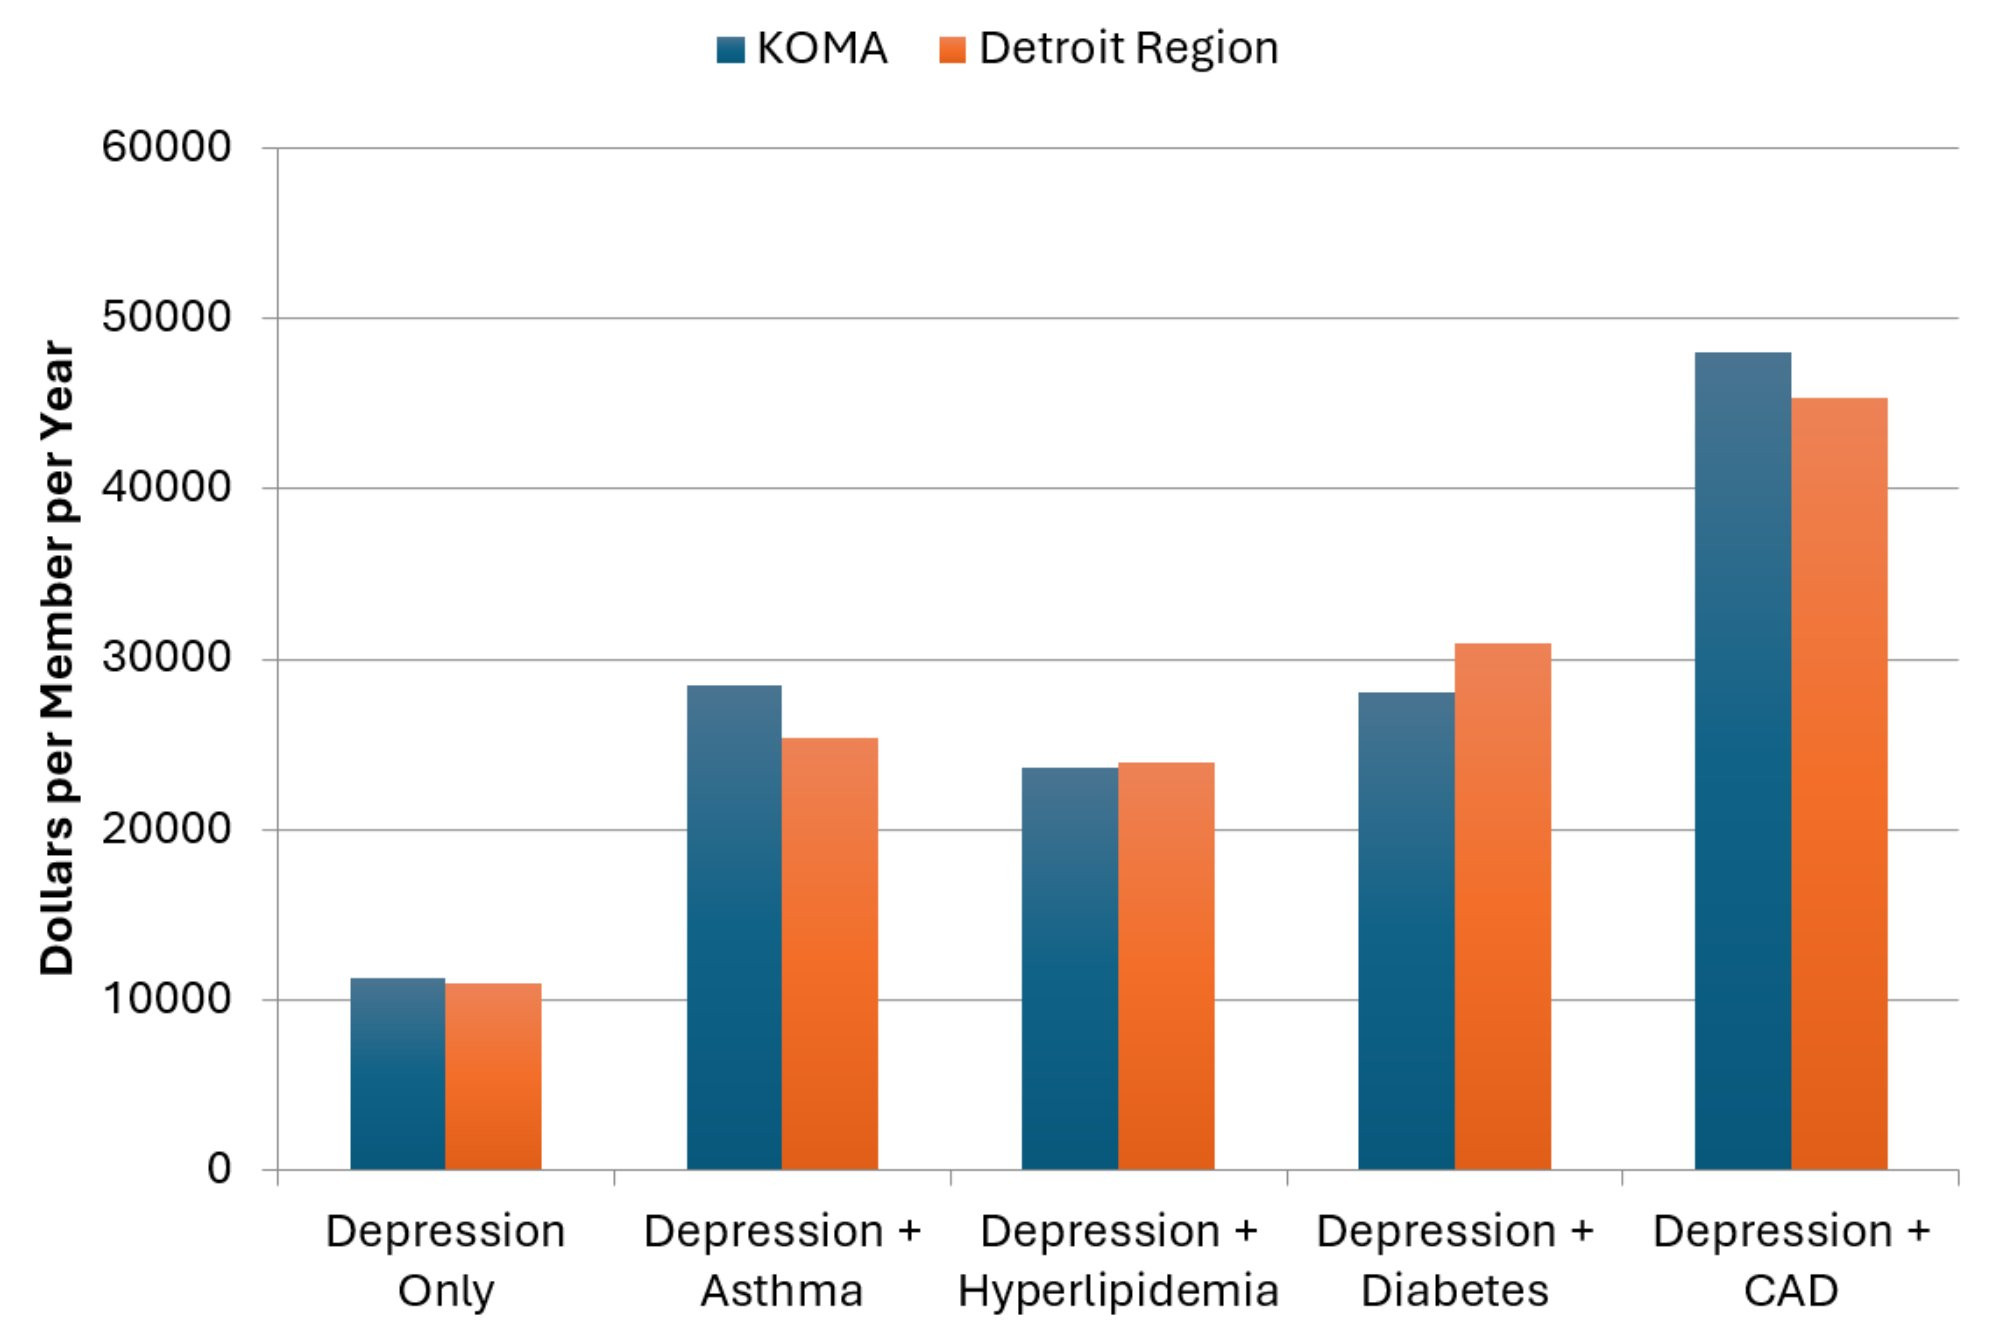
Description: The Expenditures on Members with Depression and Comorbidities, 2024 graph shows the average 2024 insurer expenditures in both KOMA and Detroit regions for each member with only a depression diagnosis, as well as depression in combination with asthma, hyperlipidemia, diabetes, and coronary artery disease. For both regions, combinations of conditions result in expenditure greater than for members with each condition separately.
Source: BCBSM, BCN, and Priority Health member data (2025).
Lastly, looking across Figures 5a and 5b we further note that expenditures for comorbidities do not appear to be additive. That is, average expenditures for members who suffer from both diabetes and depression are higher than if we simply added the average expenditure of a member who suffers from only diabetes with the average expenditure of a member diagnosed with only depression. For KOMA in 2024, the expenditure difference adds up to about $1,522 (more than double the $807 in 2023), while the same difference is larger at $5,219 in the Detroit region, up from $4,761 in 2023.
References
Global Initiative for Asthma. (2024). Global Strategy for Asthma Prevention and Management (2024 Update). Global Initiative for Asthma. Retrieved on December 4, 2025 from https://ginasthma.org/2024-report/.
Ji, L., & Liu. F. (2007). HMO versus non-HMO private managed care plans: An investigation on pre-switch consumption. Health Care Management Science, 10(1), 67-80.
Nicholson, S., Bundorf, K., Stein, R.M., & Polsky, D. (2004). The magnitude and nature of risk selection in employer- sponsored health plans. Health Services Research, 39(6 pt. 1), 1817-1838.
Schaefer, E., & Reschovsky. J.D. (2002). Are HMO enrollees healthier than others? Results from the Community Tracking Study. Health Affairs, 21(3), 249-258.
Tchernis, R., Normand, S.T., Pakes, J., Gaccione, P., & Newhouse. J.P. (2006). Selection and plan switching behavior. Inquiry, 43(1), 10-22.

Daniel Montanera, Ph.D., Associate Professor, Department of Economics