Benchmarking Communities
By Daniel Montanera, Ph.D., Associate Professor, Department of Economics, Seidman College of Business, Grand Valley State University
In this section, we compare the Grand Rapids combined statistical area to a selected group of metropolitan areas to examine differences in the supply of hospital services, hospital expenses, and Medicare expenditures.[1] We compare changes in hospital utilization and expenditures for the Grand Rapids region to changes for a benchmark region calculated as the population weighted outcome average for Louisville, KY; Buffalo, NY; Rochester, NY; and Milwaukee, WI. These regions were selected as benchmark communities based on similarities to Grand Rapids in a variety of regional metrics including population density, earnings estimates, unemployment rates, and population age and race distributions. We also include data for the Detroit region and for the entire United States.
The Supply and Utilization of Hospital Services
Figures 1-6 are constructed using data from the 2025 edition of the American Hospital Association (AHA) Annual Survey, managed by Wharton Research Data Services (2024), which covers survey responses regarding variables of interest in 2023 (American Hospital Association, 2025). These figures focus on both hospital capacity and utilization across Grand Rapids and the benchmark comparison regions. Utilization measures such as admissions, outpatient hospital visits, and emergency department visits are measured as per capita rates using the number of residents in each region as the denominator. As noted previously, a downside to the use of these per capita utilization rates is that they do not account for the inflow of patients from outside the region or the outflow of patients to other regions. As such, if individuals are traveling to a region to receive care despite living outside of that region, those individuals will contribute to the numerator in the utilization calculation, but not to the denominator. In cases where patient inflow is particularly high, utilization measures will be overstated.
Figure 1: Hospital Beds per 1,000 Population
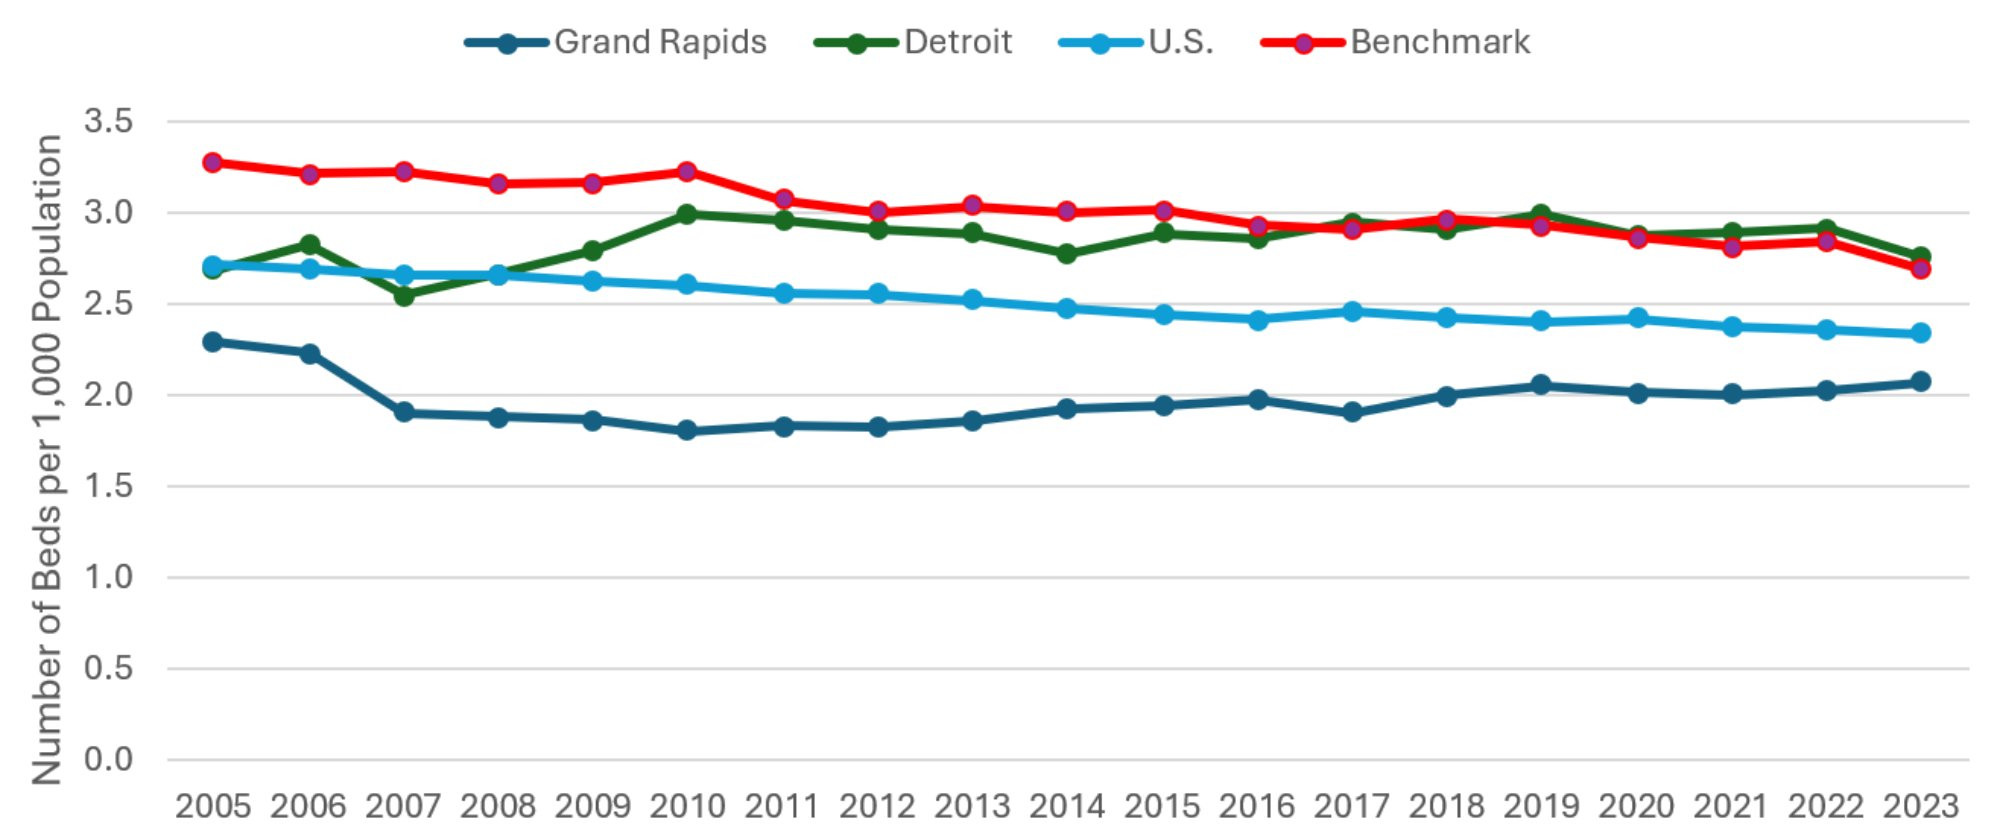
Description: The Hospital Beds per 1000 Population graph shows the total number of hospital beds divided by total population, with one series each for Grand Rapids, Detroit, the entire US, and the benchmark communities (a mix of Buffalo NY, Rochester NY, Louisville KY, and Milwaukee WI) from 2005 to 2023. Beds per capita in the other three comparison communities have been declining gradually and slowly converging on that of Grand Rapids, which is consistently the lowest.
Source: American Hospital Association (2025).
Figure 1 includes data on the number of hospital beds per 1,000 residents in each region from 2005 to 2023. This measure serves as a proxy for hospital capacity. Most regions have experienced slight declines in hospital capacity over the past year. Grand Rapids is the exception with a slight increase. The relative positions of the communities observed in previous versions of this report remain largely unchanged. As it historically has, hospital capacity in Grand Rapids remains low relative the U.S. average, and well below the capacities of Detroit and the benchmark communities. Given that hospital care is expensive relative to other health services, this represents a comparative advantage for the region by way of the lower cost of care passed along to employers. While this remains good news for Grand Rapids, the long run trend continues showing the hospital capacity of the other regions converging on that of Grand Rapids, meaning this comparative advantage may slowly be eroding. Furthermore, while steady hospital capacity would suggest relatively constant levels of access and quality of care for a given population, this capacity may become strained as the population ages or becomes sicker.
Figure 2: Hospital Admissions per 1,000 Population
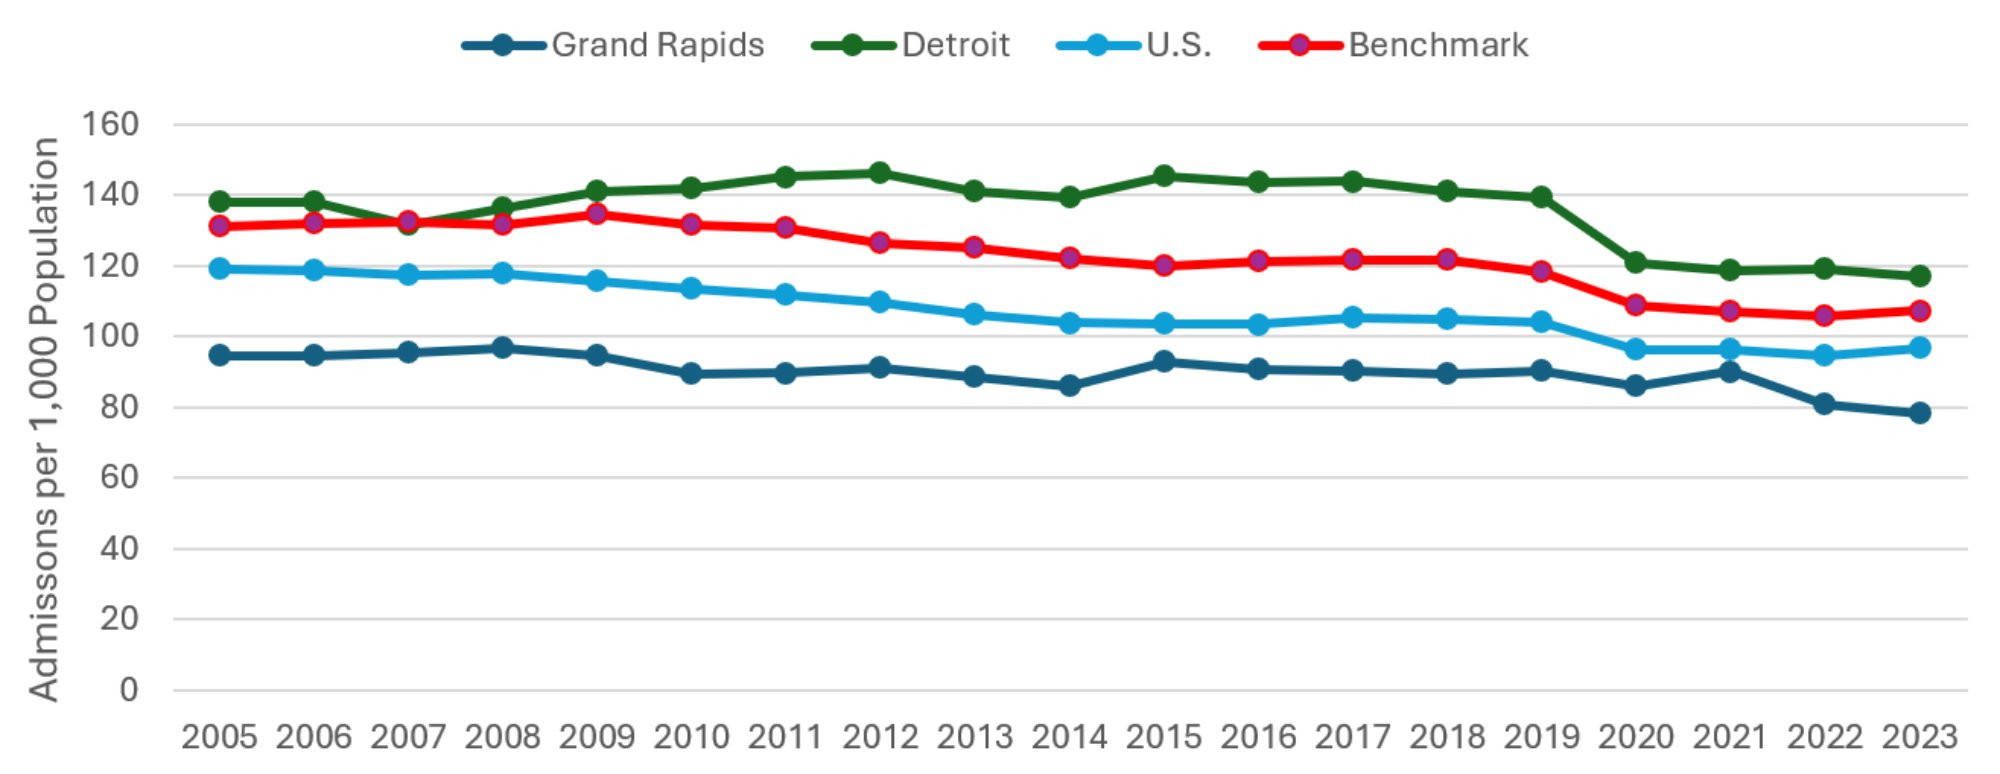
Description: The Hospital Admissions per 1000 Population graph shows the total number of hospital admissions divided by total population, with one series each for Grand Rapids, Detroit, the entire US, and the benchmark communities (a mix of Buffalo NY, Rochester NY, Louisville KY, and Milwaukee WI) from 2005 to 2023. Grand Rapids is consistently the lowest of the four, reaching its lowest ever level in 2023.
Source: American Hospital Association (2025).
Figure 2 displays the number of hospital admissions per 1,000 residents. While Figure 1 focuses on inpatient capacity, Figure 2 summarizes the data on inpatient utilization. While per-capita admissions remained steady for the three comparison communities, Grand Rapids experienced a three percent decline relative to the previous year. For the second year in a row, Grand Rapids has reached its lowest level of hospital utilization ever recorded in this series of reports, with 78.27 hospital admissions per 1000 population being 19 percent below the national average. This is the greatest percentage difference observed since 2011, and shows Grand Rapids’ comparative advantage in hospitalization rates increasing in recent years.
Figure 3: Outpatient Visits to Hospitals per 1,000 Population
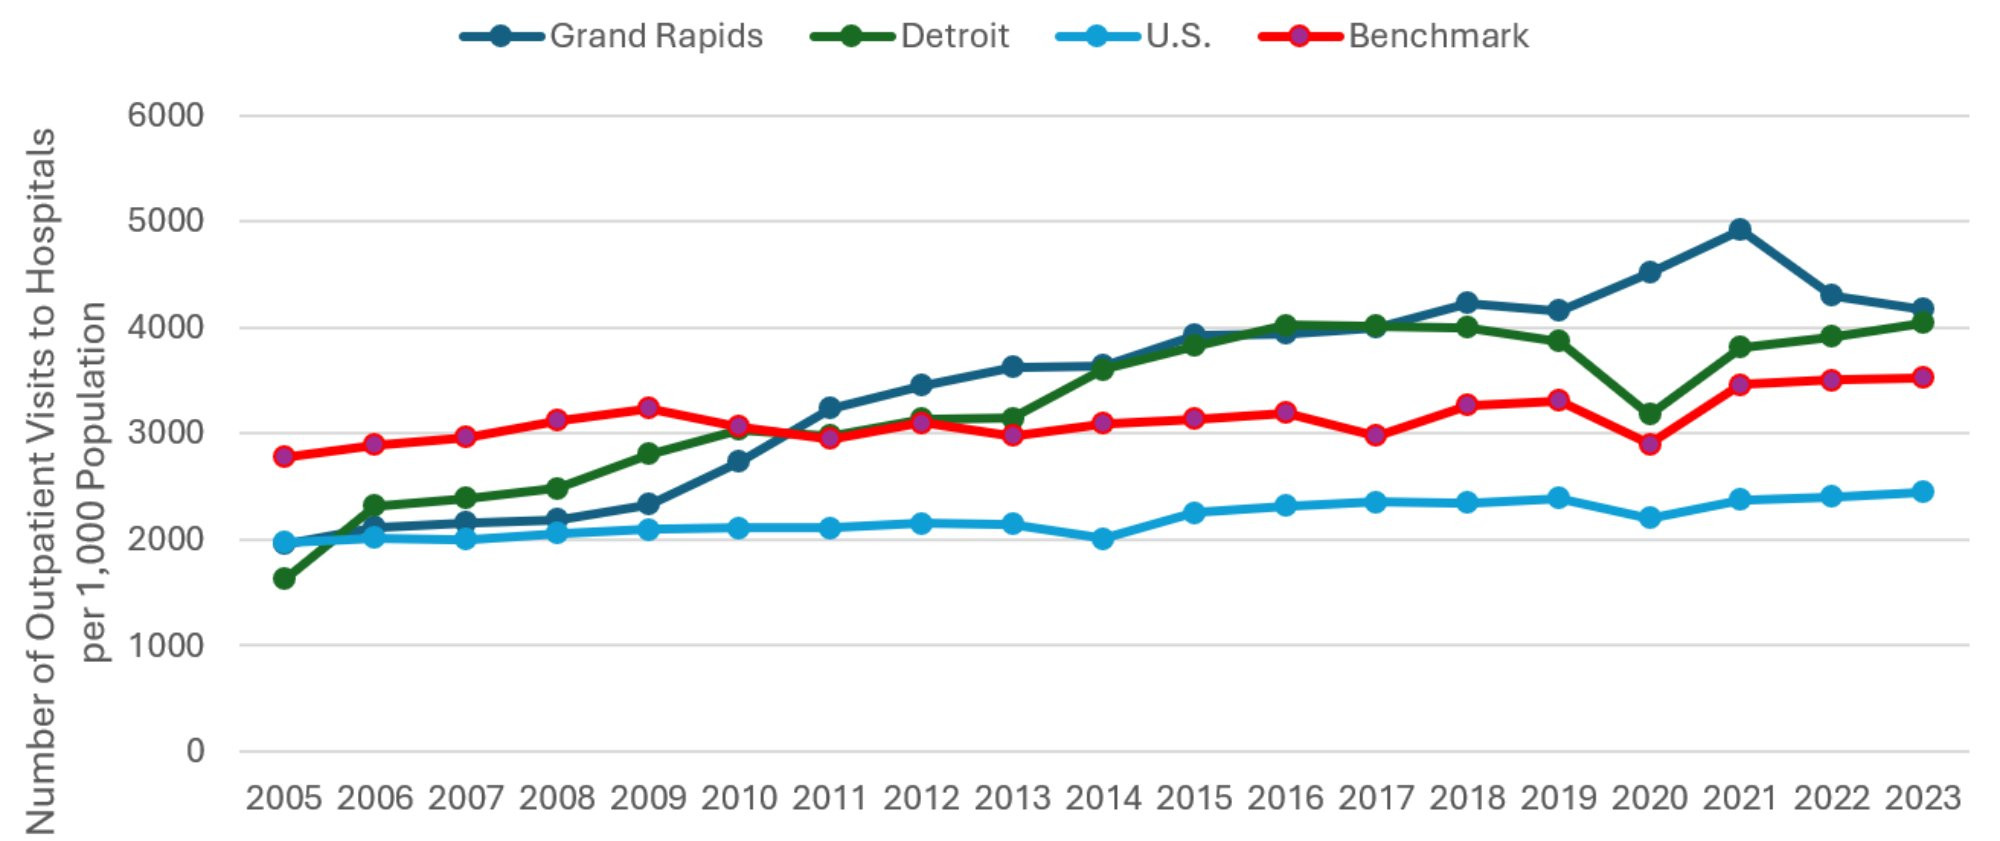
Description: The Outpatient Visits to Hospital per 1000 Population graph shows the total number of outpatient visits to hospital facilities divided by total population, with one series each for Grand Rapids, Detroit, the entire US, and the benchmark communities (a mix of Buffalo NY, Rochester NY, Louisville KY, and Milwaukee WI) from 2005 to 2023. Per capita visits in Grand Rapids are the highest of the four, though the difference has narrowed in the last two years.
Source: American Hospital Association (2025).
Figure 3 plots per capita outpatient visits from 2005 to 2023. All communities are firmly back on their pre-COVID trends. Grand Rapids is the only one to experience a decline in outpatient utilization from 2022 to 2023, and it was modest at three percent. The gap in outpatient utilization between Grand Rapids and every other comparison community has narrowed slightly. Outpatient utilization rates are now virtually the same in Grand Rapids and Detroit, shrinking from 10 percent to three percent between 2022 and 2023. Grand Rapids’ outpatient visits per capita is now only 18 percent higher (down from 23 percent) than that of the benchmark communities. The gap in outpatient visits per capital between Grand Rapids and the rest of the country has narrowed slightly, with Grand Rapids’ visits per capita being 71 percent greater than the national average in 2023, down from 79 percent in 2022.
Figure 4: Emergency Department Visits per 1,000 Population
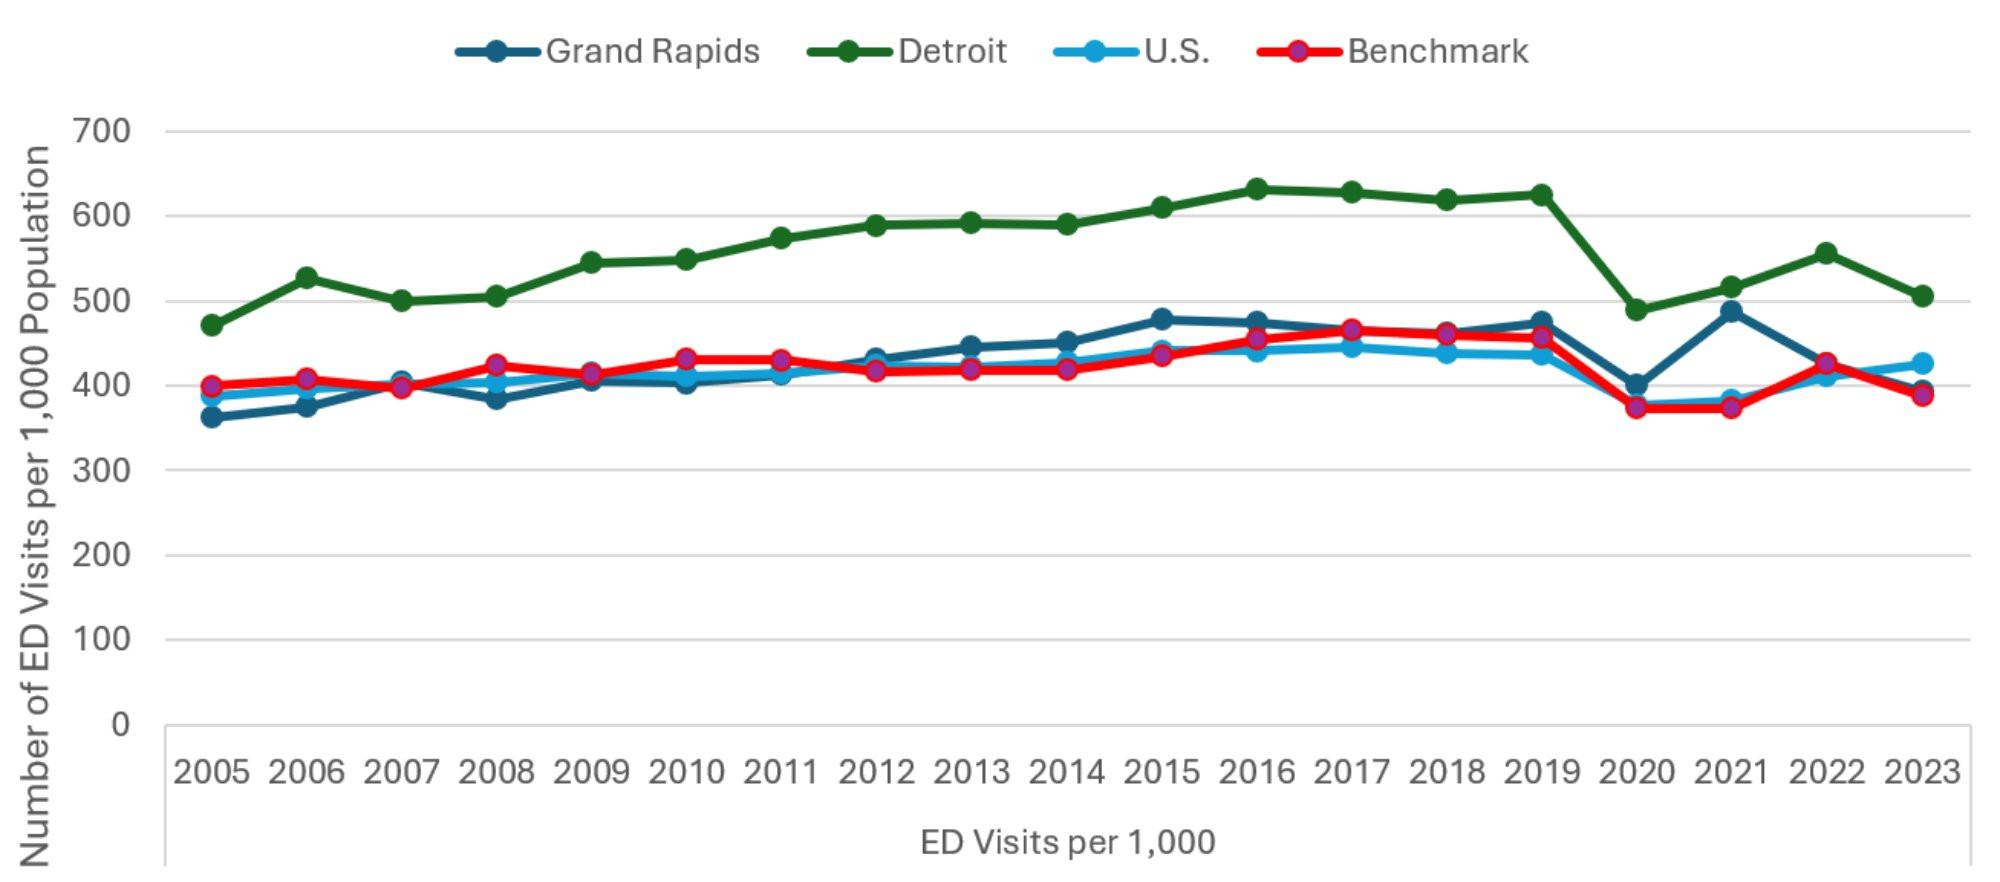
Description: The Emergency Department Visits per 1000 Population graph shows the total number of emergency department visits divided by total population, with one series each for Grand Rapids, Detroit, the entire US, and the benchmark communities (a mix of Buffalo NY, Rochester NY, Louisville KY, and Milwaukee WI) from 2005 to 2023. The series all show the same pattern, with Detroit being significantly above the others.
Source: American Hospital Association (2025).
Figure 4 examines an additional component of hospital utilization by plotting per capita emergency department (ED) visits for Grand Rapids and each of the comparison regions. After substantial absolute and relative fluctuations over the past three years, this utilization measure appears back on trend. Spiking ED use for Grand Rapids in 2021 had narrowed the utilization gap with Detroit to only five percent in 2021, which was far off the historical gap of 24 percent. The seven percent decline in ED utilization in Grand Rapids from 2022 to 2023 now has the gap up to 28 percent. This strengthens the suggestion that the earlier spike is not part of a long-term trend or convergence with the utilization levels found in Detroit, which has always been the highest among the comparison communities. For Michigan as a whole, the news is good with both communities enjoying declining ED utilization, even though the national average has increased.
Figure 5: Average Hospital Length of Stay
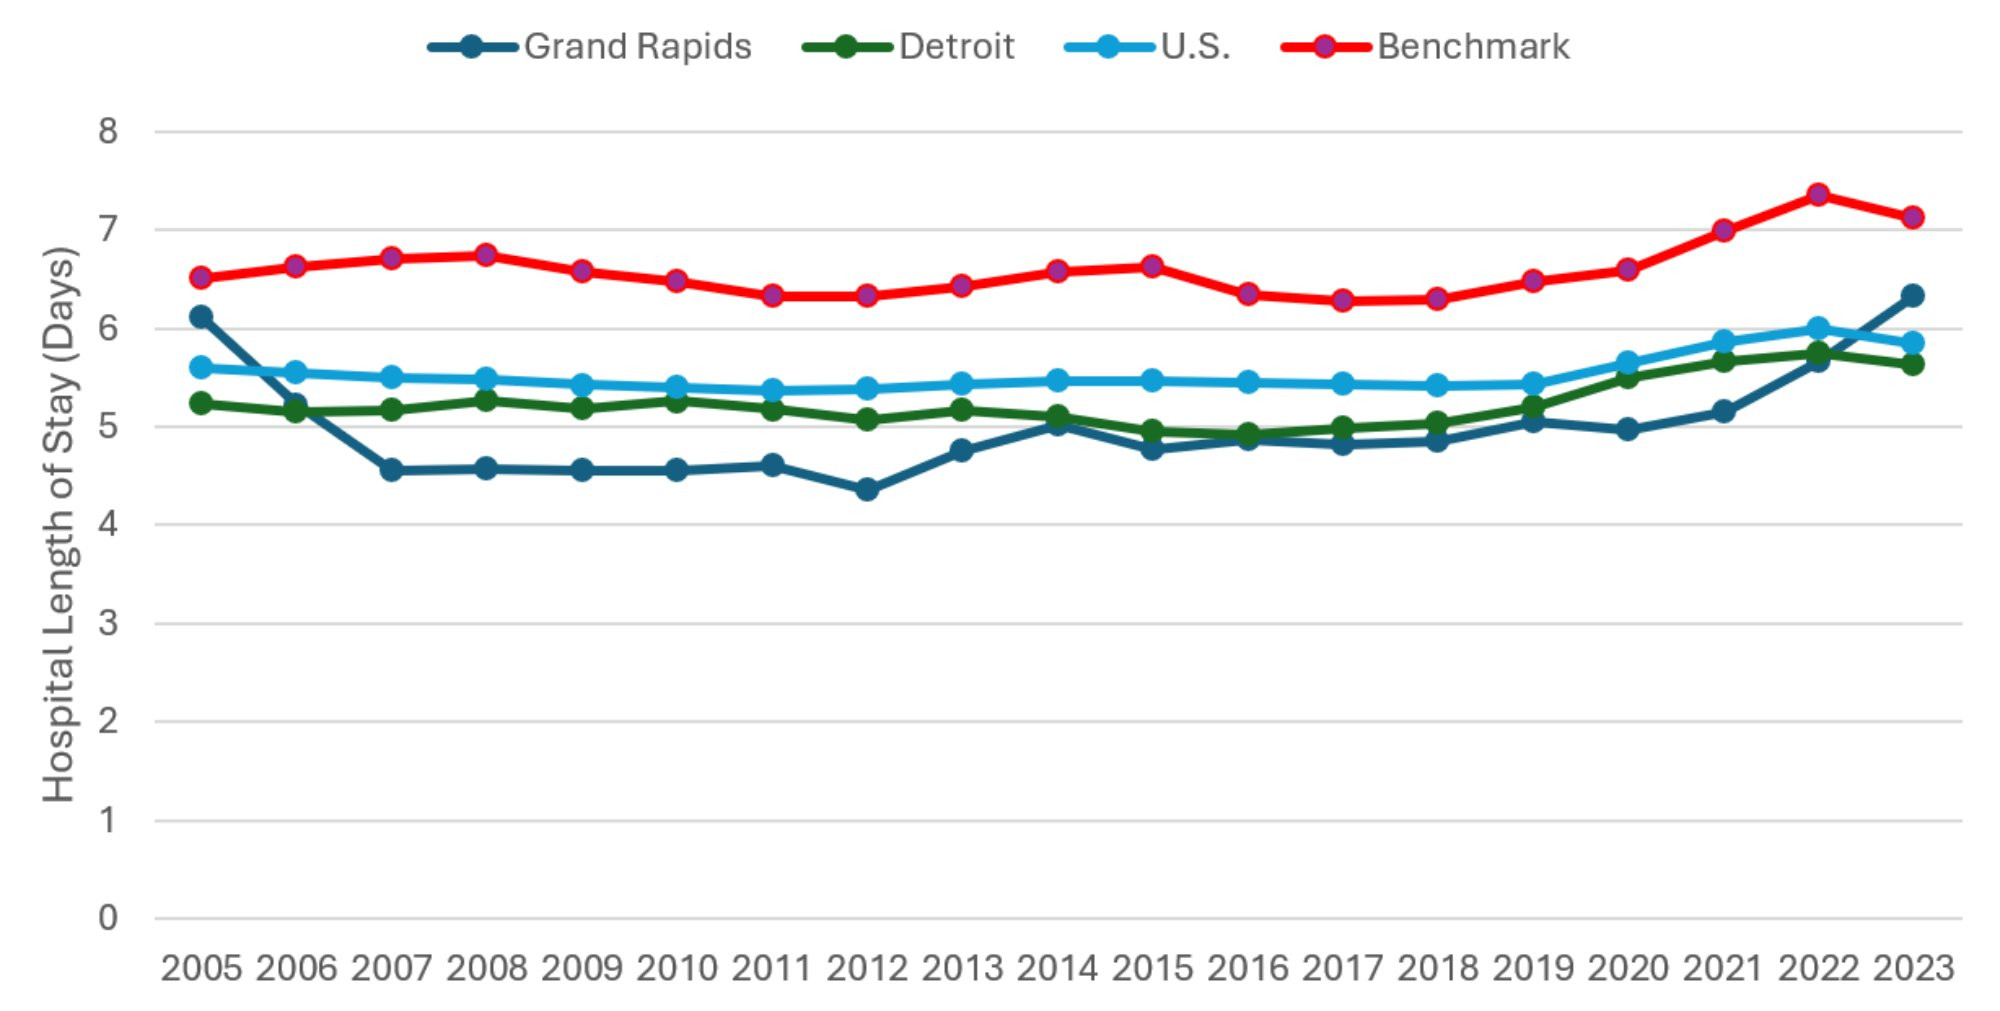
Description: The Average Length of Stay graph shows the total number of inpatient days divided by total admissions, with one series each for Grand Rapids, Detroit, the entire US, and the benchmark communities (a mix of Buffalo NY, Rochester NY, Louisville KY, and Milwaukee WI) from 2005 to 2023. The benchmark communities show consistently higher average lengths of stay. Hospital stays in Grand Rapids have lengthened rapidly in the past two years.
Source: American Hospital Association (2024).
Just as Figure 2 shows changes in hospitalization rates across all four hospital comparison communities, Figure 5 reveals changes in the average lengths of stay, conditional on admission. Most communities experienced slightly declining average lengths of stay between 2022 and 2023. Grand Rapids is a notable exception, experiencing a half-day (10 percent) increase. In one year, Grand Rapids has moved from lowest in average length of stay among the comparison communities to second highest. In previous reports, some of this has been attributed to Grand Rapids successfully less-severe patients in an outpatient setting, leaving inpatient care to the most serious cases with the greatest average length of stay. This does not appear to explain the latest increase, however, as Figure 3 shows outpatient utilization rates declining between 2022 and 2023. Patients are admitted to hospital at rates comparable to the previous year but then require extended services. This suggests either increased severity of the typical patient or changing hospital practices.
While these data do not reveal the exact reason for the steep rise in Grand Rapids’ average length of stay, other investigations suggest two contributing factors. The Medicare Part C participation rate for Grand Rapids (75 percent) is much higher than the national average (53 percent). This is significant because the incidence of delayed discharge to post-acute care is typically higher among Part C beneficiaries (McGarry et al., 2025), and this gap has grown significantly in recent years. In 2020, Part C beneficiaries were six percent more likely than Traditional Medicare beneficiaries to have a delayed discharge (American Hospital Association 2025). By 2023, the year for the latest data in this section, this gap had grown to 13.9 percent. The reasons for the greater delays involve private Medicare Part C plans being more likely to both expend effort steering beneficiaries to low-cost post-acute care, as well as demand pre-authorization and seek claim denials for post-acute care prior to discharge (American Hospital Association 2025). Exacerbating this problem is difficulty in staffing post-acute facilities. Nationwide, staffing at skilled nursing facilities declined more than other health care facilities both pre- and post-pandemic (Nguyen et al. 2023). Michigan, specifically, is expected to experience large shortages in nurses, nursing assistants, direct care workers, and personal care aides (White, 2023; Hornburg, 2024; and Wynder, 2025). Staffing difficulties limit the capacity for post-acute facilities to receive patients from hospital, adding to delays before discharge.
Figure 6: Hospital-based Personnel per 1,000 Population
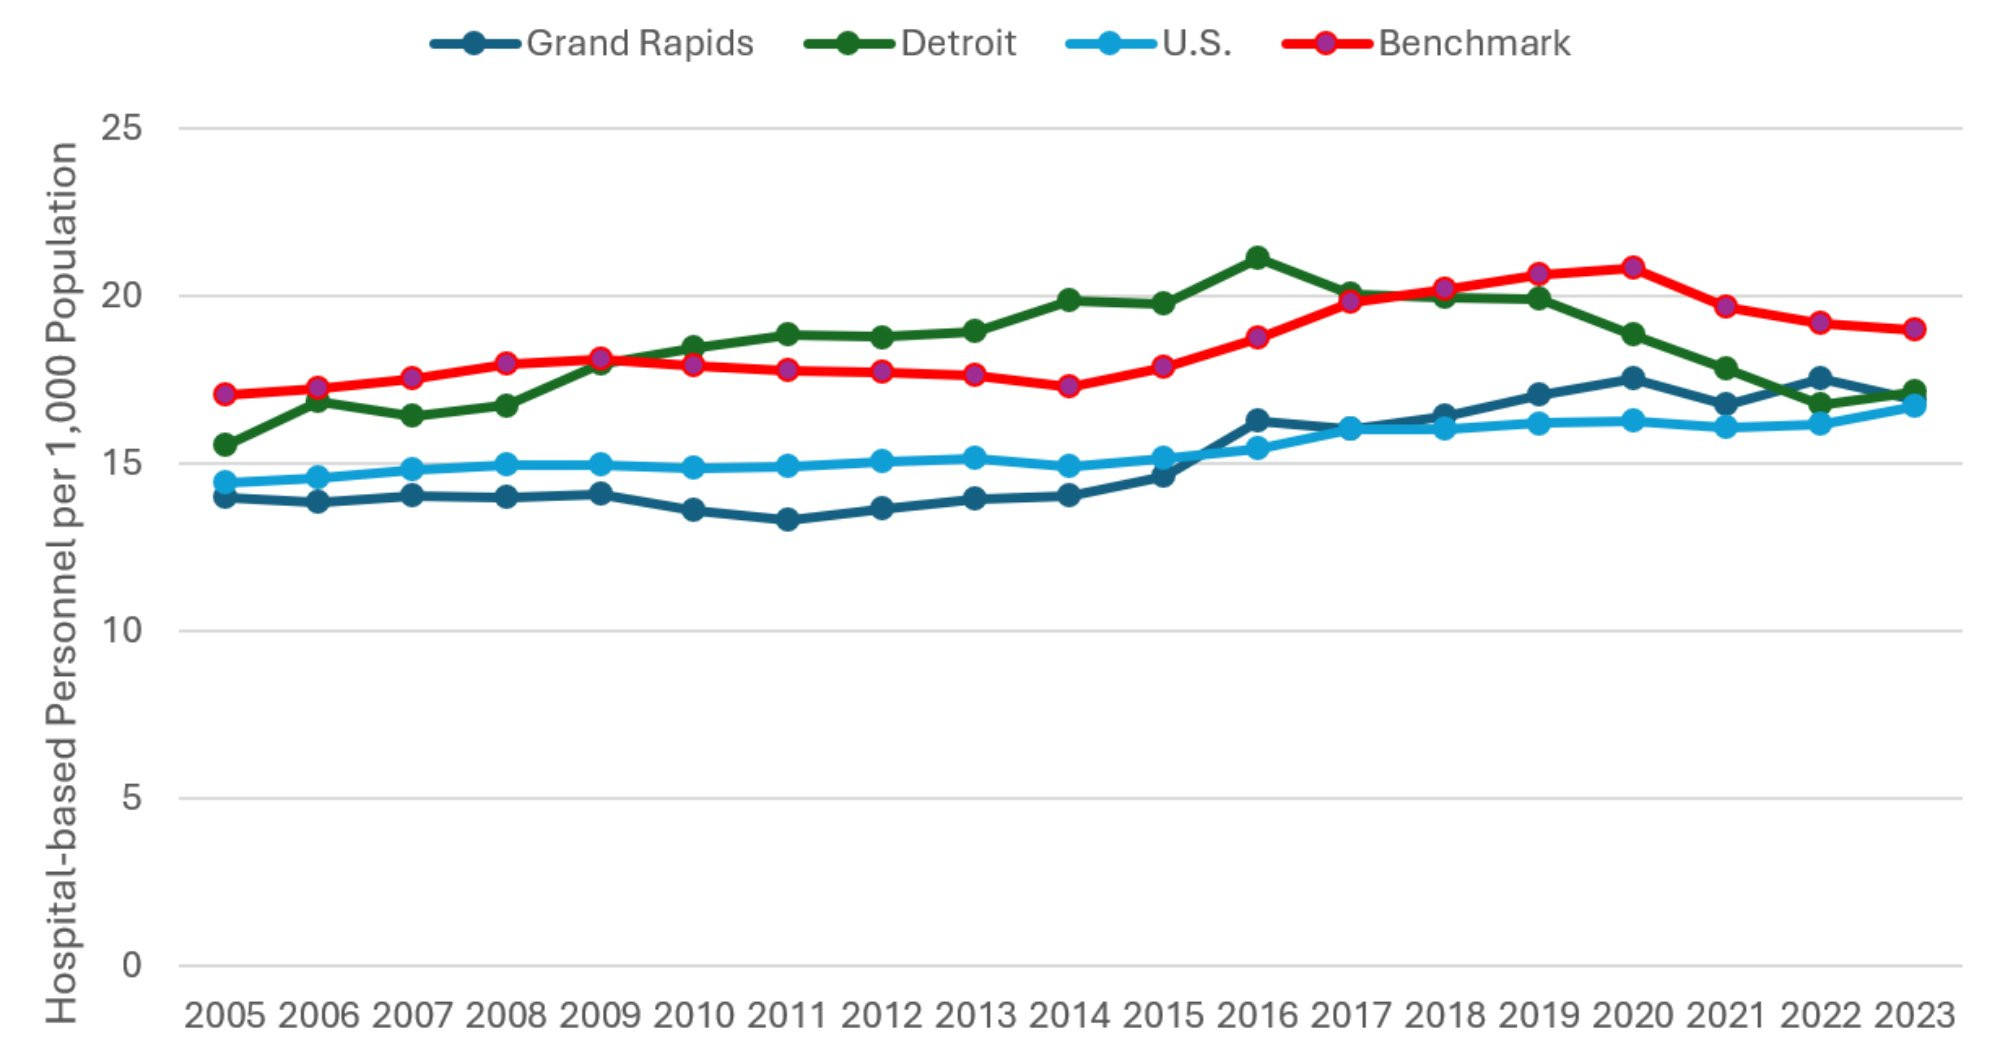
Description: The Hospital-based Personnel per 1000 Population graph shows the total number of hospital-based personnel divided by total population, with one series each for Grand Rapids, Detroit, the entire US, and the benchmark communities (a mix of Buffalo NY, Rochester NY, Louisville KY, and Milwaukee WI) from 2005 to 2023. All series rise gently at first, while there are some recent declines in Detroit and the benchmark communities.
Source: American Hospital Association (2025).
Finally, Figure 6 highlights the number of hospital-based personnel per 1,000 residents in each region. These personnel counts are based on the total number of full-time equivalent (FTE) hospital employees, excluding medical and dental residents, interns, and other trainees. For the first time since 2016, Detroit enjoyed a year-over-year increase (two percent) in personnel per capita between 2022 and 2023. Grand Rapids, on the other hand, has been steady for about four years leading up to this study. Therefore, as of 2023, Grand Rapids and Detroit have about the same hospital-based personnel per capita. This is a substantial change from even as recently as 2014, when Detroit’s personnel per capita was over 40 percent greater than that of Grand Rapids.
Hospital and Medical Expenditures
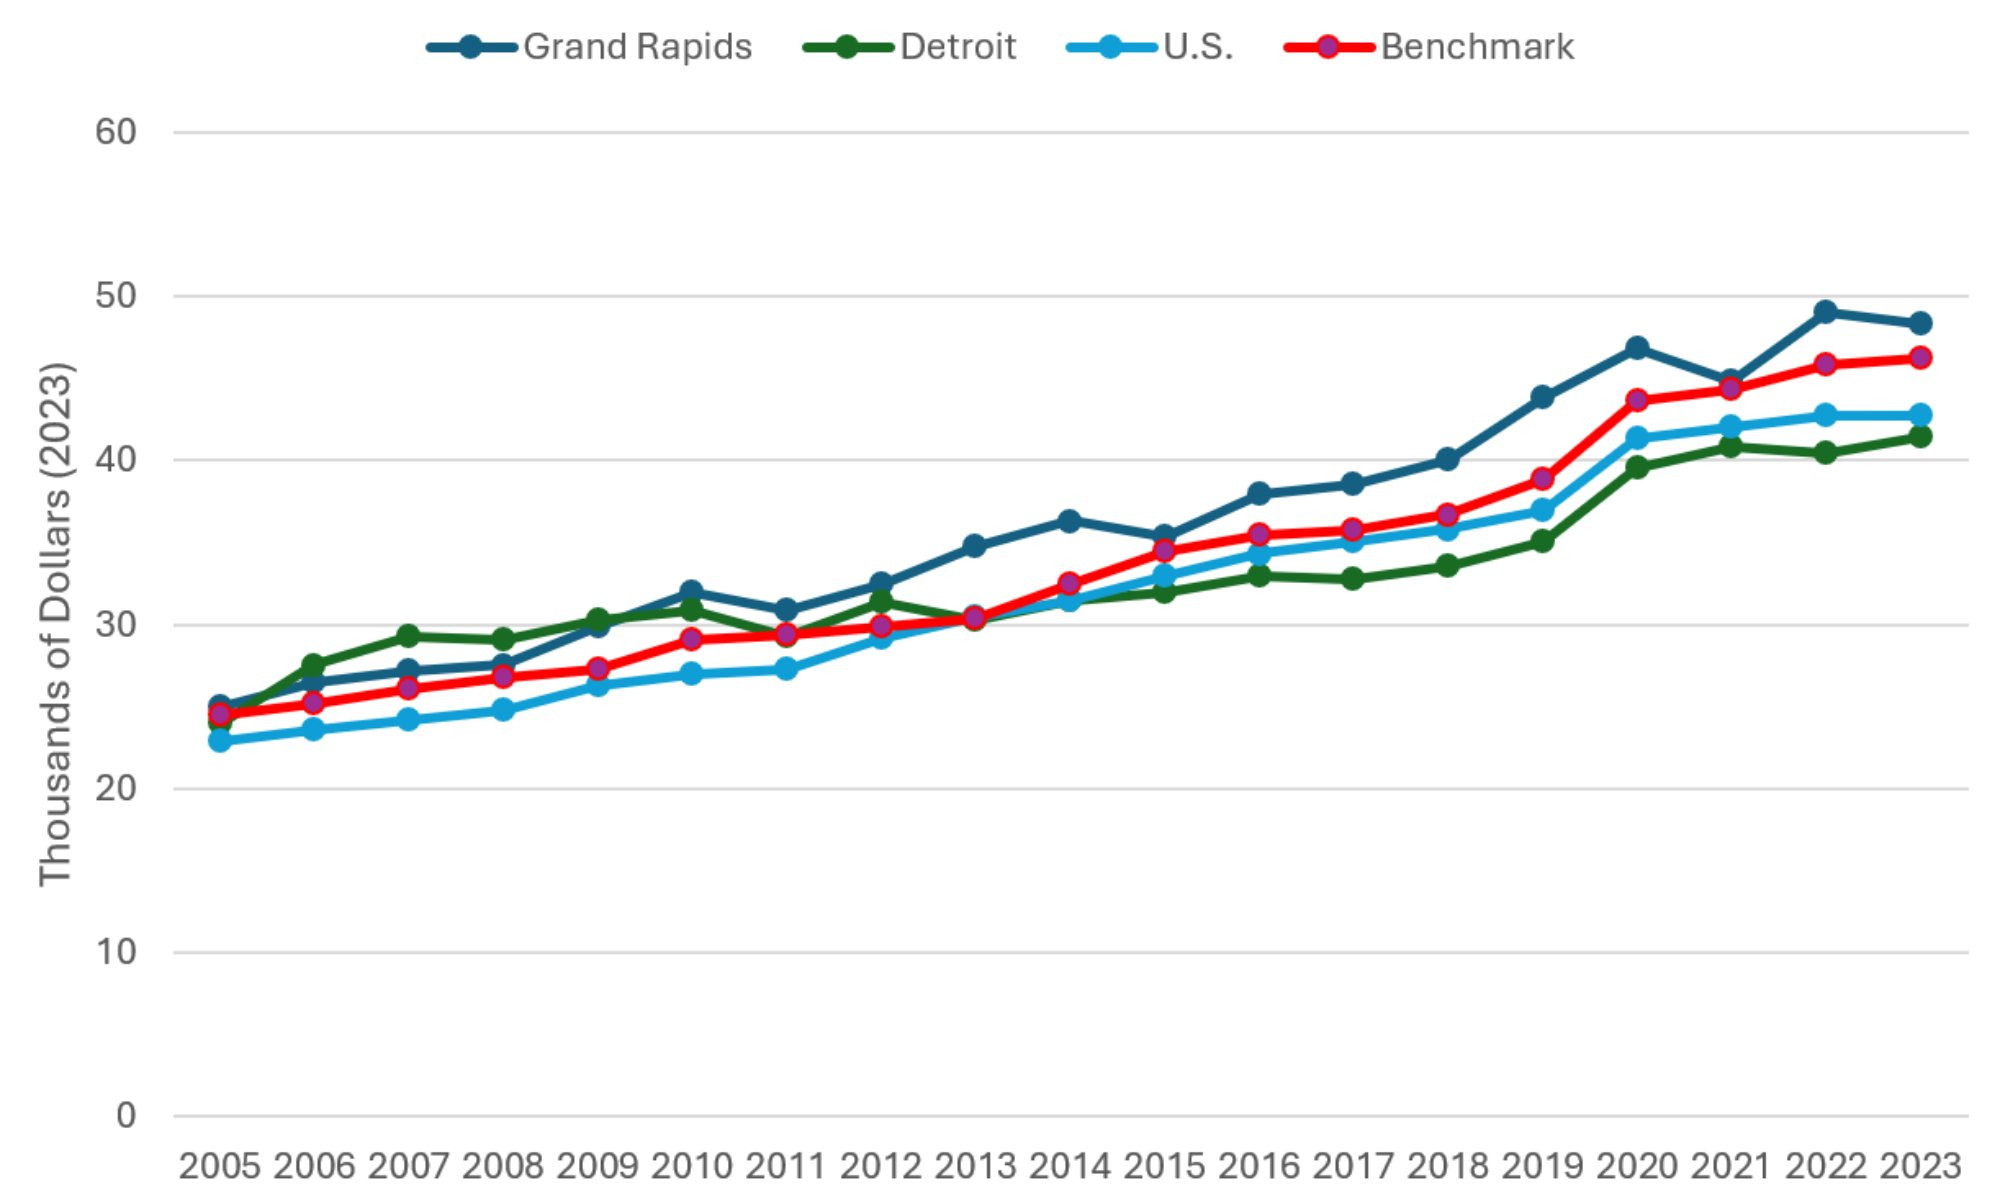
Figure 7 examines payroll and benefits expenses per hospital employee, which is inflation-adjusted to 2023 dollars using the consumer price index. Compensation per hospital employee declined across all comparison communities. Average compensation in Grand Rapids remains the lowest of the comparison communities, holding steady in 2023 at being 27 percent below that of Detroit and 16 percent below the national average. Across all comparison communities, the combination of steady personnel per capita and declining compensation per hospital employee suggests that burnout among health care workers due to the pandemic was substantially reduced by the end of 2023. These findings are relevant to the broad literature studying burnout among health care workers during the pandemic (Bradley and Chahar 2020, Sharifi et al. 2021, Jalili et al. 2021).
Figure 7: Average Payroll and Benefit Expenses per Hospital Employee
Description: The Average Payroll and Benefits per Hospital Employee graph shows the total hospital payroll and benefits expense divided by total hospital-based personnel, with one series each for Grand Rapids, Detroit, the entire US, and the benchmark communities (a mix of Buffalo NY, Rochester NY, Louisville KY, and Milwaukee WI) from 2005 to 2023. The series follow a gently increasing, more-or-less parallel pattern since 2017, with Grand Rapids lowest, then benchmark communities, then US average, and Detroit is the highest.
Source: American Hospital Association (2025).
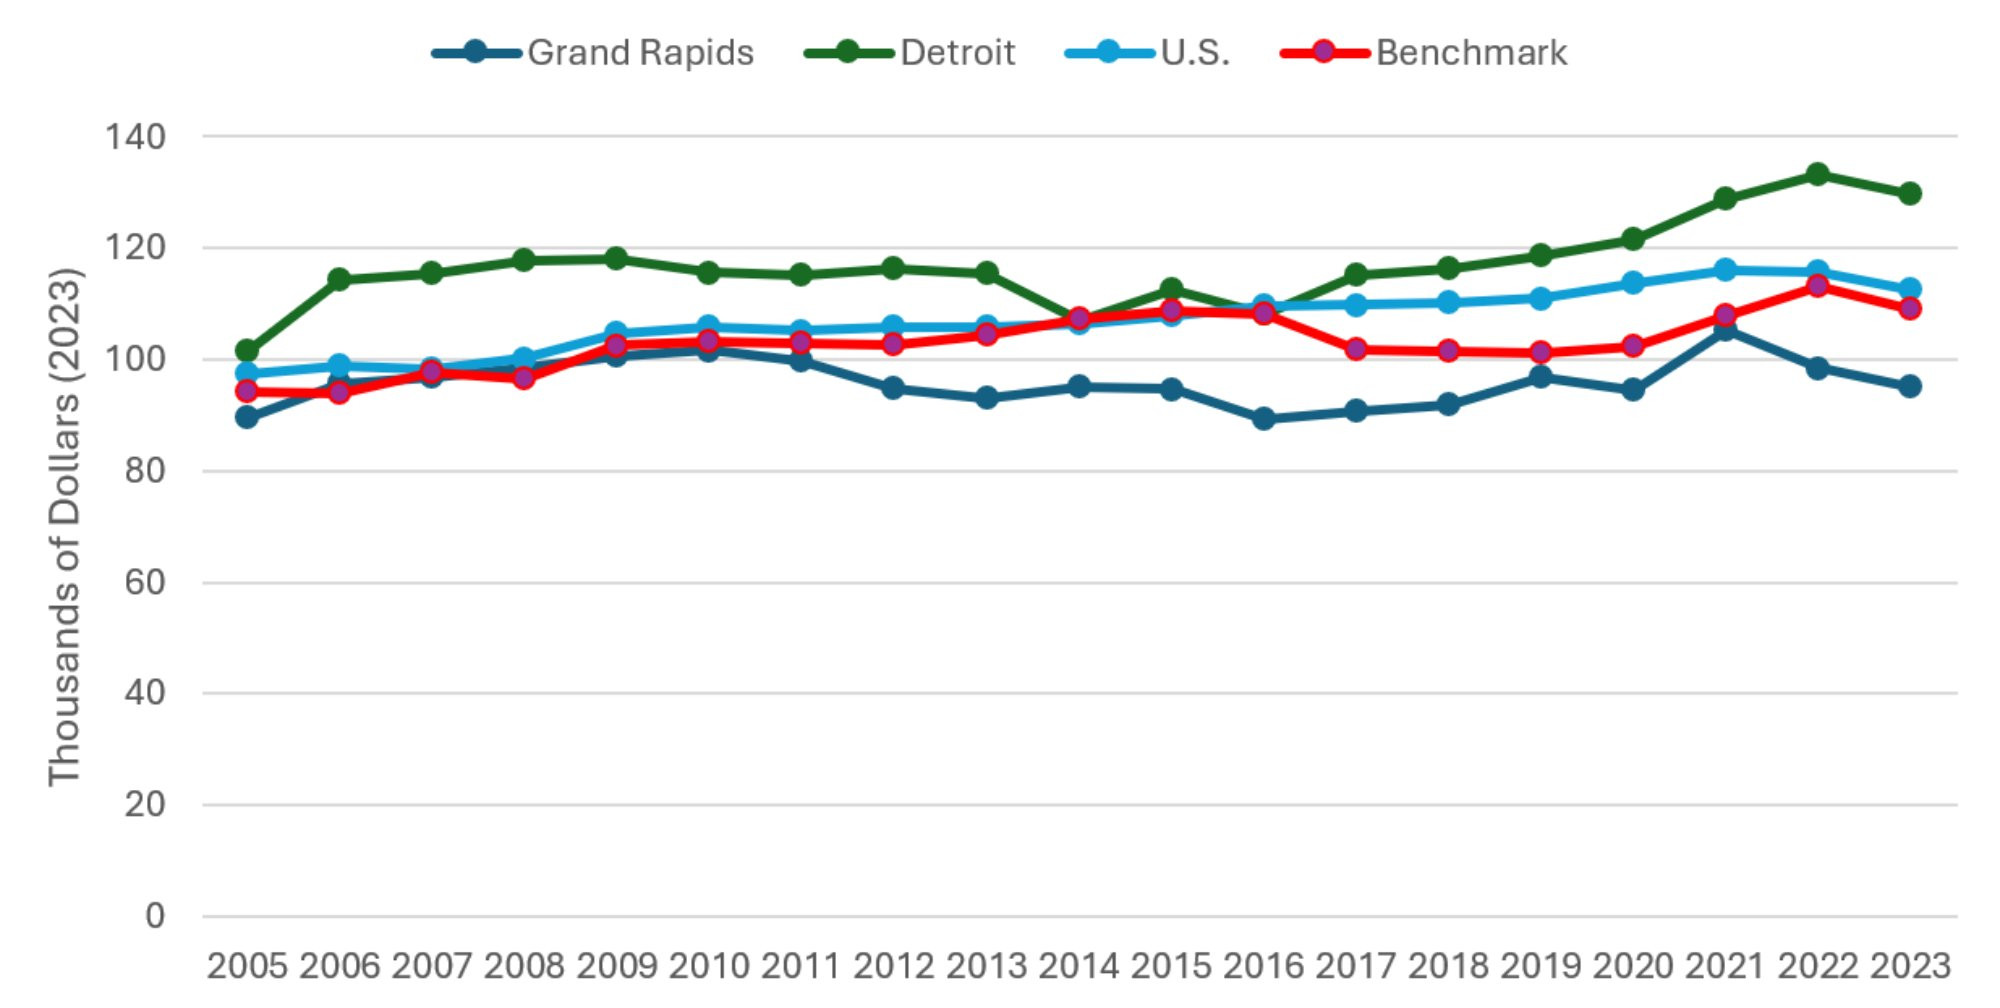
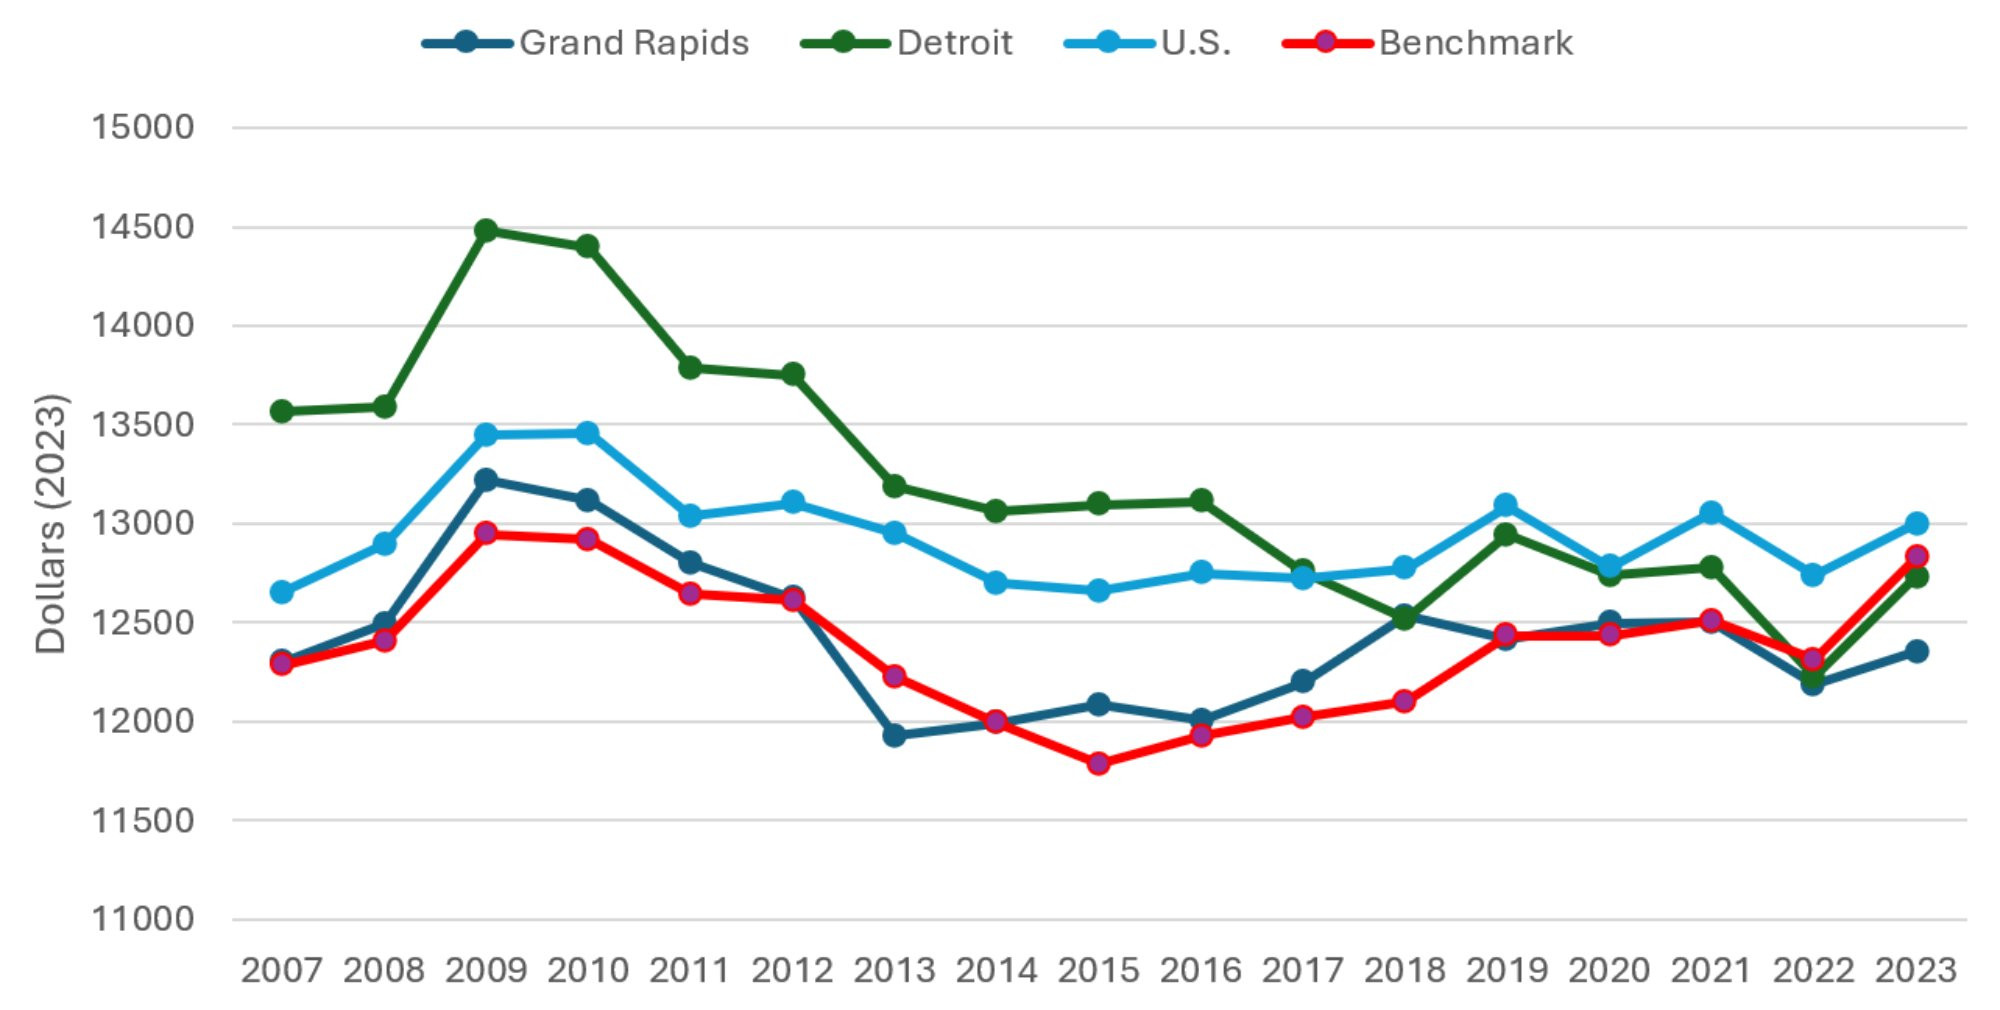
Figure 8 displays total inflation-adjusted hospital expenses per admission. It is important to recognize that Figure 8 measures the total expenses reported by the hospital, divided by the reported number of admissions. It does not reflect patient or insurer expenditures on hospital care. The most recent year of the study reveals a three-year leveling off of real expenses per admission. Only Grand Rapids experienced a decline in expenses, though it was modest at only one percent. Detroit experienced an increase slightly larger in magnitude at two percent. The 2022-2023 trend across all communities; the leveling off of hospital admission rates and hospital employees per capita, along with greater average length of stay and lower compensation per employee together suggests that higher spending from increased intensity of treatment for inpatients was at least partially offset by lower spending on compensation per hospital employee.
Figure 8: Total Hospital Expenses per Admission
Description: The Total Hospital Expenses per Admission graph shows total hospital expenses divided by the number of hospital admissions, with one series each for Grand Rapids, Detroit, the entire US, and the benchmark communities (a mix of Buffalo NY, Rochester NY, Louisville KY, and Milwaukee WI) from 2005 to 2023. The series follow an increasing, more-or-less parallel pattern since 2015, with Detroit lowest, then US average, then benchmark communities, and Grand Rapids is the highest.
Source: American Hospital Association (2025).
Figure 9 plots real per capita Medicare expenditures, combining both fee-for-service (FFS) and Medicare Advantage (MA) enrollees, from 2007 through 2023. These figures represent the average annual per capita government expenditure for a Medicare beneficiary in each of the comparison communities. Data on FFS Medicare enrollment and expenditures and MA enrollment were obtained through the Centers for Medicare and Medicaid Services (CMS) Geographic Variation Public Use File (Centers for Medicare and Medicaid Services, 2025). The FFS expenditures in have been adjusted for regional differences in prices, population age, gender, and race. Measures of MA expenditures were calculated using year-specific benchmark payment rates, which provide an approximate estimate of county-level MA spending. Due to the nature of the data used to construct Figure 9, geographic regions are defined as the primary county in the MSA (e.g. estimates for Grand Rapids are specific to Kent County). These figures include expenditures for physician and hospital care but exclude expenditures on prescription medications. Additionally, in cases where treatment was received in a county outside of where the patient resides, CMS assigns expenditures to the county in which the patient lived and not the county where the treatment was performed.
In most previous versions of this report, the FFS expenditures were also risk-adjusted according to Medicare’s Hierarchical Condition Categories (HHC) model. Unfortunately, beginning with the 2022 data, the Public Use File no longer reports risk-adjusted spending and so the actual risk-adjusted Medicare FFS spending in each county was unavailable to us. We did, however, know the non-risk-adjusted spending and the average risk score for each of these counties. Therefore, to produce the 2023 estimates, we used the 2019 data to model risk adjusted spending as a function of unadjusted spending, the inverse of the average county risk score, and an interaction term to produce a predicted risk-adjusted spending value. The model had an R-squared of 0.879, and so did a fairly good job of predicting the 2019 risk-adjusted spending. These predicted values are included in this year’s report, and the team will reevaluate this approach in the future.
Despite rising Medicare expenditures in Grand Rapids from 2016 to 2018, spending had leveled off and remained stable up to 2021. In all communities, a dip in real Medicare expenditures in 2022 was followed by a rebound in 2023. Most communities’ real Medicare expenditures are now at approximately the same level as that of 2018 to 2021. The lone exception is for the benchmark communities, where spending in 2023 was about 2.5 percent above 2021 levels.
In conclusion, across the comparison communities studied in this report, many health care capacity, utilization, and spending variables remained relatively steady between 2022 and 2023. One positive development is that COVID-related burnout among hospital employees seems down by 2023 across the country. For Grand Rapids, on the other hand, the most concerning recent development is the accelerated growth in the average length of stay in hospital among inpatients. It increased by 27 percent from 2020 to 2023, compared to growth of only three percent in the national average and two percent in Detroit. The growth in Grand Rapids over this period was more than double that of even the highest from among the benchmark communities. While earlier increases could be explained as Grand Rapids being successful in keeping the relatively less severe cases out of the hospital, this argument is less persuasive more recently. While declining spending per hospital employee may have mitigated the impact of this on total hospital expenses per admission in 2023, this has not typically been the case in previous years, and so high and growing average length of stay could cause greater strain on hospital budgets in the future.
Figure 9: Adjusted Medicare Expenditures per Medicare Enrollee
Description: The Adjusted Medicare Expenditures per Medicare Enrollee graph shows risk-adjusted Medicare expenditure divided by the number of Medicare Enrollees (Parts A, B, and C), with one series each for Grand Rapids, Detroit, the entire US, and the benchmark communities (a mix of Buffalo NY, Rochester NY, Louisville KY, and Milwaukee WI) from 2005 to 2023. The series have generally been declining since 2009, but have leveled off since 2018 and are all fairly close in magnitude.
Source: Medicare Advantage Ratebook (2023) and Medicare Geographic Variation Public Use File (2023).
Notes
[1] To be consistent with previous reports we use the core-based statistical area for Grand Rapids. The Detroit region is defined using the smaller metropolitan division categorization. All other regions are defined using the MSA.
References
American Hospital Association (AHA). (2025a). AHA hospital statistics 2025 edition. Health Forum LLC, an affiliate of the American Hospital Association, Washington, D.C.
American Hospital Association (AHA). (2025b). “The cost of caring: Challenges facing America’s hospitals in 2025.” American Hospital Association. https://www.aha.org/costsofcaring.
Bradley, Meredith, and Praveen Chahar. “Burnout of health care providers during COVID-19.” Cleveland Clinic journal of medicine (2020).
Centers for Disease Control and Prevention. 2022. COVID-19 Data Tracker. Accessed on September 30, 2022. https://covid.cdc.gov/covid-data-tracker/#datatracker-home.
Centers for Medicare & Medicaid Services. (2025). Geographic Variation Public Use File. Retrieved October 16, 2025, https://data.cms.gov/summary-statistics-on-use-and-payments/medicare-geographic-comparisons/medicare-geographic-variation-by-national-state-county
Hornburg, Ana. (2024). “Michigan faces a major looming shortage of home health aides, nurses, and most other health care occupations.” Michigan Health Council. Retrieved December 4, 2025, from https://www.mhc.org/post/michigan-faces-a-major-looming-shortage-of-home-health-aides-nurses-and-most-other-health-care-occ.
Jalili, Mohammad, Mahtab Niroomand, Fahimeh Hadavand, Kataun Zeinali, and Akbar Fotouhi. “Burnout among health care professionals during COVID-19 pandemic: a cross- sectional study.” International archives of occupational and environmental health 94, no. 6 (2021): 1345-1352.
McGarry, Brian E., Andrew D. Wilcock, Ashvin D. Gandhi, David C. Grabowski, and Michael L. Barnett. “Extended Hospital Stays in Medicare Advantage and Traditional Medicare”. JAMA Internal Medicine 185, no. 11 (2025): 1362 – 1369.
Nguyen, T., Whaley, C., Simon, K. I., and Cantor, J. (2023). Changes in employment in the US health care workforce, 2016–2022. JAMA 330, no. 20 (2023): 2018–2020.
Sharifi, Mehrdad, Ali Akbar Asadi-Pooya, and Razieh Sadat Mousavi-Roknabadi. “Burnout among health care providers of COVID-19; a systematic review of epidemiology and recommendations.” Archives of Academic Emergency Medicine 9, no. 1 (2021).
Wharton Research Data Services. (2025) American Hospital Association Annual Survey History (1994 – Latest Year). Retrieved October 3, 2025.
https://wrds-www.wharton.upenn.edu/pages/about/data-vendors/american-hospital-association/.
White, Rose. (2023, November) “Can ads help a Michigan nursing home fix a staffing crisis?” MLive. Retrieved December 4, 2025, from https://www.mlive.com/public-interest/2023/11/can-ads-help-a-michigan-nursing-home-fix-a-staffing-crisis.html.
Wynder, Ehren. (2025, February) “Nonprofits tackle Michigan’s growing need for senior health care workers.” MLive. Retrieved December 4, 2025, from https://www.mlive.com/news/grand-rapids/2025/02/nonprofits-tackle-michigans-growing-need-for-senior-health-care-workers.html.

Daniel Montanera, Ph.D., Associate Professor, Department of Economics