Medical Innovation
By Gerry Simons, Ph.D., Professor, Department of Economics, Seidman College of Business, Grand Valley State University
Medical Innovation
Medical innovations contribute to economic growth and improve the human condition. However, measuring innovations generated in a specific geographic area is challenging. One way to do so is to examine the locational aspects of medical patents. Another is to quantify the amount of spending undertaken on medical research.
Patents
A patent is the property right granted to an inventor or assignee for a new or improved product, process, or piece of equipment. Patents are used as indicators of economic growth because of the investment that goes into creating the innovations and the investment opportunities that result from these innovations.
There are drawbacks to relying on patent data to measure innovative activity. Some inventors and assignees choose not to register patents for their innovations because doing so will require them to divulge details to competitors. Additionally, not all patents have a substantial impact on economic progress. Overall, patents are seen as reflecting significant contributions to society and the economy in general. The use of patents is particularly relevant in the medical field due to the large amount of spending for medical research and research and development (R&D) of innovative products.
The database of the U.S. Patent and Trademark Office (USPTO) indicates the name and location of both a patent’s inventor and its assignee (owner). In some cases, the inventor owns the patent. In corporate settings, the business itself is usually the assignee while an individual researcher (or group of researchers) is the inventor. This differentiation can then result in location differences. For example, the inventor lives in Kent County, but the company that owns the patent is in China. Another example may be the inventor lives in Germany and the assignee is a company in West Michigan. To evaluate the economic significance of innovative activities, considering inventors and assignees separately is useful.
It should be noted that the USPTO unveiled a new database search tool in September 2022. Because of substantial improvements in the robustness of the search engine, the data and graphs shown here should not be compared directly with those from Health Check editions prior to 2023.
Figure 1 shows the number of new medical patents granted by the USPTO to inventors residing in Kent County and, separately, patents with assignees in Kent County from the year 1990 through 2023.
Figure 1: Medical Patenting in Kent County, 1990–2023
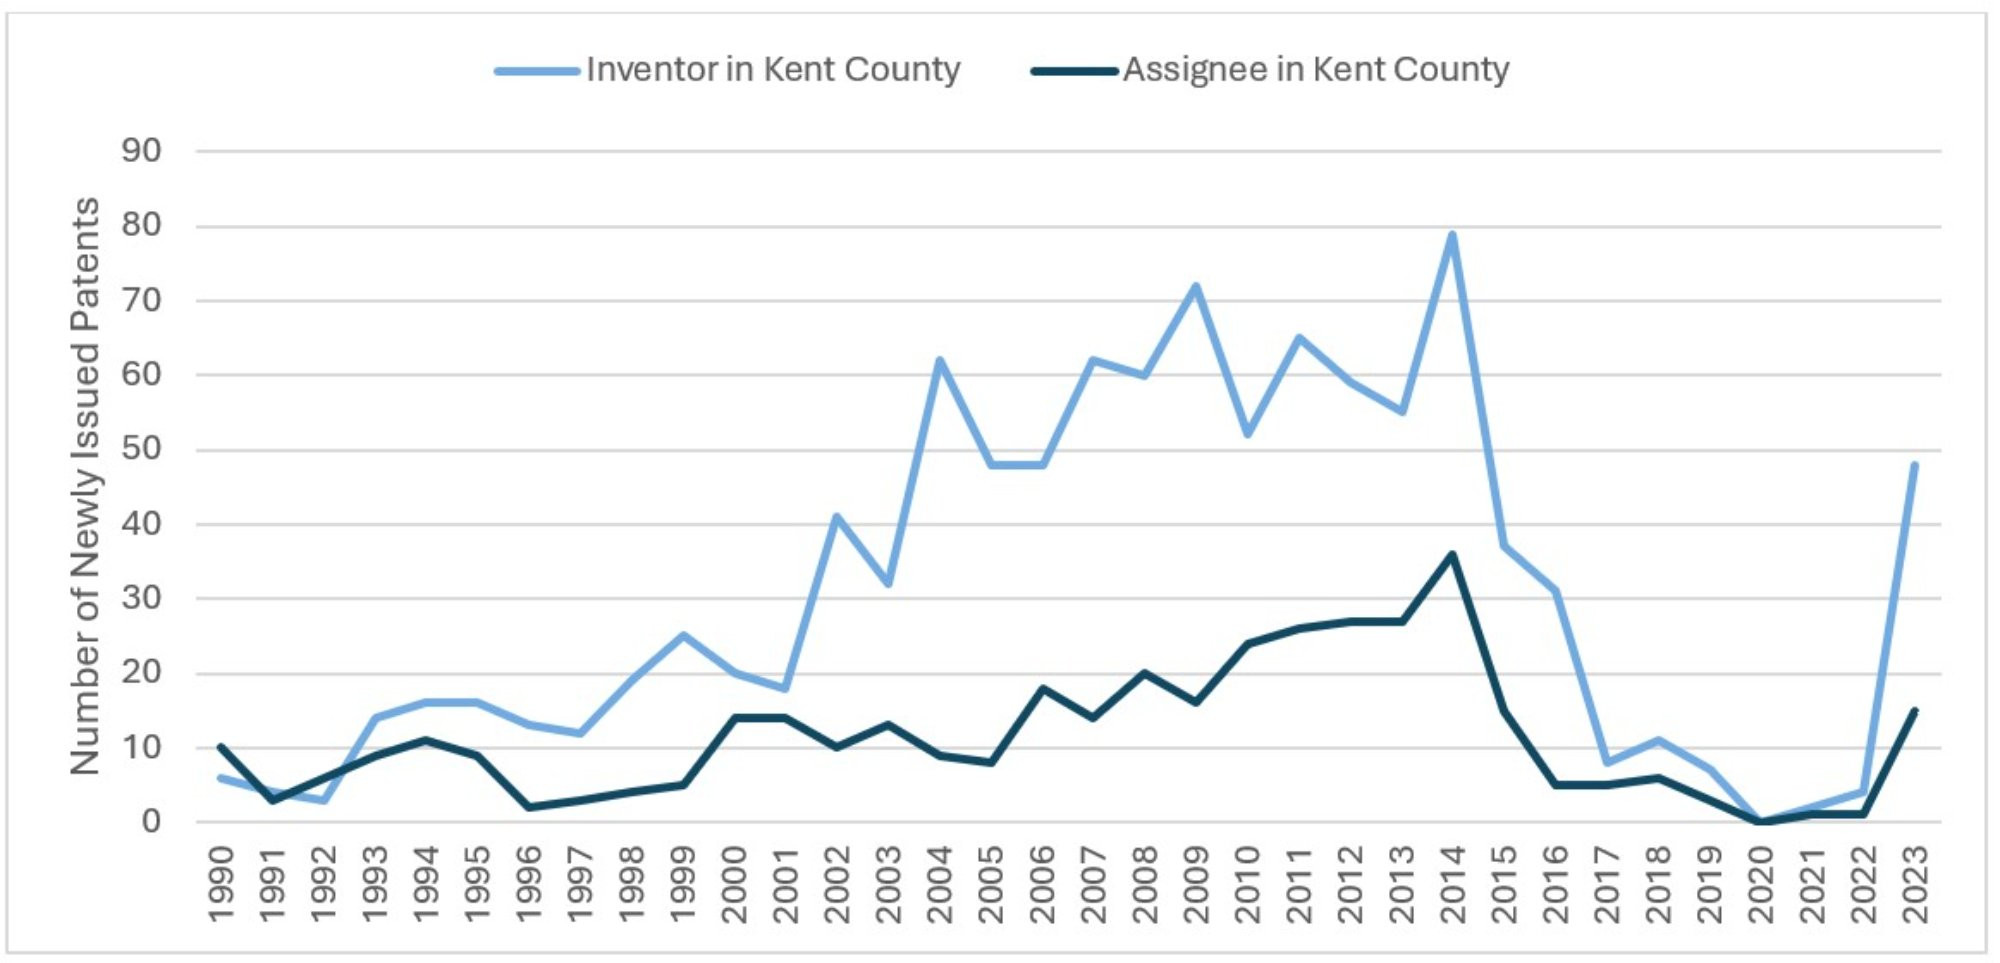
Description: The medical patenting in Kent County graph shows that the number of newly issued medical patents with an assignee or with an inventor in Kent County decreased sharply after 2014 with a partial rebound in 2023.
Source: United States Patent and Trademark Office, www.uspto.gov
For those with inventors living in Kent County, the average annual number of patents increased from 12.8 in the years 1990-1999 to 46.3 in the years 2000-2009, with a decreased average of 32.7 in the years 2010-2023. For those with assignees in Kent County, the average annual number of patents increased from 6.2 in the years 1990- 1999 to 13.6 in the years 2000-2009 and remained at 13.6 patents in the years 2010-2023. Growth in medical patents owned by entities in Kent County or invented by innovators in Kent County is an indicator of economic progress, as new discoveries and improvements can result in technological advancements. Over time, such innovations could encourage greater investment and lead to additional job opportunities in the regional economy.
Figure 1 clearly shows that following the sharp decline in patenting a decade ago there has been a significant increase in patenting since 2022, with the annual number of new patents from inventors living in Kent County jumping from four in 2022 to 48 in 2023, and the annual number of new patents with assignees located in Kent County growing from one to 15 over the same period.
To determine if this recent change in medical patenting is specific to Kent County, we compared Figure 1 with Figure 2, which shows the parallel data for the State of Michigan as a whole. The two figures have similar patterns, with generally upward trends followed by stark declines after 2014 and sharp increases in 2023. Furthermore, rather than a regional aberration, the decline in medical patenting appears to be a national phenomenon, as can be seen in Table 1, which displays the percentage change in the annual number of new medical patents for Kent County, Michigan, and the entire U.S., from 2014 through 2023.
Figure 2. Medical Patenting in Michigan, 1990-2023
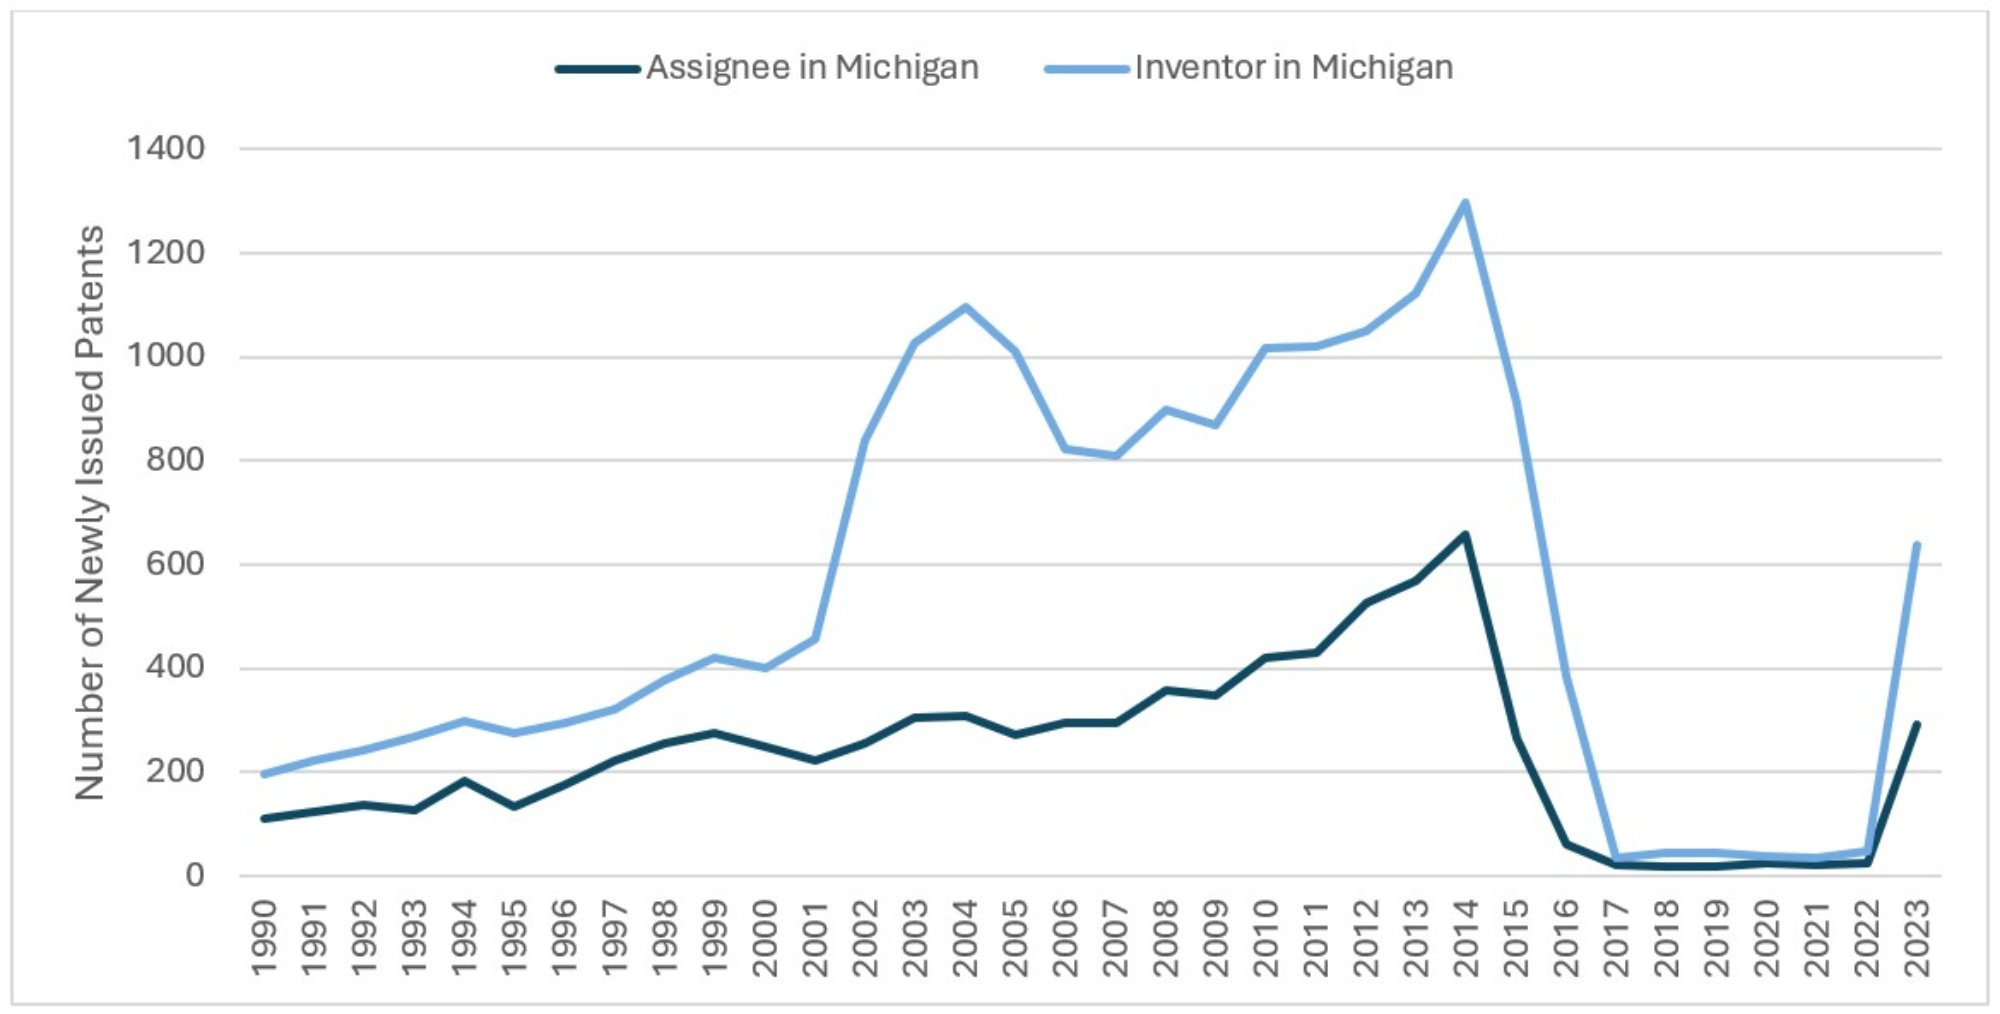
Description: The medical patenting in Michigan graph shows that the number of newly issued medical patents with an assignee or with an inventor in Michigan decreased sharply after 2014 with a partial rebound in 2023.
Source: United States Patent and Trademark Office, www.uspto.gov
Table 1: Percentage Change in Newly Issued Medical Patents by Location of Inventor and Assignee, 2014–2023
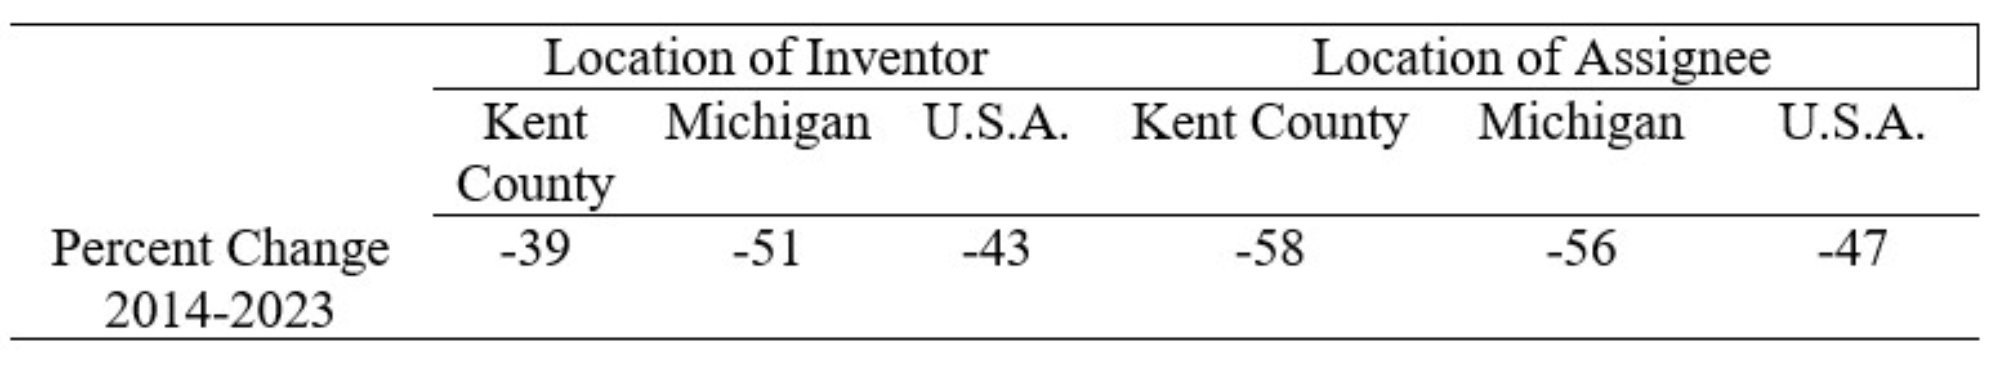
Description: The medical patenting by location table shows that between 2014 and 2023, the number of newly issued medical patents has declined by double-digits when looking at the location of the inventor or assignee for Kent County, for Michigan, and for the U.S.A. as a whole.
Source: United States Patent and Trademark Office, www.uspto.gov
A patent obtained through the USPTO only gives property right protection in the U.S. While this protection is sufficient for some inventors and assignees, others choose to apply for patents in other countries to receive property rights elsewhere. One way to do this is through the World Intellectual Property Organization (WIPO). Filing an international patent application with the WIPO allows an inventor to then pursue patent rights in up to 193 countries simultaneously.
The number of nonduplicate medical patent applications filed by West Michigan companies at the WIPO and at the USPTO from 2019 through 2023 is shown in Figure 3. Since 2019, the 11 West Michigan companies shown in Figure 3 have been granted 76 medical patents. However, 51 percent of these filings come from only three companies.
Figure 3: Medical Patent Applications in West Michigan, KOMA Region*
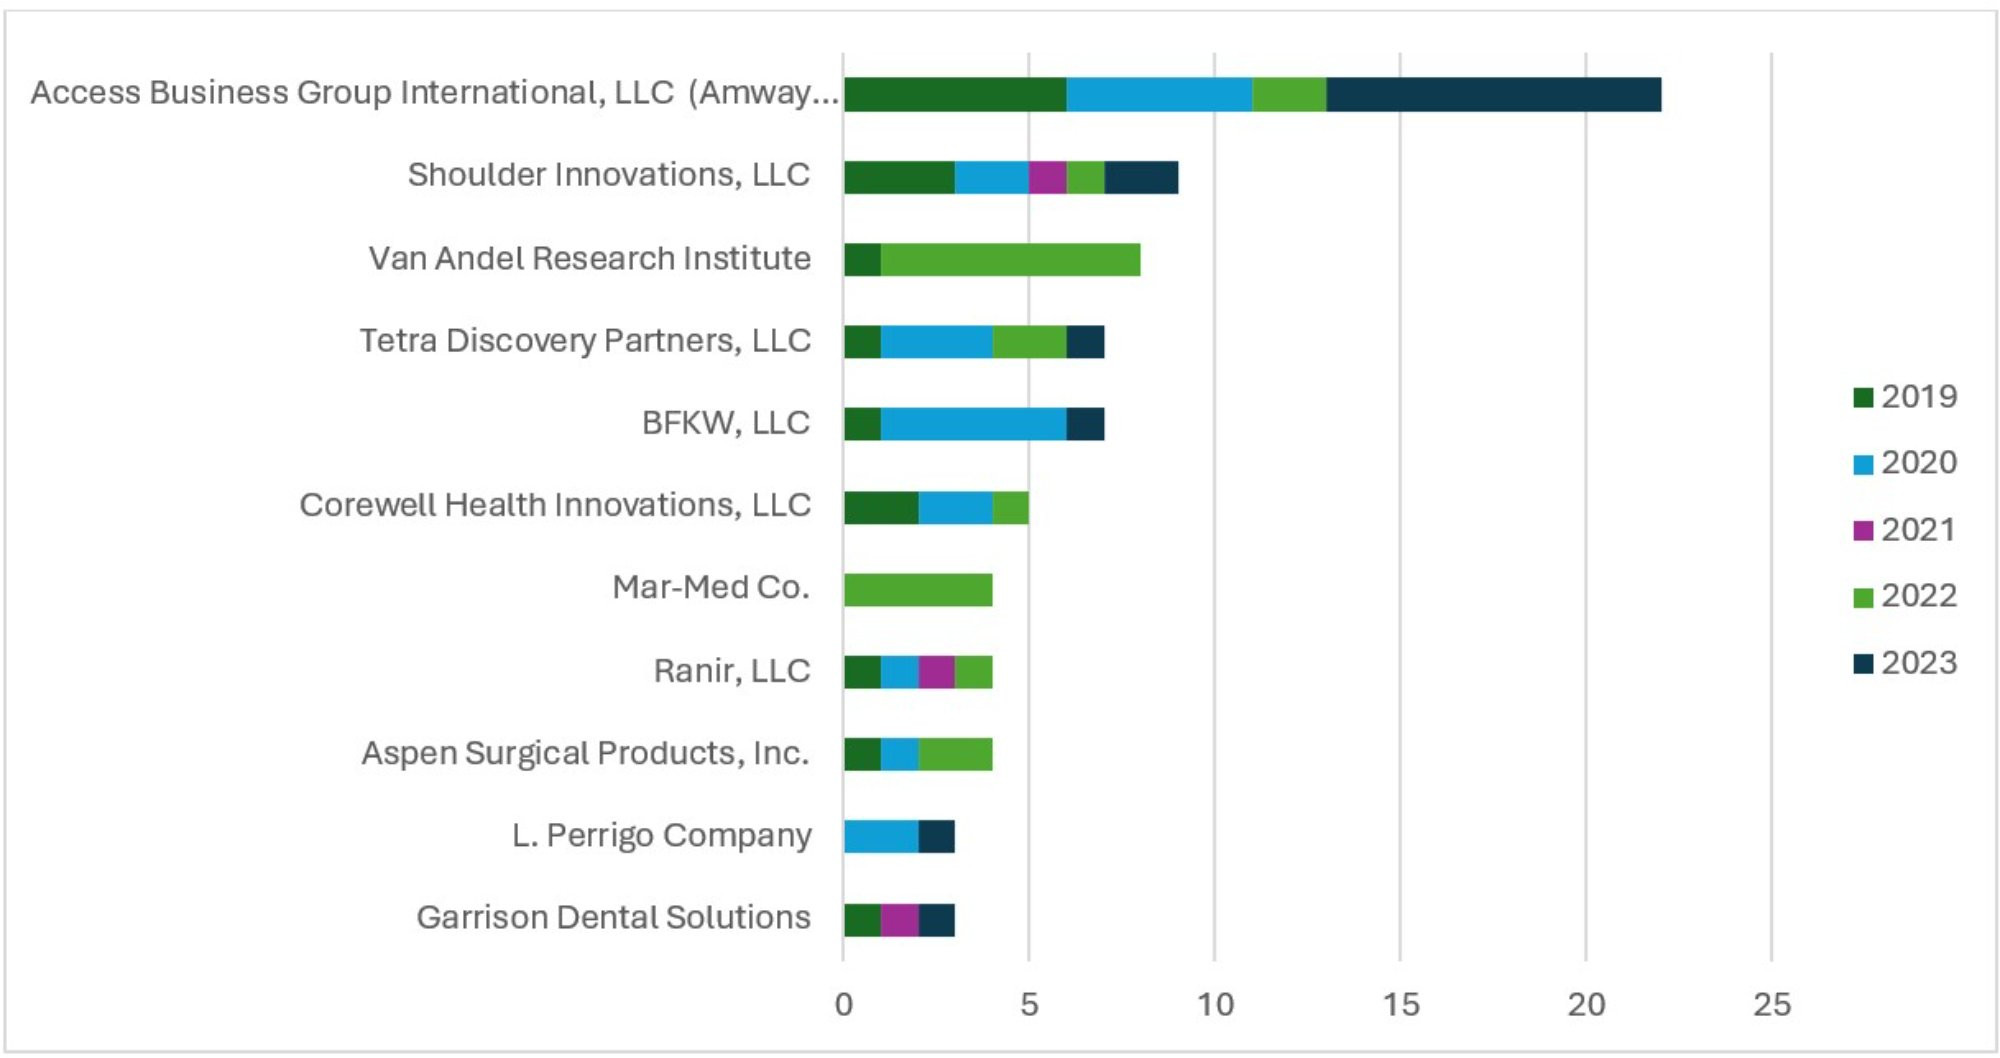
Description: The patent applications graph shows that the majority of non-duplicate medical patents applications from West Michigan companies in the past five years has come from only three companies.
Sources: United States Patent and Trademark Office and World Intellectual Property Organization, www.uspto.gov and www.wipo.int
The COVID-19 pandemic and resulting recession likely played a part in the decline in medical patenting in West Michigan from 2019-2022. What could have caused the relatively modest volume of medical patenting in West Michigan after 2014 and the sudden increase after 2022? The patenting process involves time delays between application and approval. Increases in processing time could possibly explain the recent declines in approved medical patents. Data on patent wait times (“pendency”) is not available for medical patents specifically but is available for USPTO patent applications as a whole.
Figure 4 shows the average wait times for the first action made by the USPTO on patent applications and for the entire “start to finish” time, from 2000 through 2023. Rather than increasing in recent years, the average wait time has been generally decreasing since 2010 through 2020, with a modest increase after that, though it is possible that this pattern does not hold for medical patents.
Figure 4: USPTO Patent Wait Times*, 2000–2023
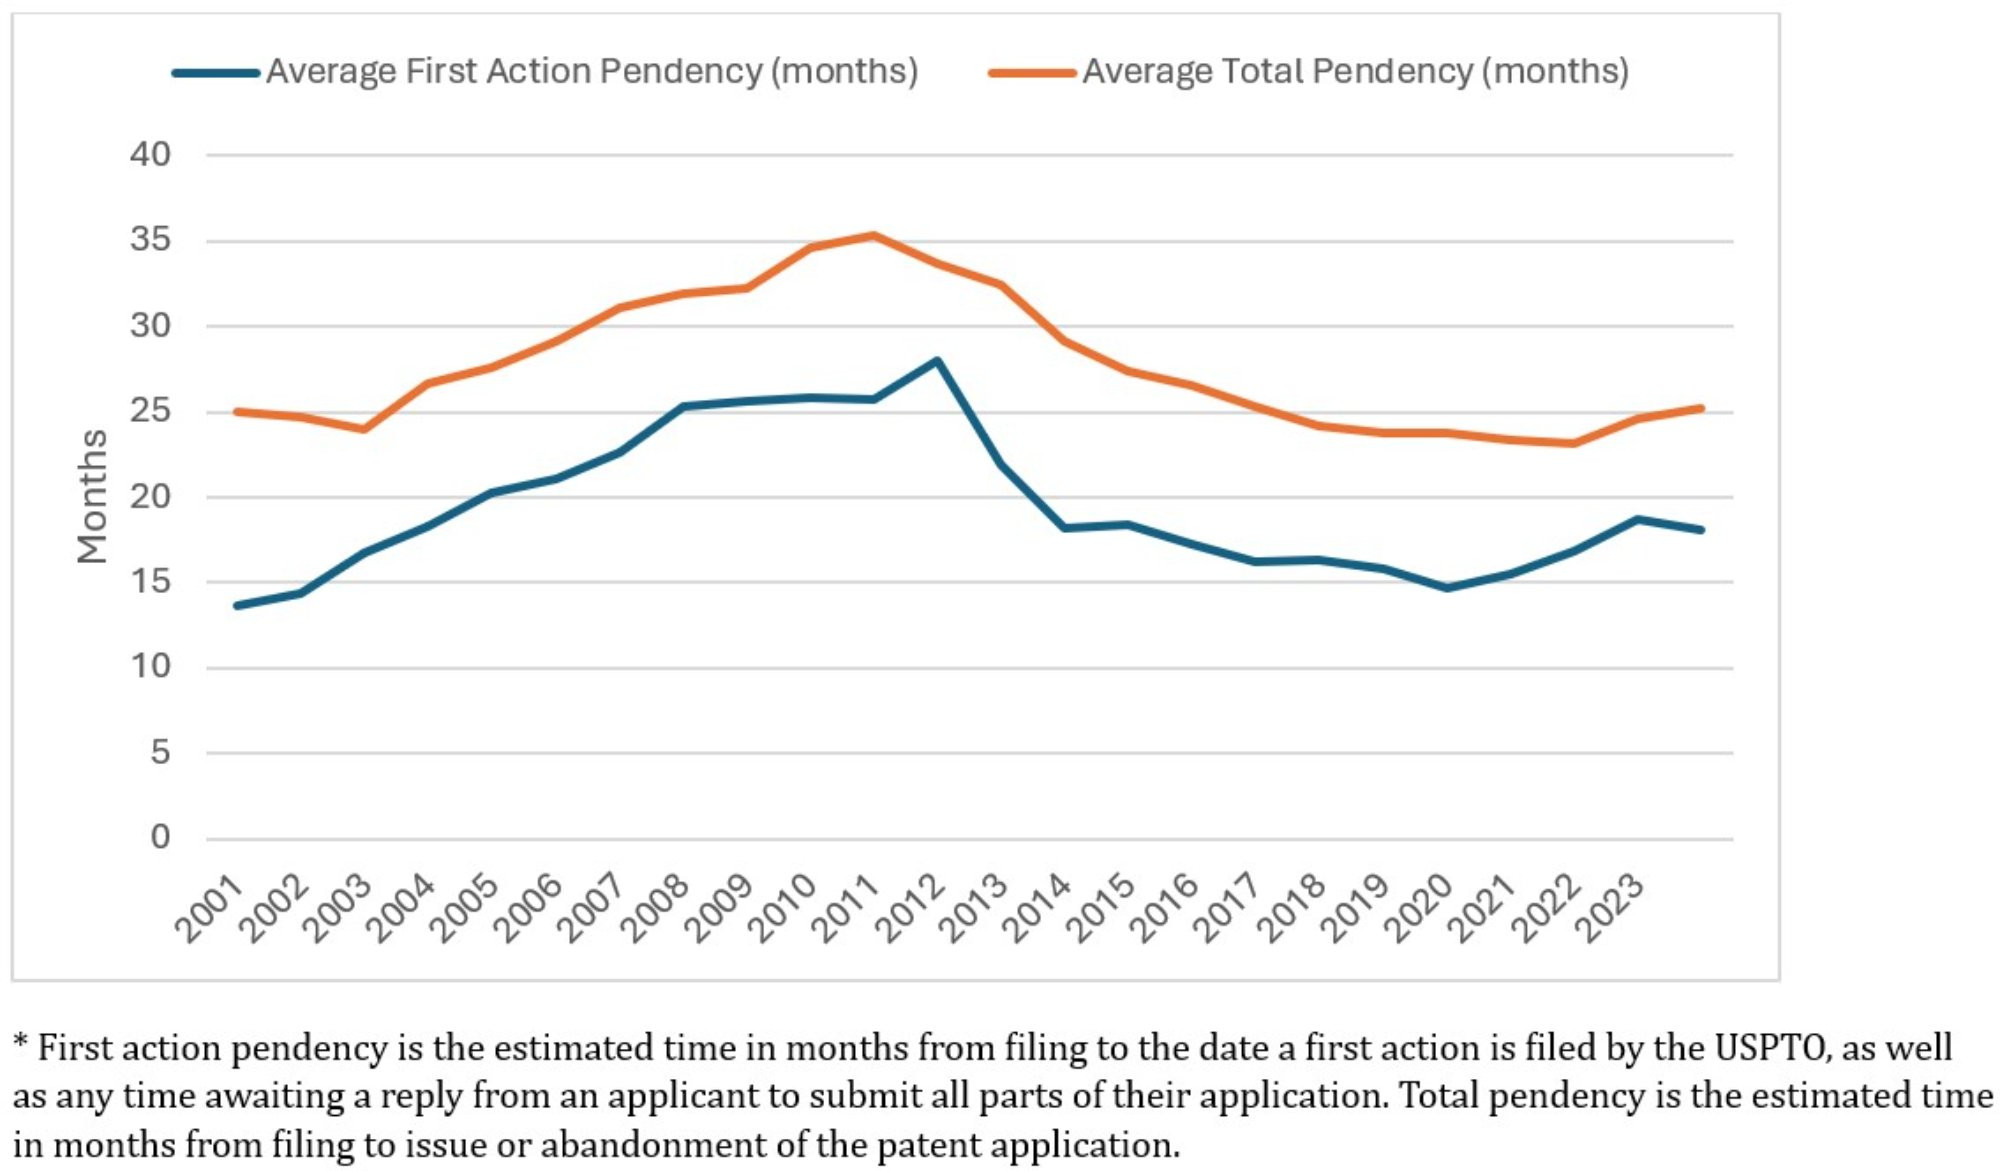
Description: The patent wait times graph shows that average wait times for patents have decreased since 2010.
Source: United States Patent and Trademark Office, www.uspto.gov
One possible explanation for the decrease in medical patents after 2014 rests on a change in the patenting process itself and the resulting incentive structure. The Leahy-Smith America Invents Act (AIA) of 2011 switched U.S. patenting from a “first-to-invent” to a “first-to- file” system for patent applications filed on or after March 16, 2013. The act also made changes to patenting fees and the definition of “prior art” for patent reviews as well as several changes affecting patent litigation. The observed pattern of medical patenting since 2014 could be the result of innovators taking a “wait and see” approach to evaluating the implications of the AIA.
Research Spending
While patents are one of the outcomes of the innovation process, spending on research and development is one measure of the process inputs. While R&D spending by private sector companies is not always publicly available, government funding for research is. Figure 5 shows the dollar value of National Institute of Health (NIH) funding awards to West Michigan organizations by year for 2000-2023. Figure 6 shows those award amounts as a percentage of the NIH awards for the entire state. These figures generally show a significant increase in NIH research funding for West Michigan, both in dollar terms and relative to the state as a whole.
Figure 5: National Institute of Health Funding to West Michigan Organizations*, 2000-2023
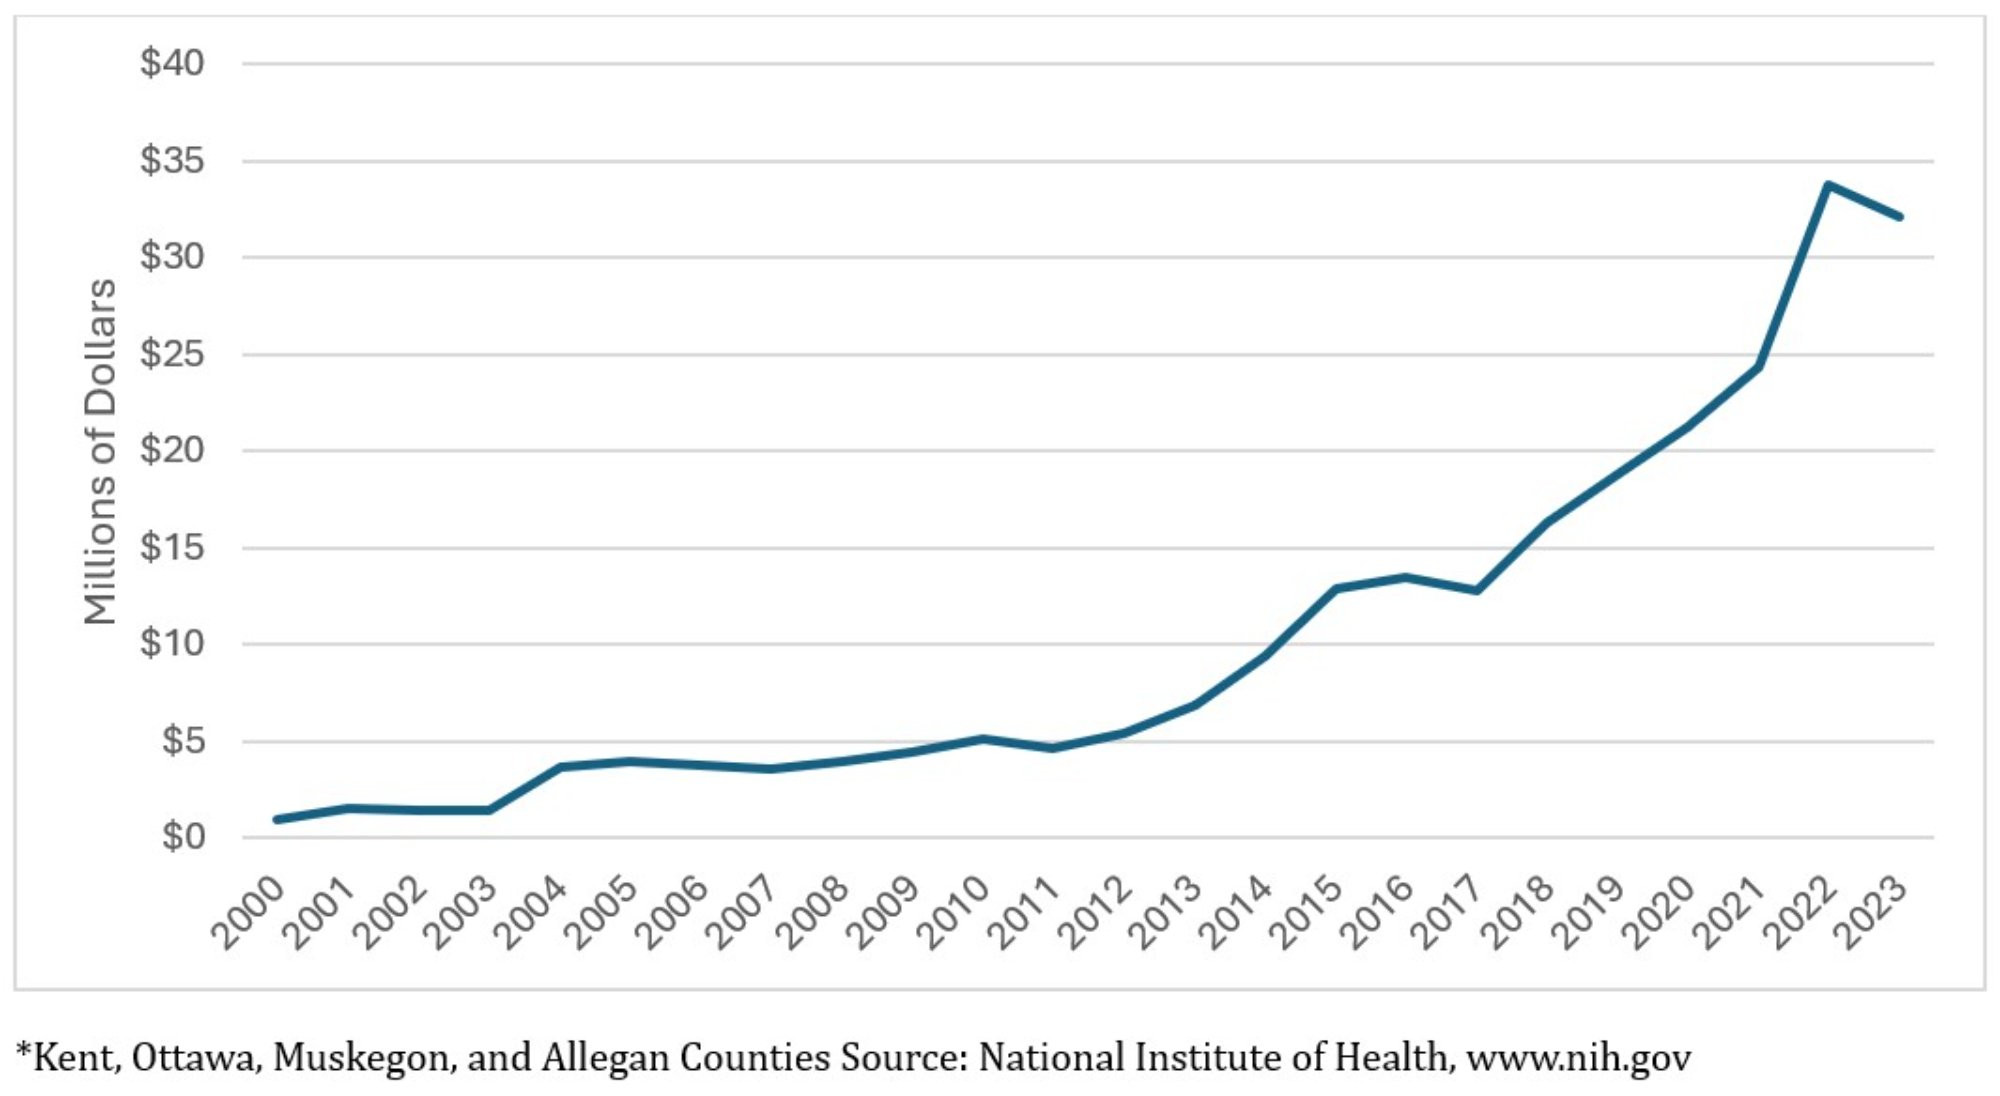
Description: The NIH funding graph shows that the total amount of NIH funding to West Michigan organizations has increased substantially since 2000.
Source: National Institute of Health, www.nih.gov
Figure 6: National Institute of Health Funding to West Michigan Organizations as a Percentage of Total Michigan Funding, 2000–2023
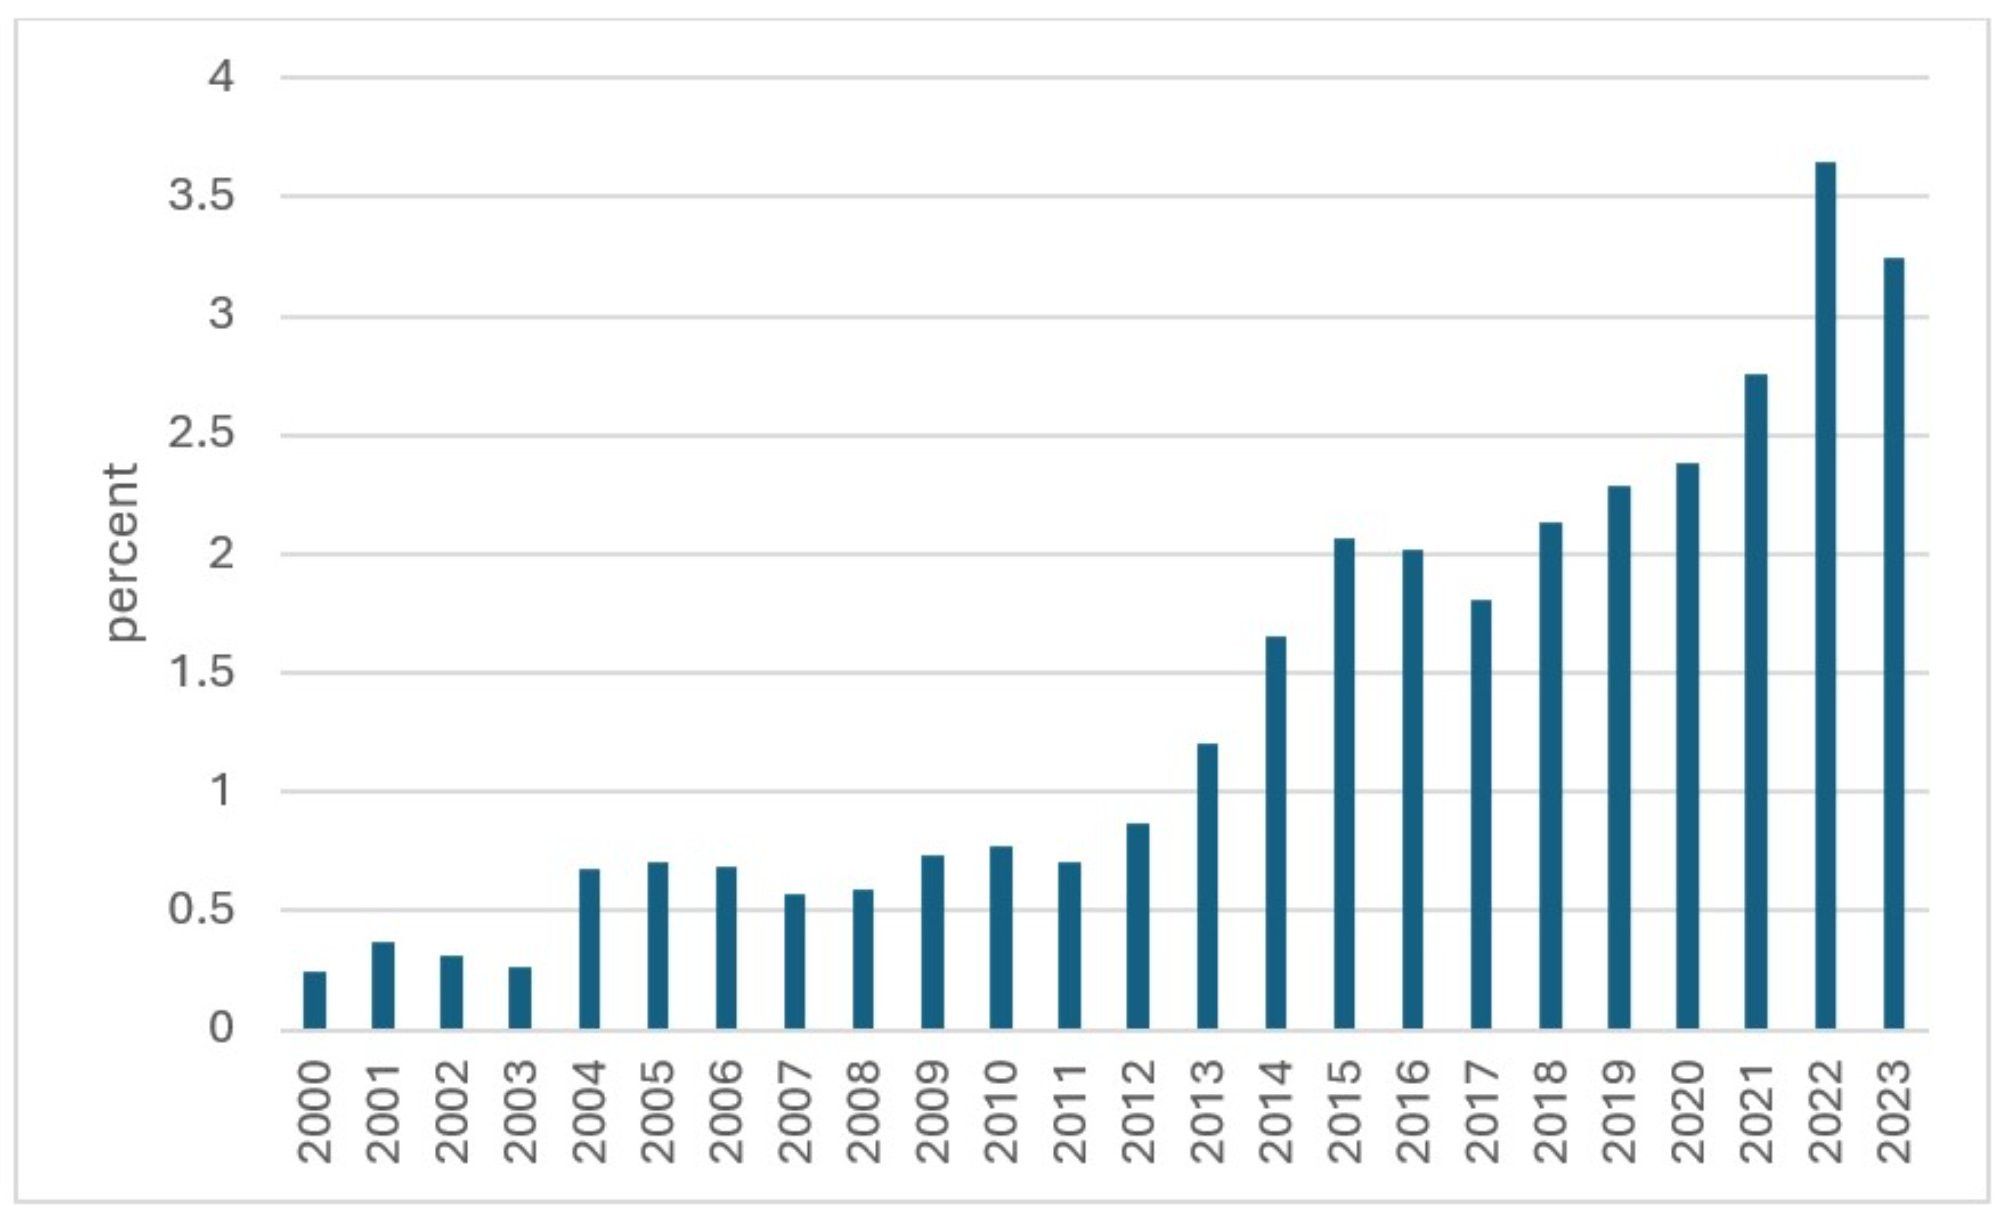
Description: The NIH percentage funding graph shows that NIH funding to West Michigan organizations is a small percentage of NIH funding to Michigan as a whole, but that this percentage has increased since 2000.
Source: National Institute of Health, www.nih.gov
The increase in NIH funding is reassuring. Combined with the data on patenting, the funding numbers could indicate that medical innovation itself is not declining, but just that fewer medical innovations are being patented. Unfortunately, the NIH data does not imply that total spending for medical research (public and private) has a similar upward trend.