Education and Job Growth
By Cody Kirby, Ph.D., Visiting Faculty, Department of Economics, Seidman College of Business, Grand Valley State University
We begin the discussion of trends in job growth by tracking changes in total employment for the U.S. and the state of Michigan relative to January 2005. Figure 1 plots the growth in nonfarm payroll jobs between January 2005 and March 2024.
Figure 1: Percent Change in Nonfarm Payroll Jobs, Jan. 2005 to June 2024
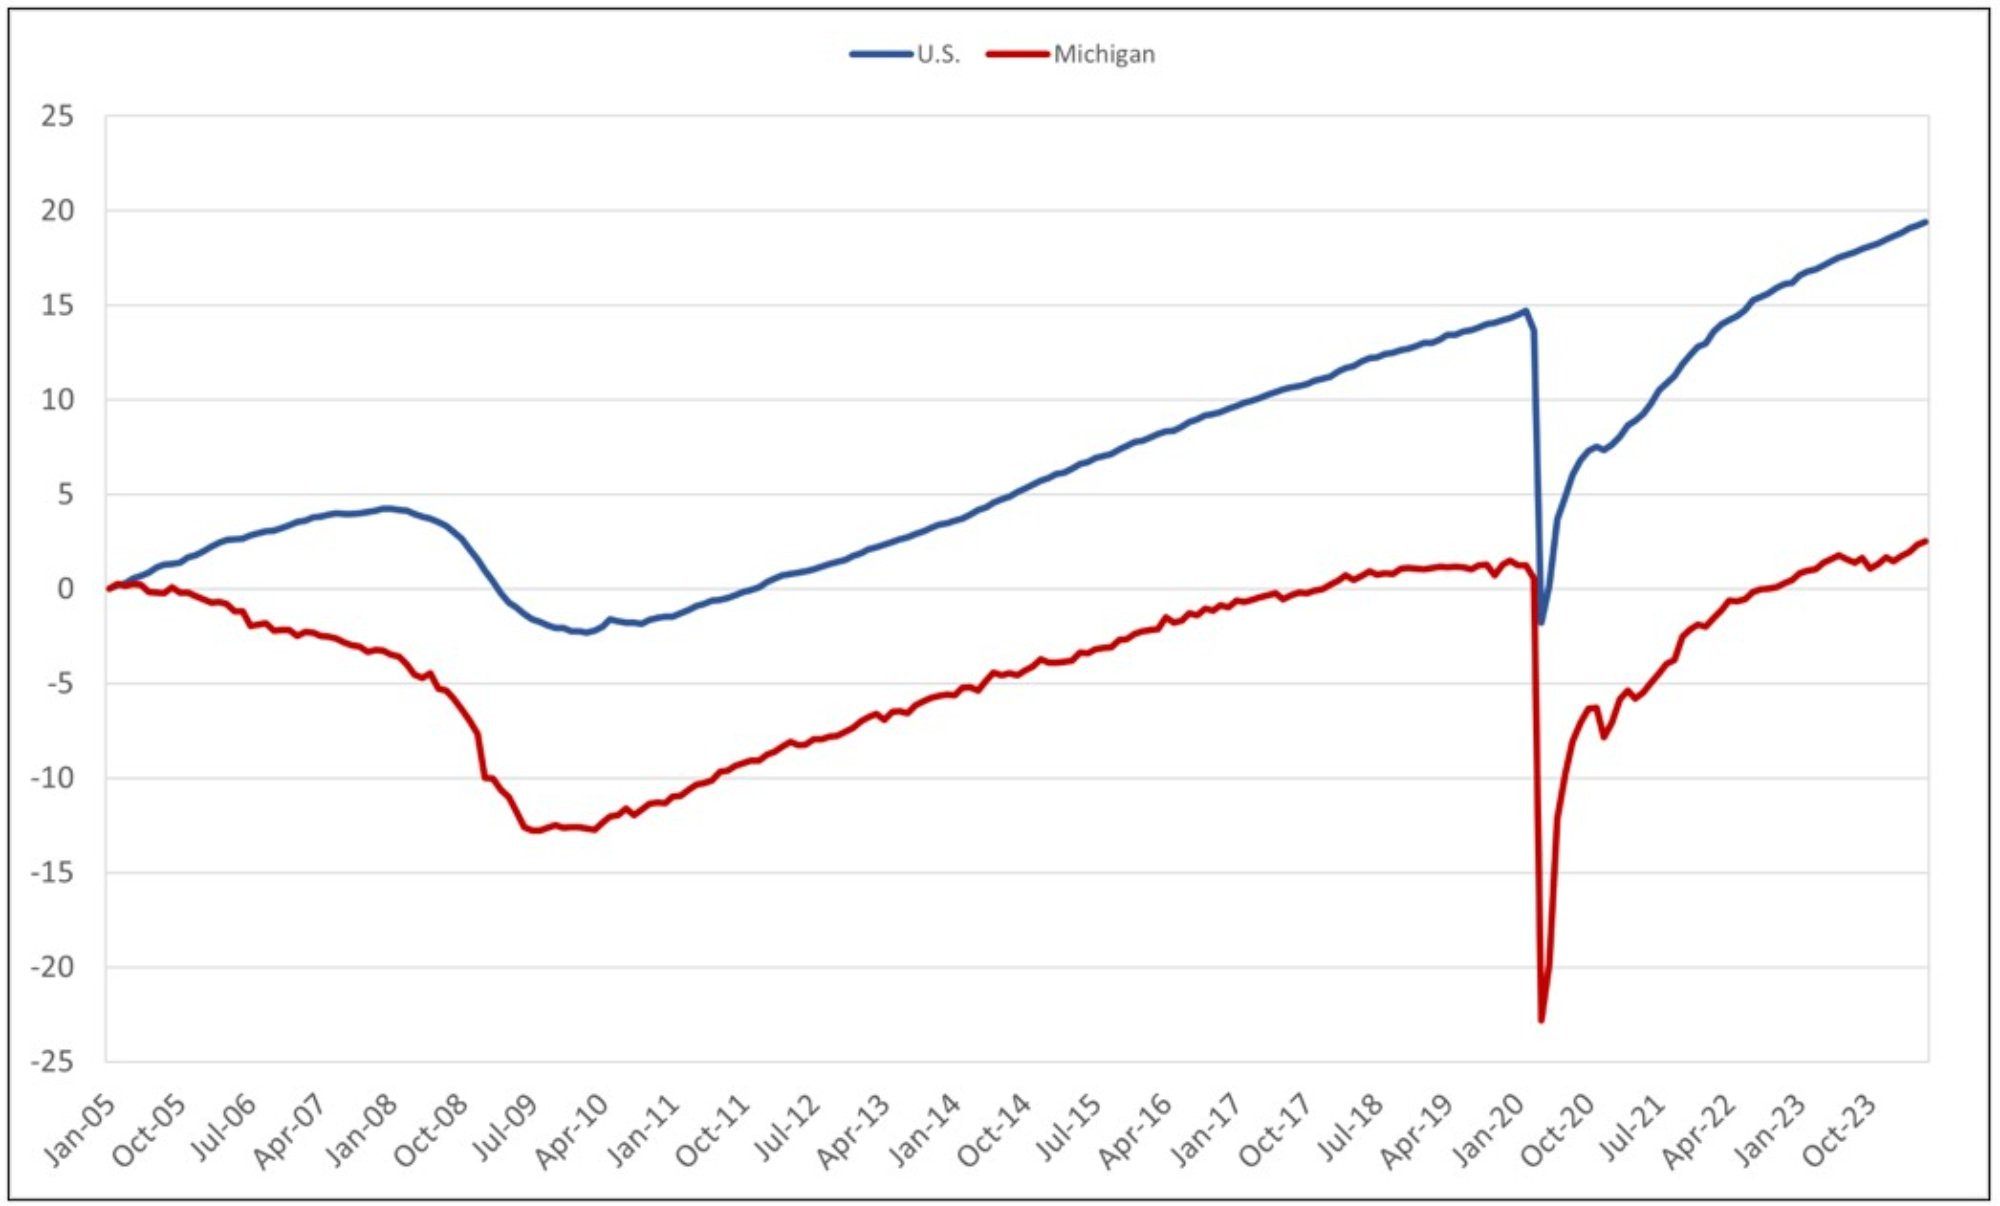
Description: Figure 1 shows the percent change in employment relative to January 2005 at the state and national levels. It shows that employment growth has occurred faster nationally than at the state level. Over the past two decades, there has been little to no employment growth in Michigan, which the COVID-19 pandemic has further exacerbated.
Sources: U.S. Source: http://data.bls.gov/cgi-bin/srgate; U.S. Series ID: CES0000000001; State Source: http://data.bls.gov/cgi-bin/srgate; State Series ID: SMS26000000000000001
Turning to the Great Recession of 2008, we focus on the dramatic job loss in Michigan and the U.S. At the trough of the Great Recession, the number of jobs decreased by more than two percent nationally and nearly 13 percent across Michigan. Both the state of Michigan and the U.S. began adding jobs in early 2010. By April 2014, job growth in the U.S. had recovered to its pre-recession level (about 4.2 percent in December 2007) and has continued to increase. However, Michigan's job numbers failed to reach their pre-recession levels until January 2018, meaning the state has only experienced a small net gain in jobs in over a decade. After healing from the Great Recession, the optimistic economic outlook turned pessimistic with the introduction of the novel coronavirus (COVID-19). By April 2020, the stock of Michigan jobs had fallen by 23% compared to 2005, and the discrepancy between the U.S. and Michigan’s job growth numbers further widened from 11 percent in January 2018 to 21 percent in April 2020. Job growth began its pandemic recovery in May 2020 and has persisted across the U.S. and Michigan. As of May 2023, jobs have increased by roughly 19 percent and 3 percent across the U.S. and Michigan, respectively.
Figure 2 provides a more detailed analysis of employment changes by examining job growth (or losses) at the industry level from 2005 to 2023. We plot data for the Grand Rapids Metropolitan Statistical Area (MSA), the state of Michigan, and the entire United States. The Grand Rapids region has experienced significant job growth (> 50 percent) over this period in ten occupational categories: management (110 percent), healthcare practitioners and technical (99 percent), business and financial (95 percent), healthcare support (81 percent), architecture and engineering (76 percent), computer and mathematical (71 percent), community and social service (65 percent), transportation and material moving (59 percent), building and grounds cleaning and maintenance (57 percent), and personal care and services occupations (54 percent).
Figure 2: Job Growth for Select Major Occupational Categories, 2005-2023
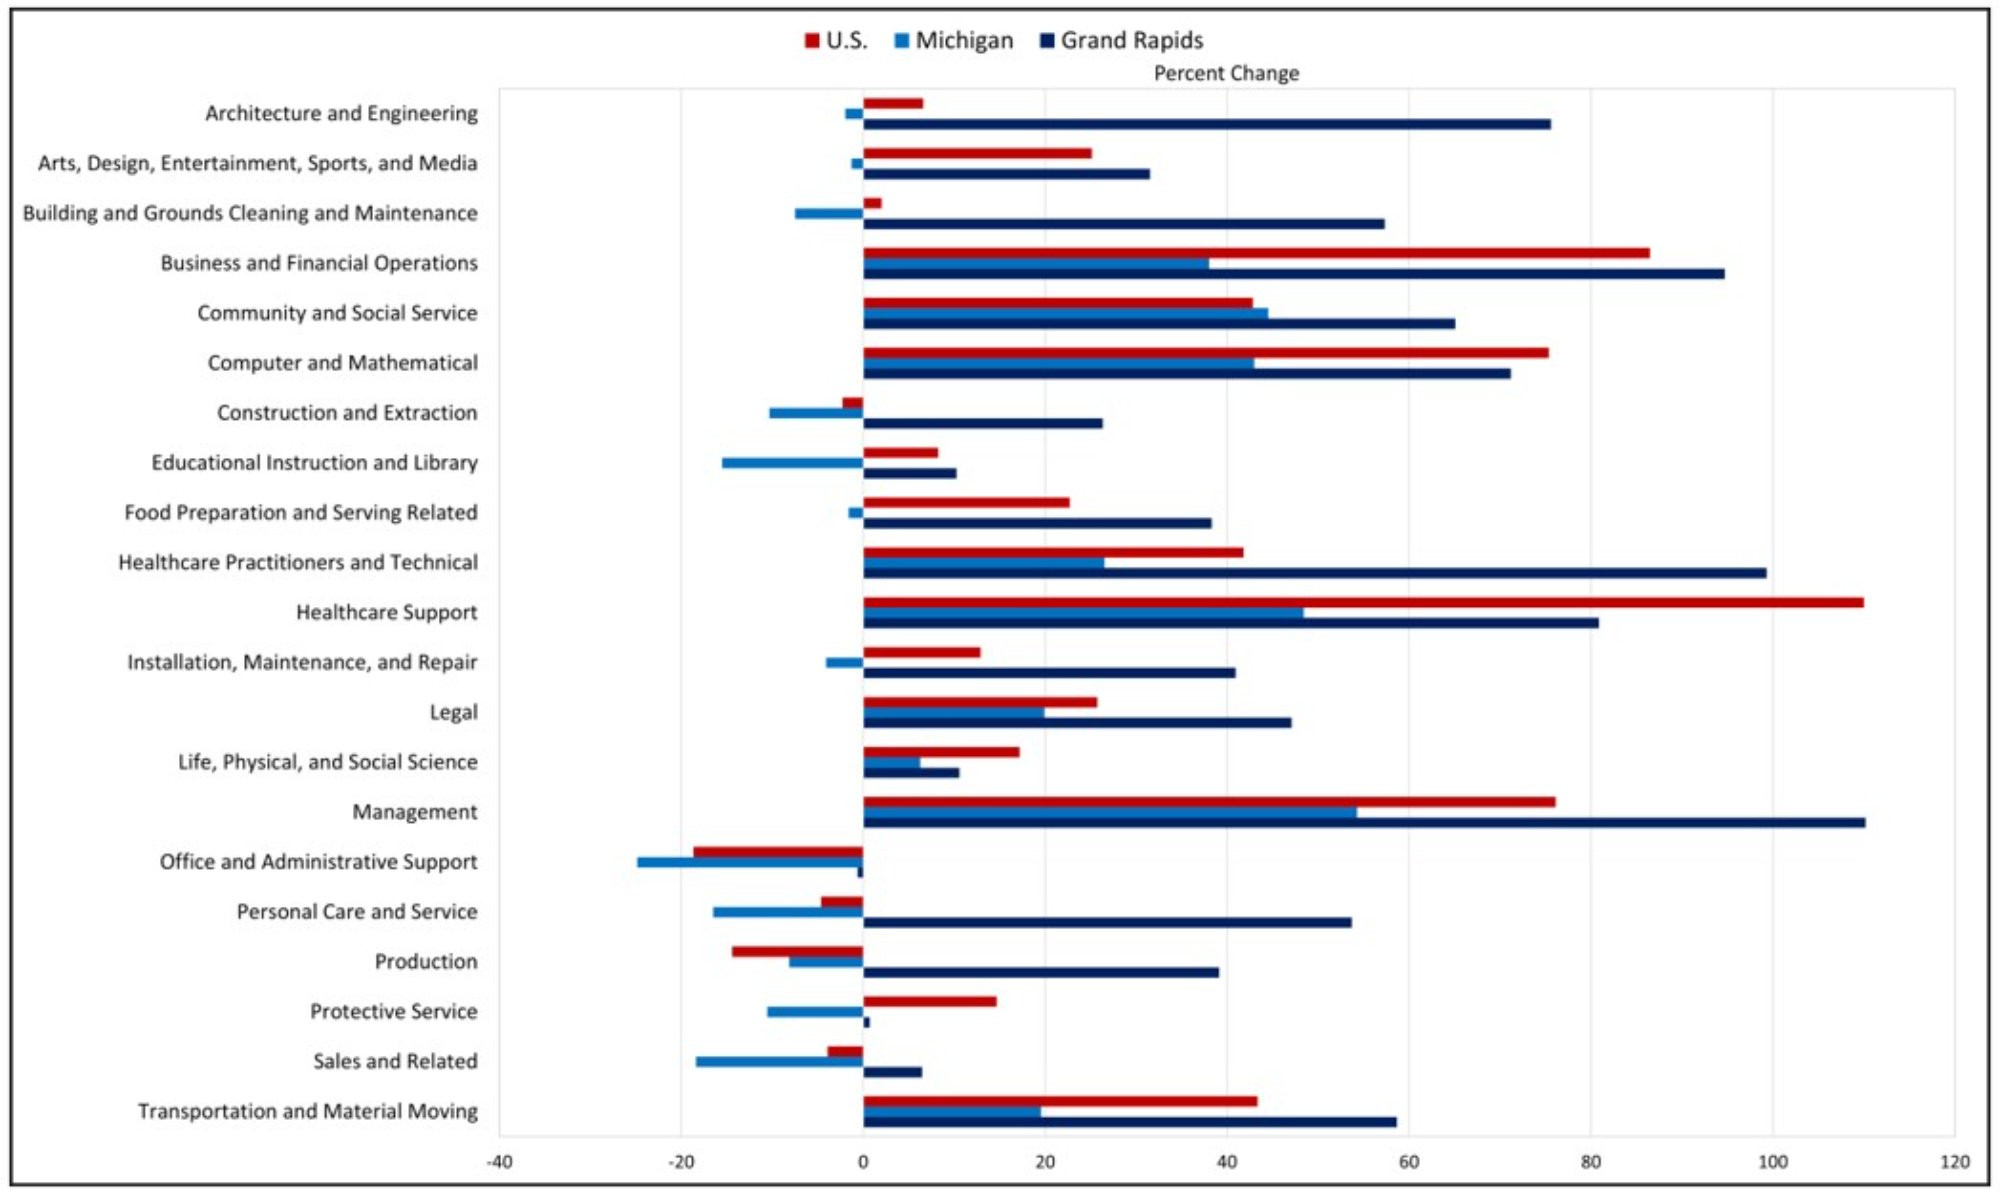
Description: Figure 2 shows that Grand Rapids' employment gains exceed 50 percent for all major healthcare occupational categories. Local growth estimates have surpassed the gains observed at the state and national levels.
Sources: U.S. 2005: http://www.bls.gov/oes/2005/may/oes_nat.htm; U.S. 2023: http://www.bls.gov/oes/2023/may/oes_nat.htm; GR 2005: http://www.bls.gov/oes/2005/may/oes_24340.htm; MI 2005: http://www.bls.gov/oes/2005/may/oes_mi.htm; MI 2023: http://www.bls.gov/oes/2023/may/oes_mi.htm; GR 2023: http://www.bls.gov/oes/2023/may/oes_24340.htm
Grand Rapids has observed significant increases in employment growth among healthcare practitioners and technical occupations over the past decade. Local growth in these occupations has outpaced both the statewide and nationwide estimates. Since 2005, the increase in Grand Rapids healthcare practitioners and technical occupations has expanded twice and thrice more than at the state and national levels. However, it is essential to note that these growth rates are lower than those observed in 2020 (see Health Check 2021) due to the adverse economic shocks of the COVID-19 pandemic. Between 2005 and 2023, the U.S. employment sectors that have suffered the largest job losses include office and administrative support (-19 percent), production (-14 percent), personal care and services (-5 percent), sales and related (-4 percent), and construction and extraction (-2 percent) occupations.
The job losses spanning multiple Michigan occupational categories indicate that the negative effect of COVID-19 was more pronounced across the state than in the city of Grand Rapids. As of May 2020, we show statewide declines in employment across all 22 major occupational categories, with notable decreases occurring in occupations such as management (-26 percent), farming, fishing, and forestry (-25 percent), food preparation and serving related (-16 percent), community and social service (-16 percent), and business and financial (-15 percent). In comparison, since May 2020, Grand Rapids has only observed employment declines in the seven major occupational categories, including transportation and material moving (-8 percent), building and grounds cleaning and maintenance (-7 percent), farming, fishing, and forestry (-4 percent), architecture and engineering (-4 percent), office and administrative support (-4 percent), and healthcare support (-1 percent).
Turning the discussion to education, we continue to find a negative growth rate in educational instruction and library occupations at the state level. Since May 2005, employment in this category has decreased by 16 percent. While the decrease in educational employment highlights a possible shrink in the number of young people choosing to pursue a college education, and a reduced ability for healthcare employers to find qualified workers to fill vacancies in those occupations in the coming years, we choose to adopt a more optimistic outlook. For example, in Grand Rapids, employment in educational occupations has increased by 10 percent since 2005; a comparable trend exists at the national level (8 percent).
Figures 3 and 4 compiles data from the National Center for Educational Data Statistics, the Association for American Medical Colleges, and the American Association of Colleges of Osteopathic Medicine to analyze overall enrollment trends in U.S. universities since 2005 and 2022. Since 2005, university enrollment has increased by 8 percent in U.S. educational institutions. Medical school matriculants is used to measure the pool of applicants that are admitted into an institution and attend the following semester. Since 2005, the number of medical school applicants who have participated in the first year of medical school has increased by 35 percent. Additionally, medical school enrollment and new graduates have increased by 36 percent and 56 percent since 2005.
Figure 3: Percent Change in College Education Metrics, 2005-2023
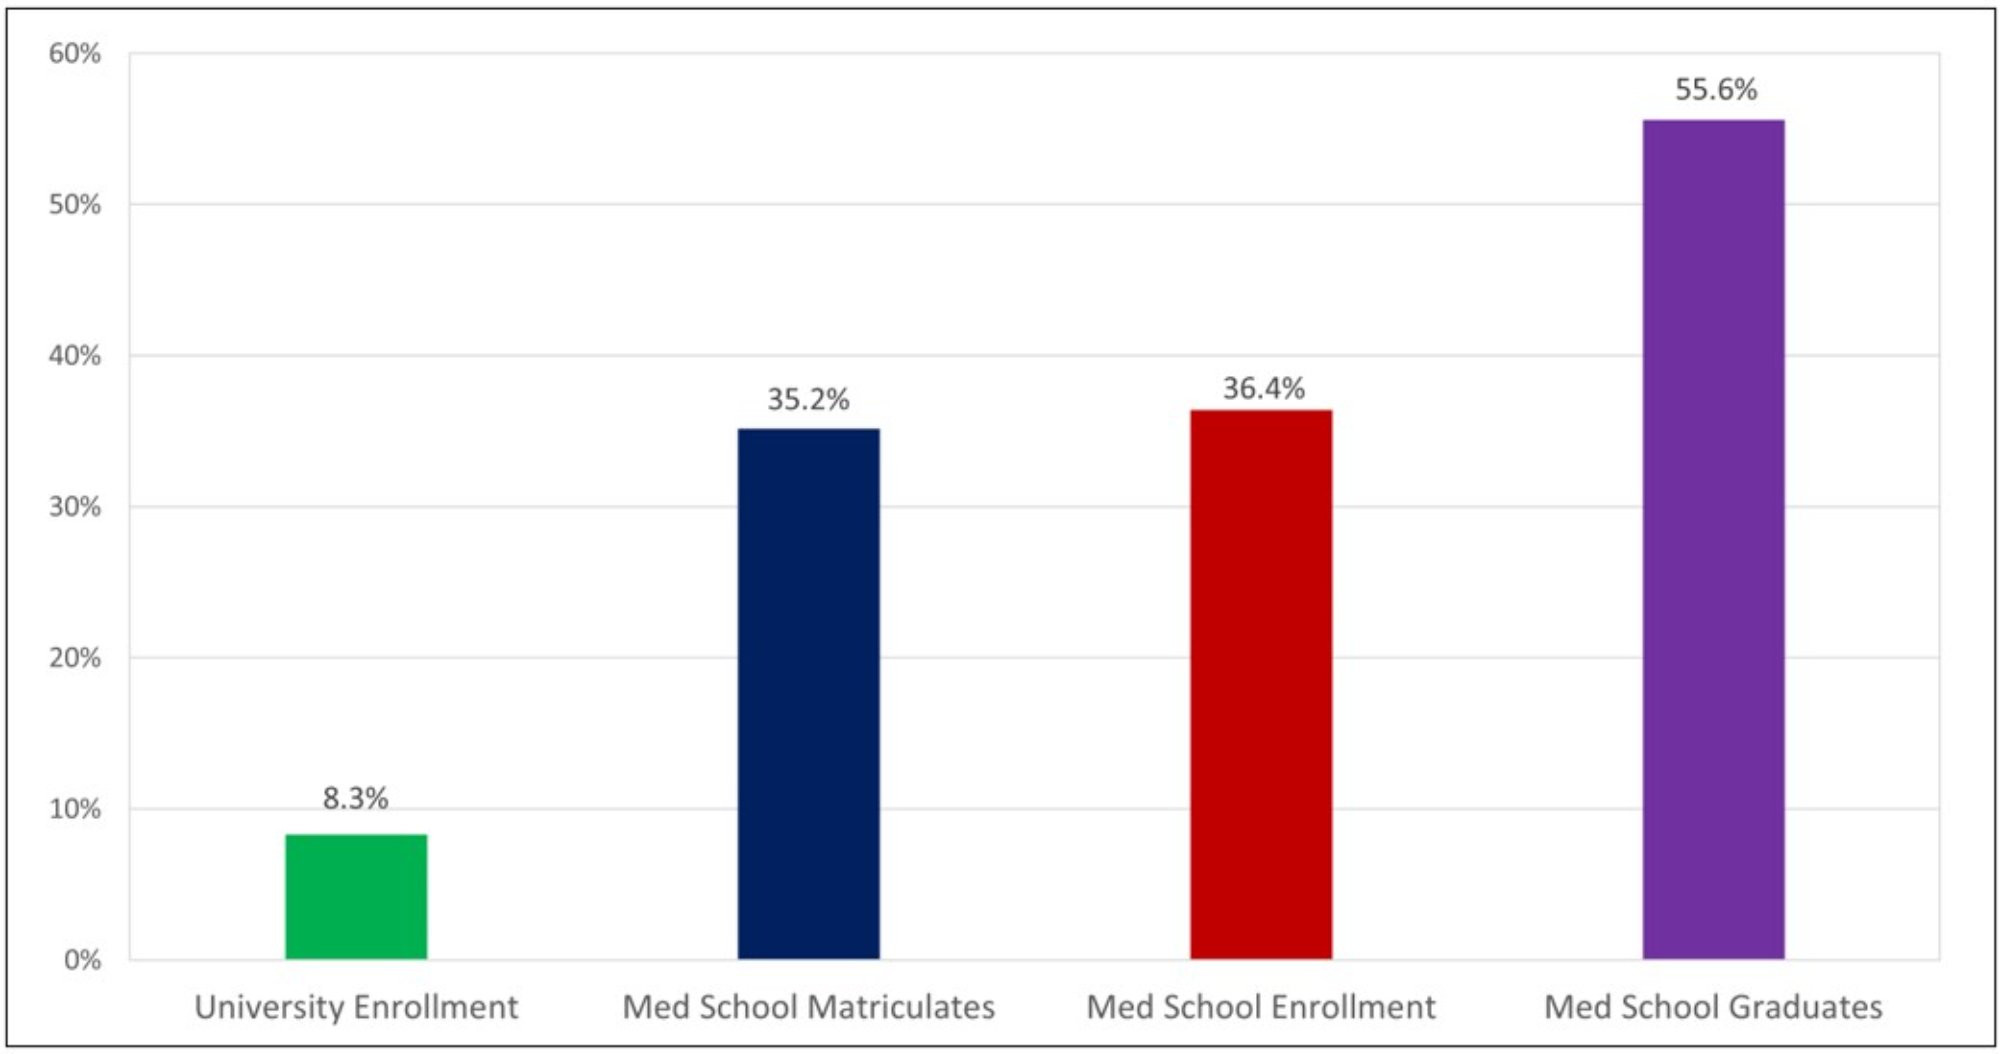
Description: Figure 3 shows that university enrollment has increased by 8.3% since 2005. Additionally, more students are enrolling in and graduating from medical school.
Sources: Association of American Medical Colleges; American Association of Colleges of Osteopathic Medicine; National Association for Education Data Statistics; National Student Clearinghouse Research Center
Figure 4: Percent Change in College Education Metrics, 2022-2023
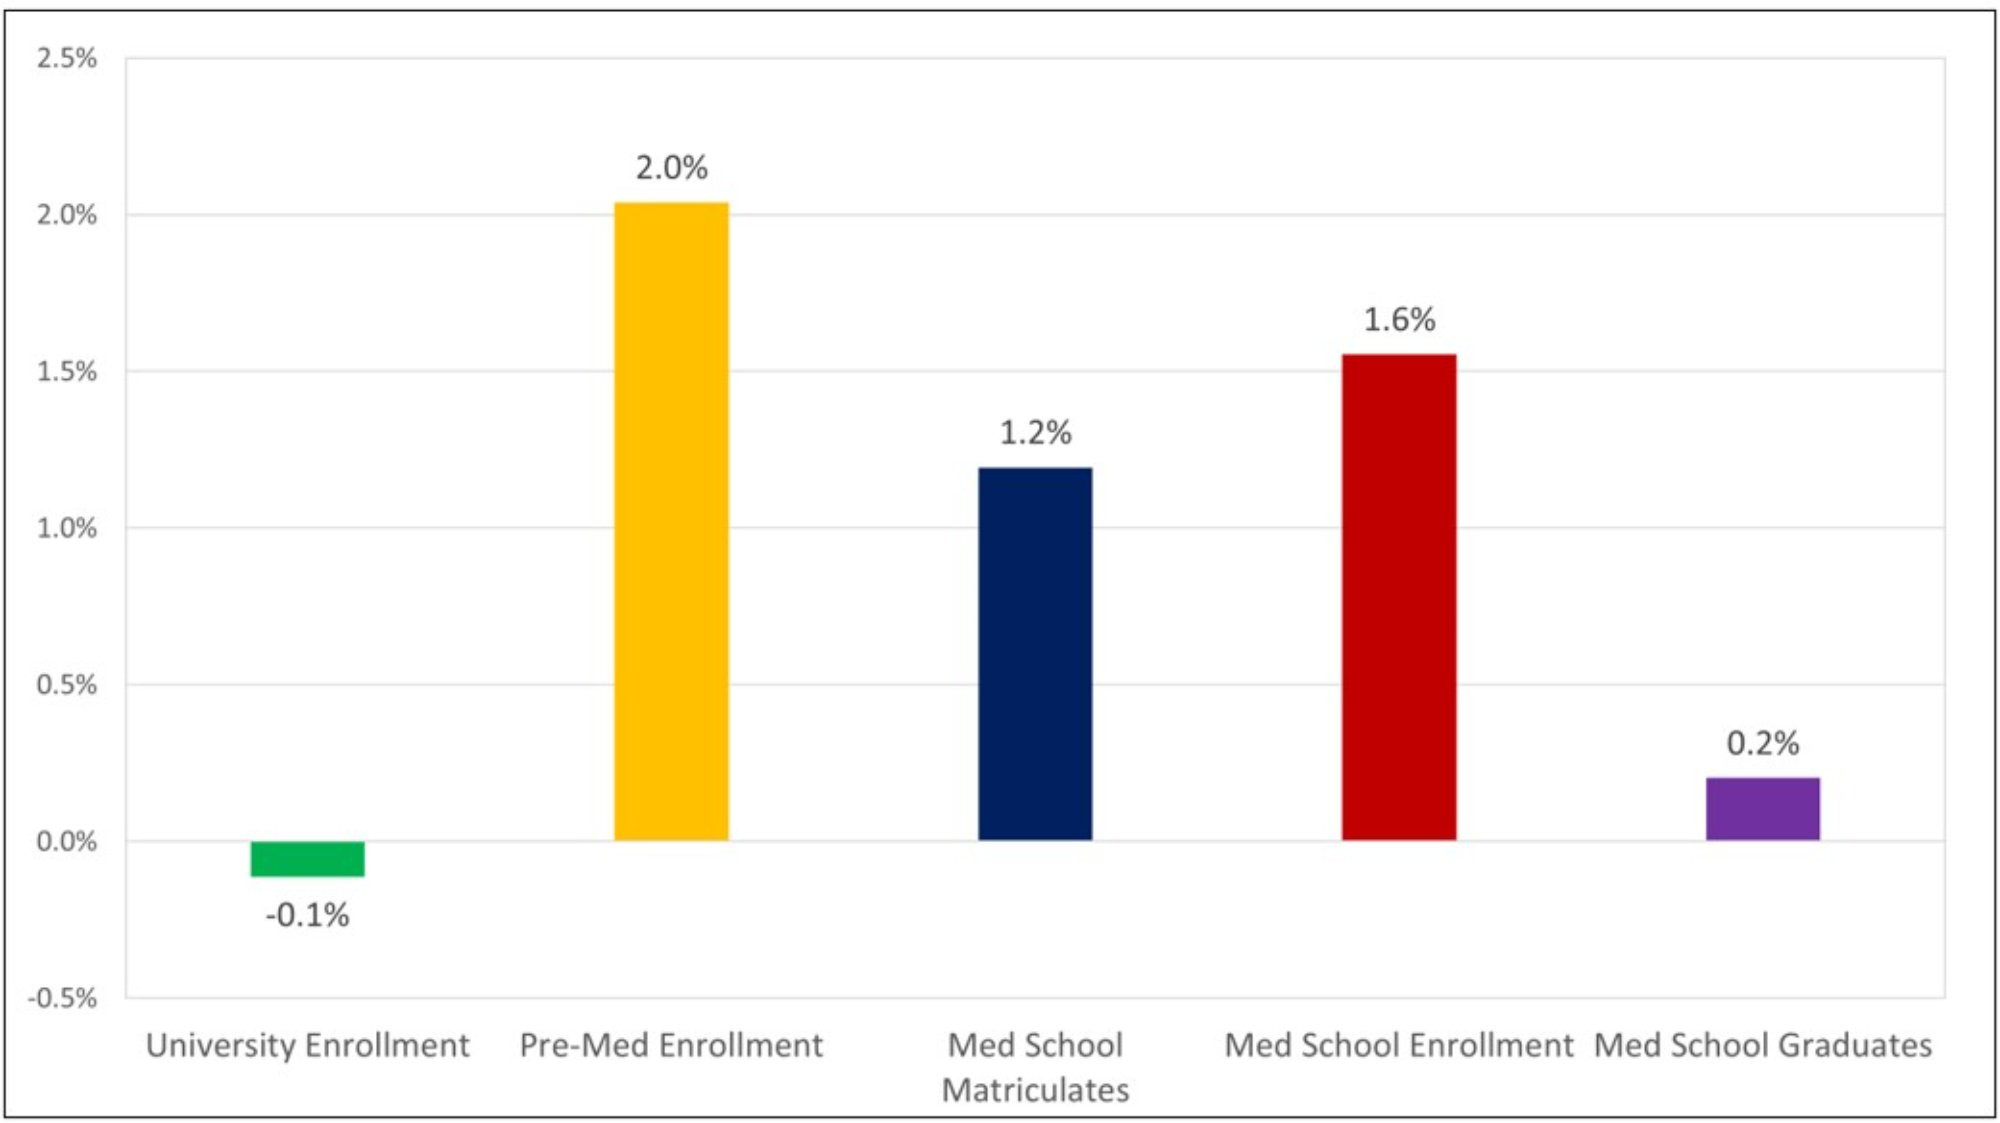
Description: Figure 4 provides evidence of a shift from low-return to high-return degrees related to healthcare. While undergraduate enrollment is down by 0.1% nationally, enrollment into pre-medical majors is up by 2% between 2022 and 2023.
Sources: Association of American Medical Colleges; American Association of Colleges of Osteopathic Medicine; National Association for Education Data Statistics; National Student Clearinghouse Research Center
Turning to recent trends in education, we analyze pre-med enrollment at the undergraduate level using data from the National Student Clearinghouse to focus on the degree types pertinent to medical school admission. Since 2022, total university enrollment at the university level has remained relatively stable. However, pre-med enrollment in undergraduate degrees related to healthcare occupations has increased by 2 percent. These figures suggest a reshuffling from degrees with lower career returns to higher career returns, such as the degrees necessary to acquire a future occupation in the healthcare industry.
Given these trends in employment, we further examine the changes in labor supply and demand conditions in the healthcare sector in Grand Rapids, Michigan, and the United States. To analyze this issue, we proceeded with the following steps:
- We observed job growth for selected healthcare occupations since 2005.
- We formulated specific employment demand predictions for select healthcare professions in the geographical area of focus.
- We measured changes in earnings over the past decade for these professions.
Tables 1 through 3 present data on the historic employment levels and growth rates for various healthcare occupations identified in the Bureau of Labor Statistics (BLS) data for Grand Rapids, Michigan, and the United States. We report growth figures from 2005 to 2023 and 2022 to 2023 to illustrate the long-term and short-term changes in the healthcare employment landscape. On average, local job growth in the healthcare sector has outpaced the growth observed at the state and national levels since 2005. Growth in Grand Rapids has been incredibly robust for pediatricians, occupational therapy assistants, physical therapy assistants, physician assistants, home health and personal care aides, all other physicians, occupational therapists, respiratory therapists, diagnostic medical sonographers, physical therapists, surgical technologists, and pharmacy technicians. Only a few occupations have experienced job losses since 2005. In Grand Rapids, job losses have mounted among medical technologists, licensed practical nurses (LPN), family medicine physicians, nuclear medicine technologists, and opticians.
Table 1: Health Care Jobs for Select Occupations in Grand Rapids, 2005-2023
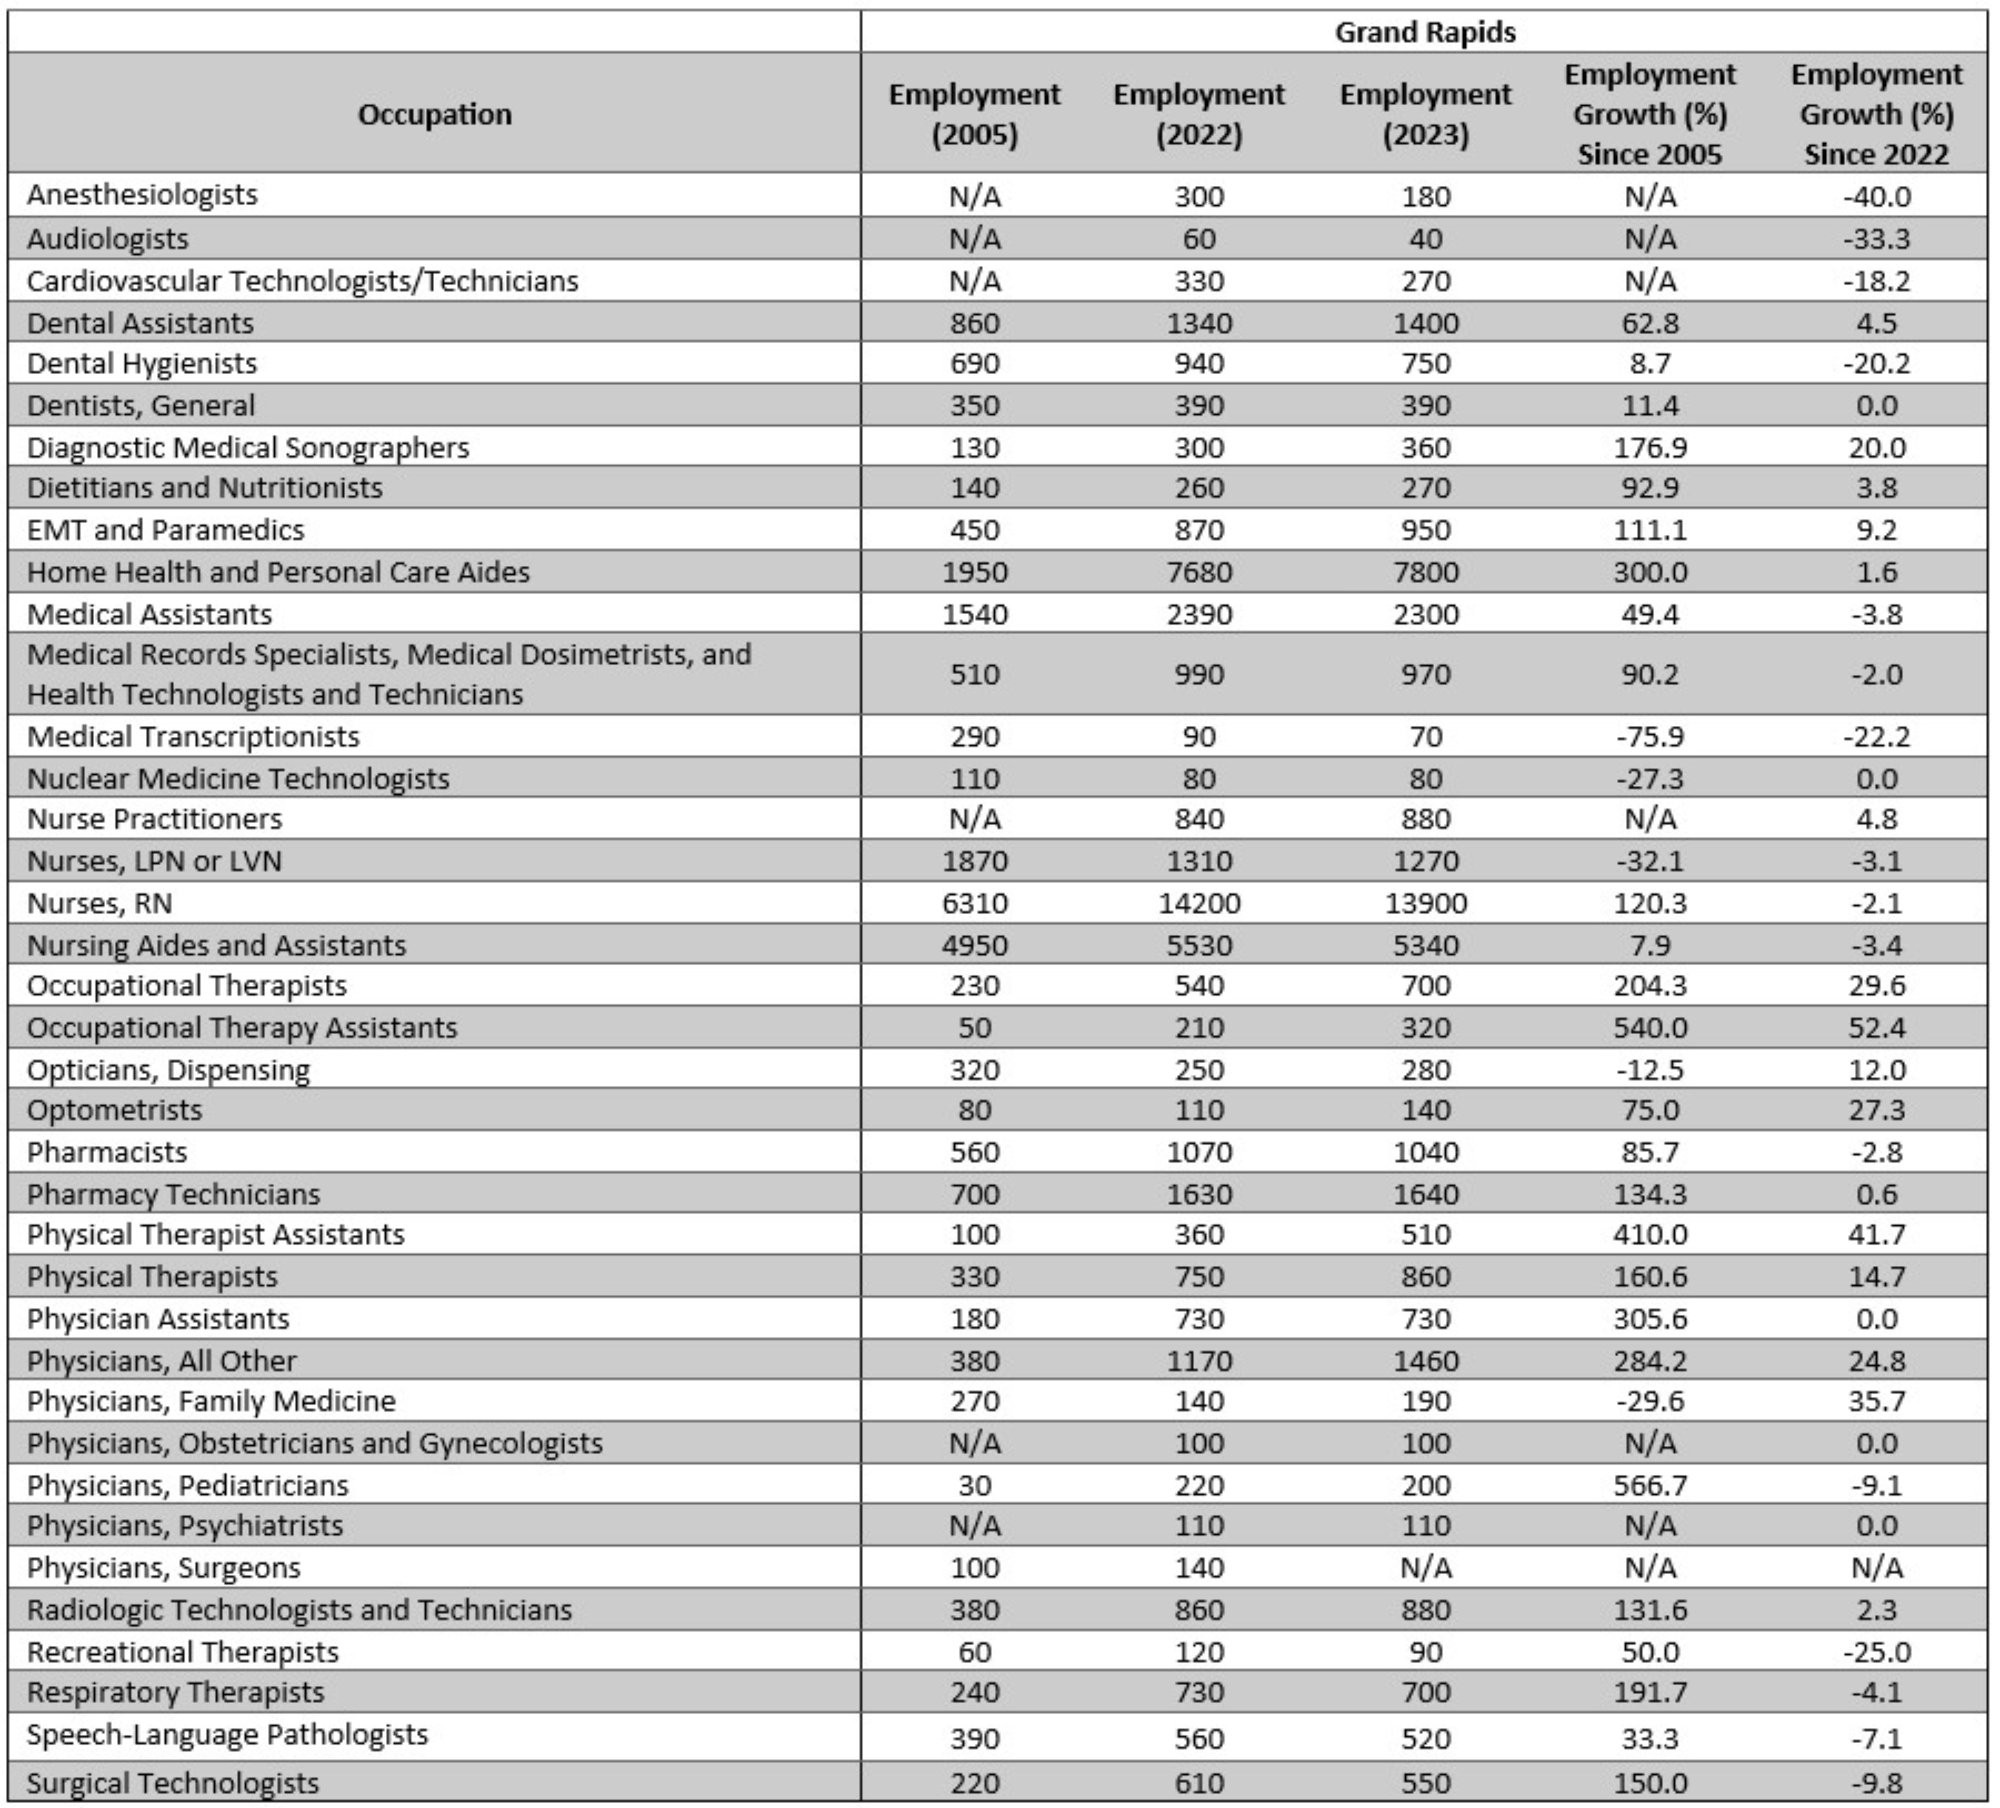
Description: Table 1 presents the employment numbers for select healthcare occupations in Grand Rapids from 2005 to 2023. It shows that 26 select healthcare occupations have observed employment increases since 2005, but 16 professions have experienced negative growth since 2022.
Sources: GR 2005: http://www.bls.gov/oes/2005/may/oes_24340.htm; GR 2022: http://www.bls.gov/oes/2022/may/oes_24340.htm; GR 2023: http://www.bls.gov/oes/2023/may/oes_24340.htm
Table 2: Health Care Jobs for Select Occupations in Michigan, 2005-2023
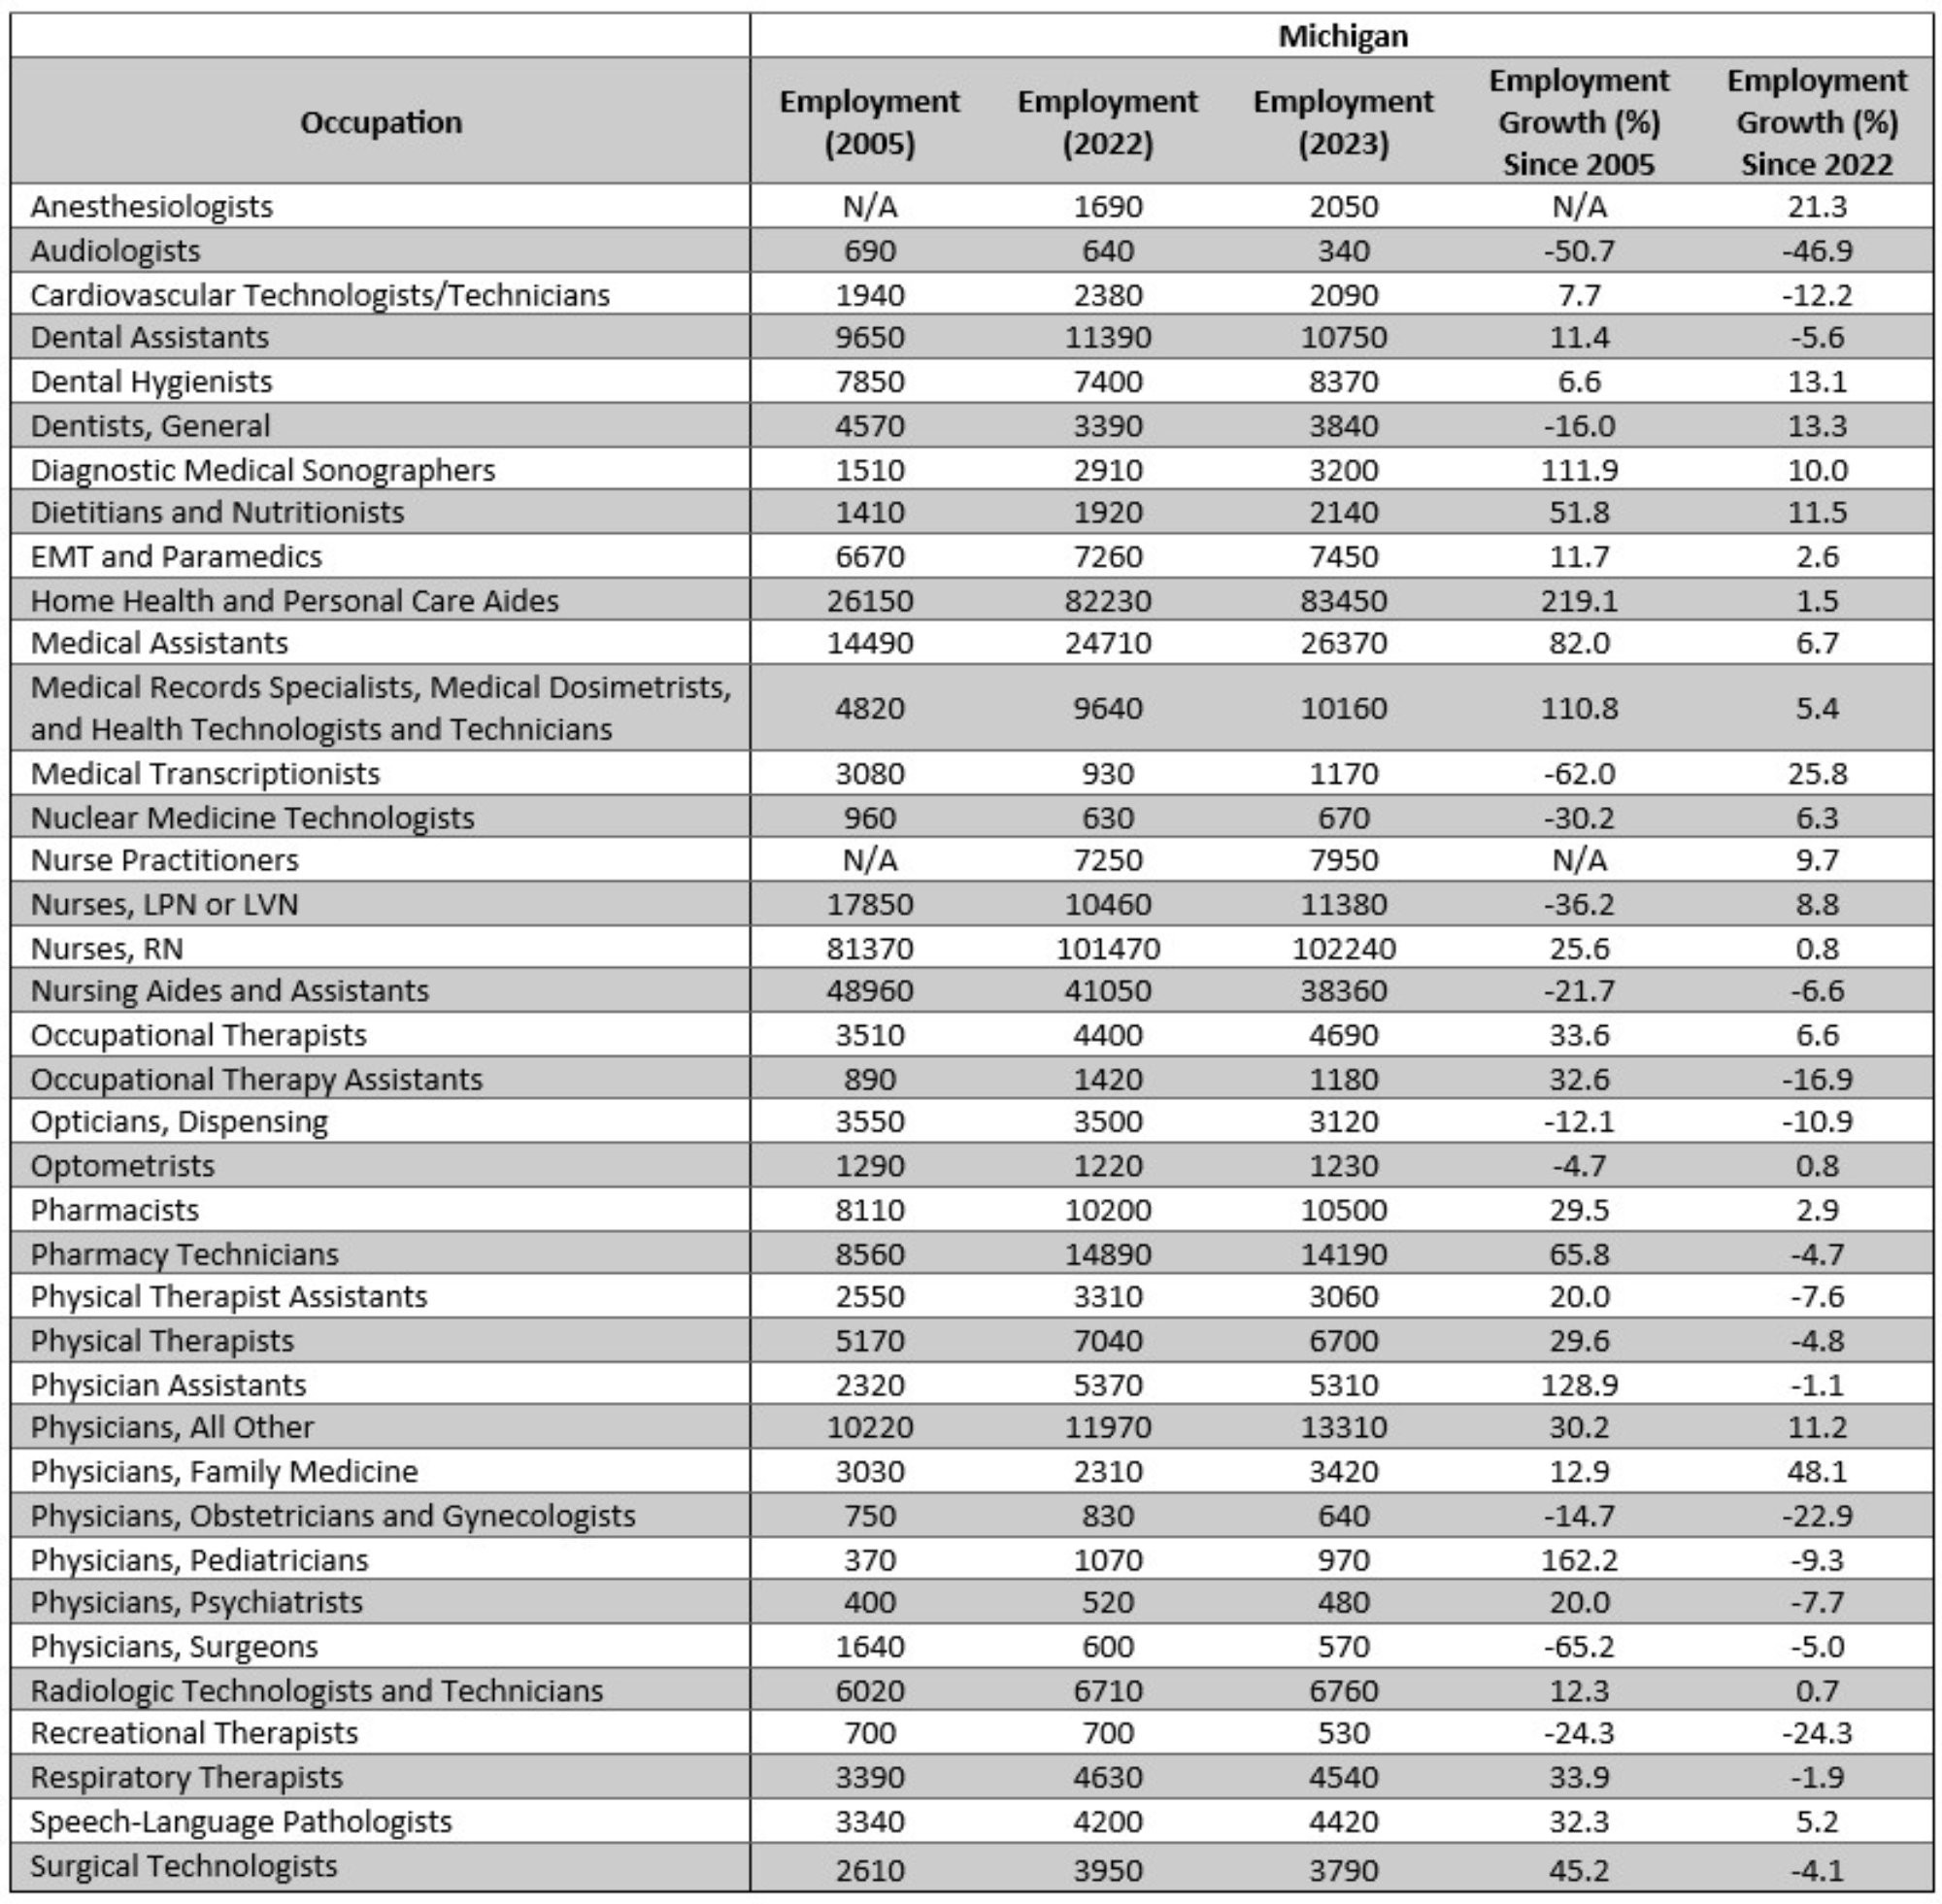
Description: Table 2 presents the employment numbers for select healthcare occupations in Michigan from 2005 to 2023. It shows that 25 select healthcare occupations have observed employment increases since 2005, but 17 professions have experienced negative growth since 2022.
Sources: MI 2005: http://www.bls.gov/oes/2005/may/oes_mi.htm; MI 2022: http://www.bls.gov/oes/2022/may/oes_mi.htm; MI 2023: http://www.bls.gov/oes/2023/may/oes_mi.htm
Table 3: Health Care Jobs for Select Occupations in the United States, 2005-2023
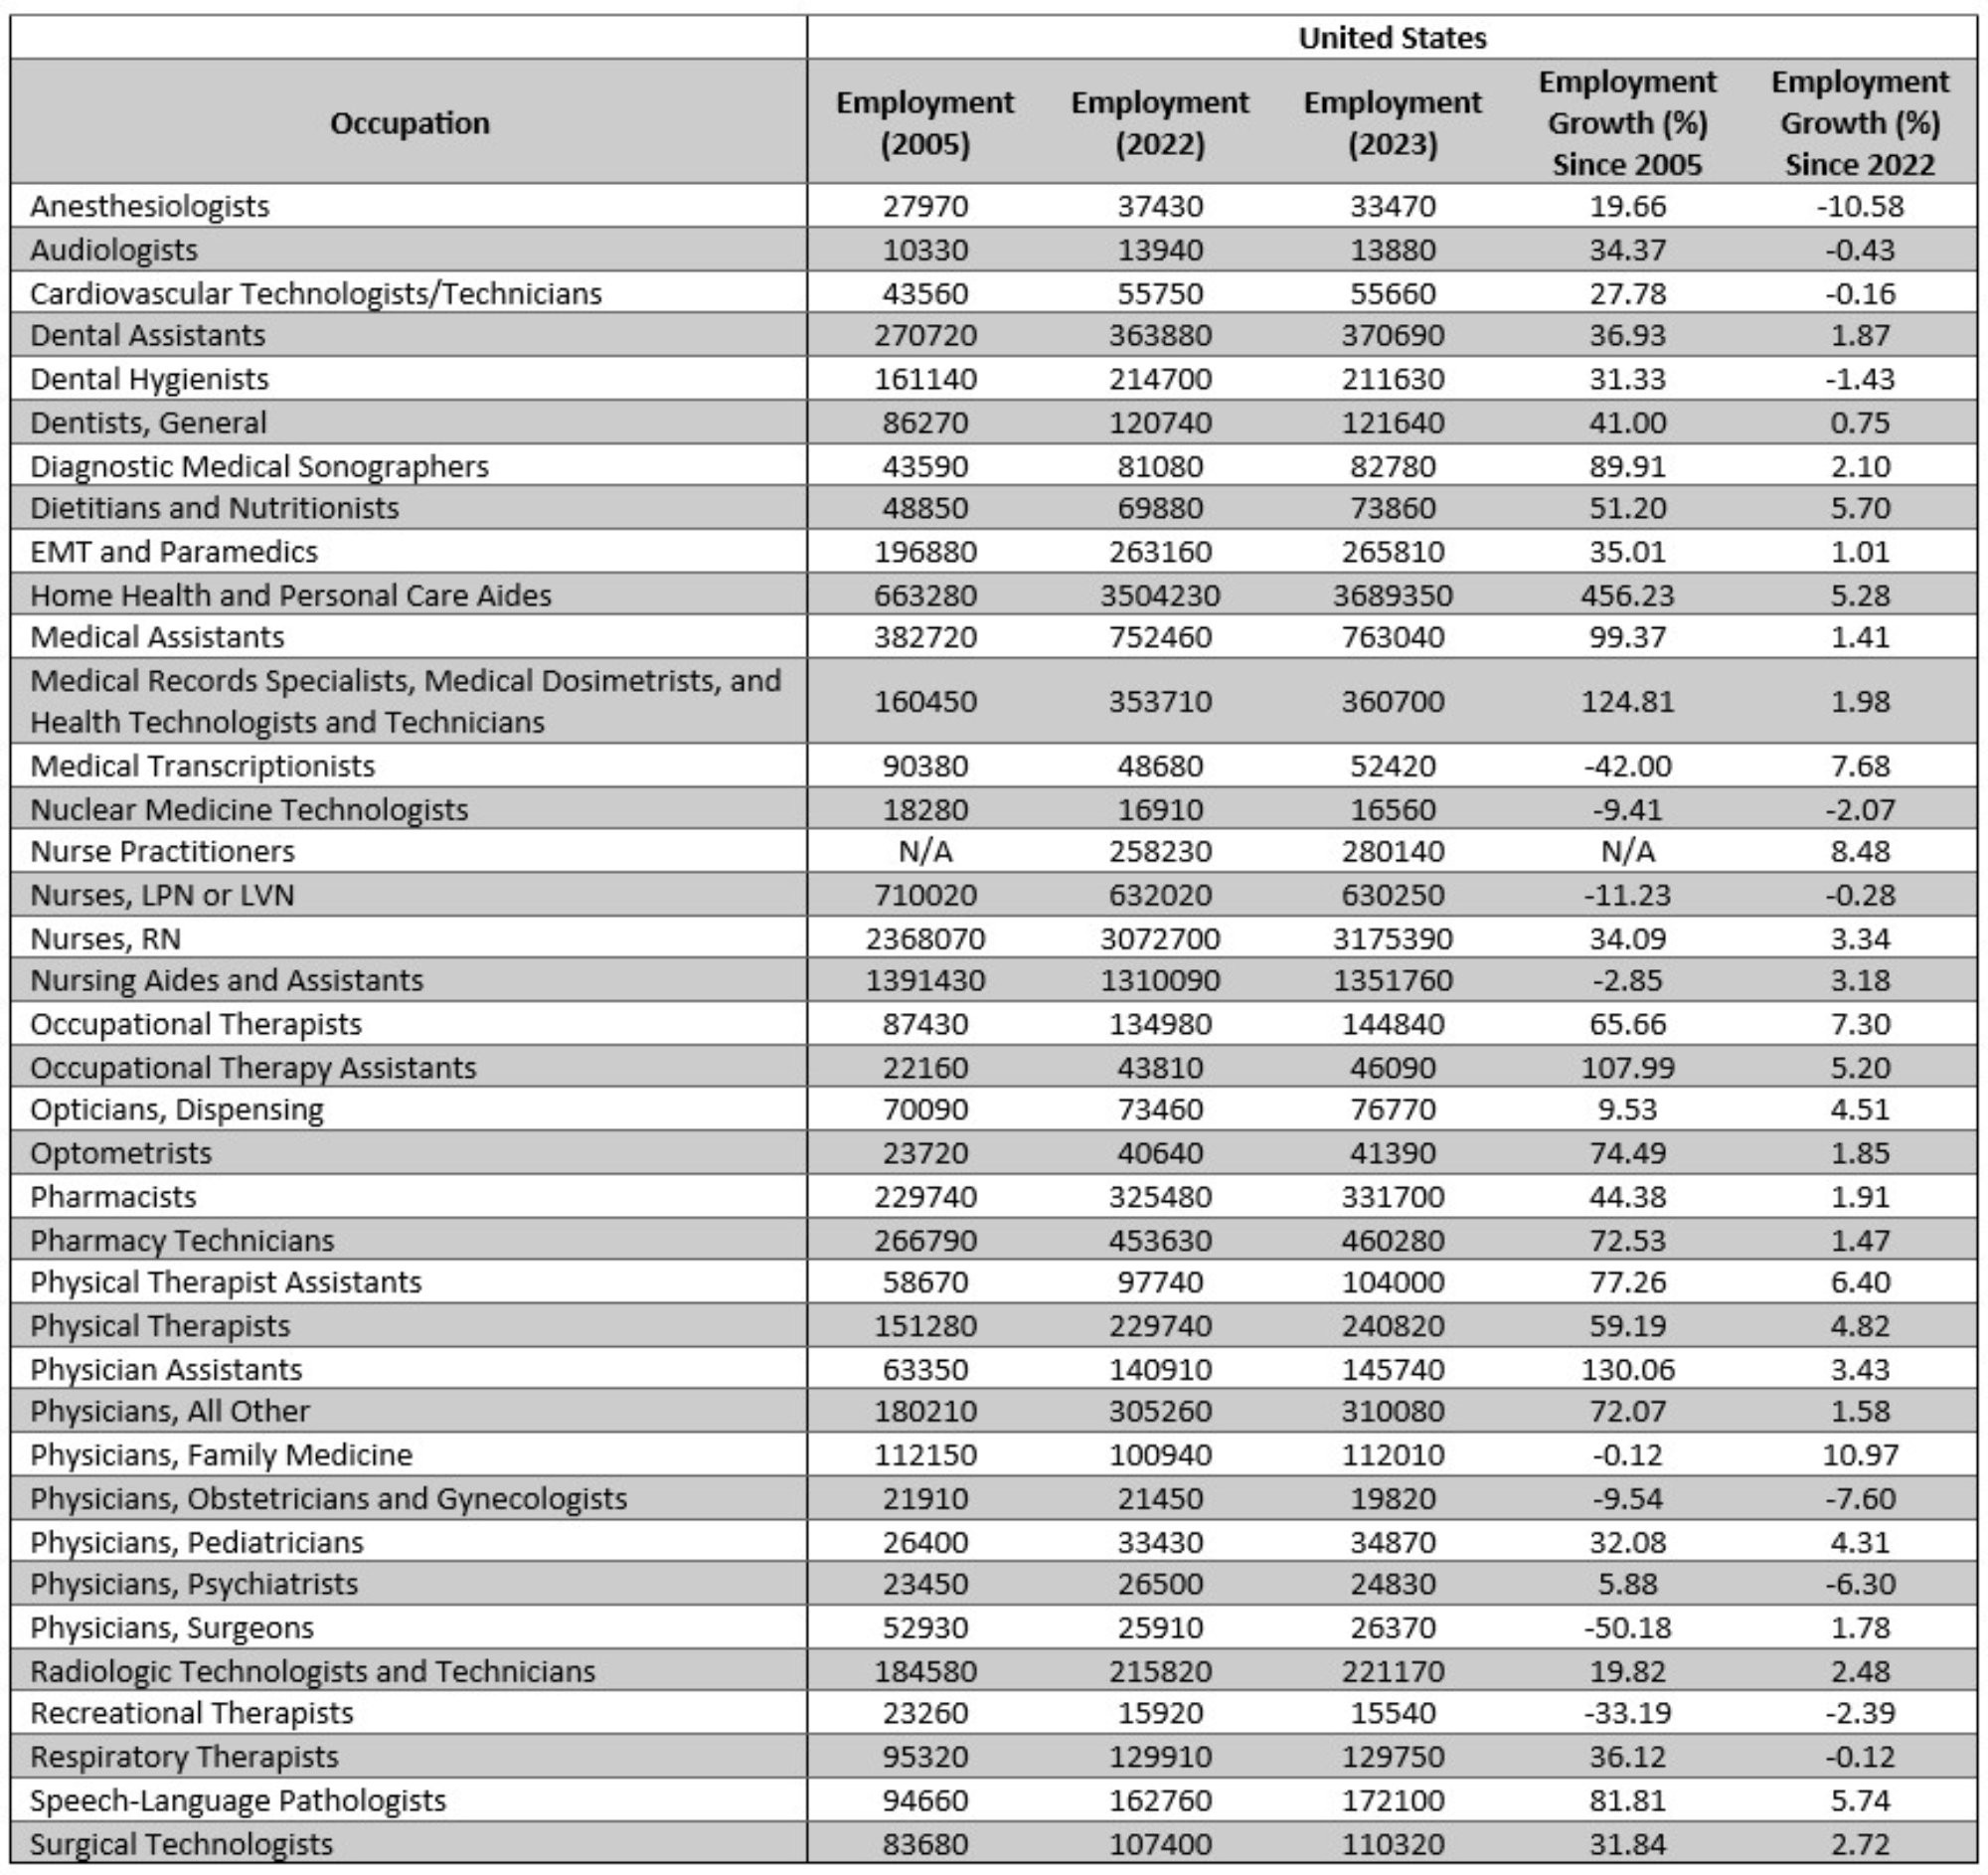
Description: Table 3 presents the employment numbers for select healthcare occupations in the United States from 2005 to 2023. It shows 29 select healthcare occupations have observed employment increases since 2005, but only 10 professions have experienced negative growth since 2022.
Sources: U.S. 2005: http://www.bls.gov/oes/2005/may/oes_nat.htm; U.S. 2022: http://www.bls.gov/oes/2022/may/oes_nat.htm; U.S. 2023: http://www.bls.gov/oes/2023/may/oes_nat.htm
Since 2005, Michigan has seen significant job growth among home health and personal care aides, pediatricians, physician assistants, diagnostic medical sonographers, medical records specialists, medical dosimetrists, health technologists and technicians, and dieticians and nutritionists. However, labor market contractions have occurred among surgeons, medical transcriptionists, audiologists, licensed practical nurses (LPN), nuclear medicine technologists, recreational therapists, nursing aides and assistants, and dentists.
Turning to the national level, the U.S. has observed significant job growth in the categories including home health and personal care aides, physician assistants, medical records specialists, medical dosimetrists, health technologists and technicians, occupational therapy assistants, medical assistants, diagnostic medical sonographers, and speech-language pathologists. However, mounting job losses at the national level persist in occupations such as surgeons, medical transcriptionists, recreational therapists, licensed practical or licensed vocational nurses (LPN or LVN), physicians, obstetricians, gynecologists, nuclear medicine technologists, and nursing aides and assistants.
When analyzing employment growth in the Grand Rapids healthcare sectors since 2022, many occupations are still processing the labor changes of the pandemic differently. For example, anesthesiologists, audiologists, recreational therapists, medical transcriptionists, dental hygienists, cardiovascular technicians, surgical technologists, and pediatricians are still undergoing job losses. However, recovery is well underway among occupations, including occupational therapy assistants, physical therapy assistants, family medicine physicians, occupational therapists, optometrists, all other physicians, diagnostic medical sonographers, and physical therapists.
Tables 4 through 6 present employment projections for Grand Rapids, Michigan, and the United States. These figures are generated by matching data on historical and projected employment levels from the Bureau of Labor Statistics (BLS) to estimates of employment growth rates from the Michigan Department of Technology, Management, and Budget. The left-handed columns in Tables 4 through 6 display the occupation-specific employment levels in 2023, the corresponding annualized average growth rates, and the projected employment numbers for 2030. Next, we convert the growth rates into annual job growth numbers to estimate the number of new positions opening up throughout the year and display the replacement rate to account for retirements and frictional labor market transfers. Lastly, we sum the number of new positions created throughout the year and the labor market replacements to determine the average number of job openings yearly. Again, jobs may open for two reasons: new positions are created, and replacements are made for retirements and market transitions.
Table 4 highlights the occupations for which we expect to see the highest average annual job openings in Grand Rapids. These occupations include home health and personal care aides (1,501), registered nurses (RN, 1,229), nursing aides and assistants (1,106), medical assistants (504), licensed practical nurses (LPN, 232), pharmacy technicians (179), dental assistants (140), and physical therapists (128). However, one occupational category appears oversaturated in Grand Rapids compared to the BLS’s projections, highlighting an anticipated contraction in the coming years. Currently, the number of locally employed pediatricians exceeds the BLS’s projection. If the employment estimates are anchored to the BLS projections, the number of employed pediatricians is expected to shrink by six in Grand Rapids.
Table 4: Need for Selected Professions in Grand Rapids
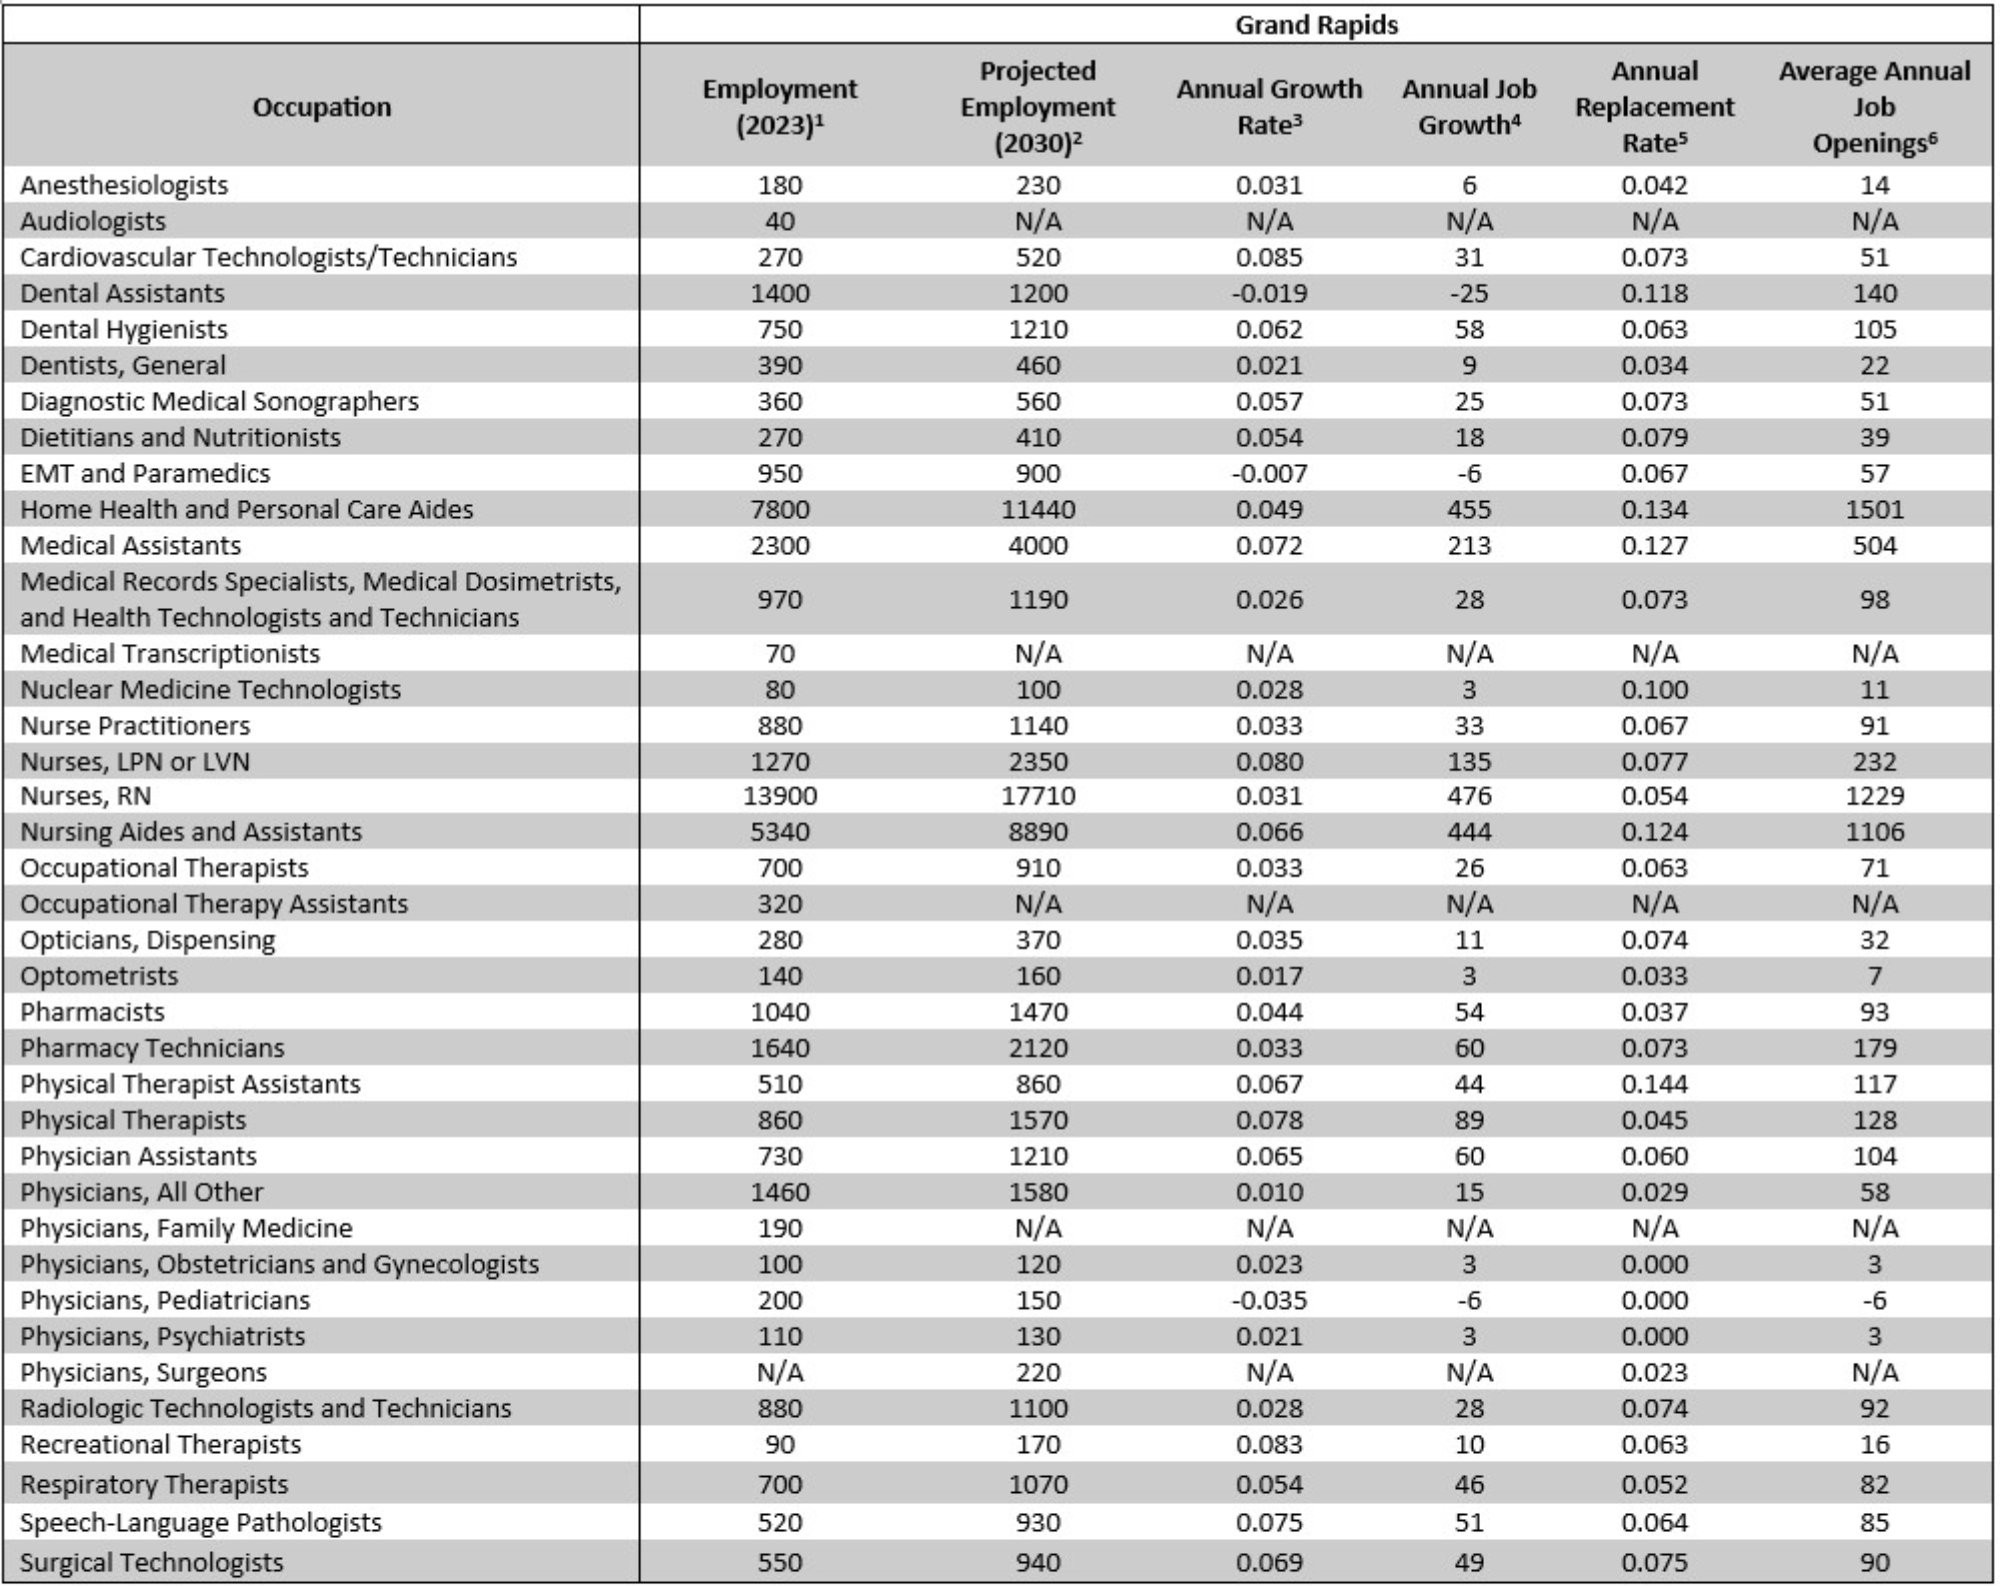
Description: Table 4 presents the estimates for average annual job openings for select healthcare occupations in Grand Rapids. It shows that all healthcare professions, except pediatricians, expect positive job growth in the coming year.
Sources: (1) GR 2023: http://www.bls.gov/oes/2023/may/oes_mi.htm; (2) GR 2030 Projections: https://milmi.org/DataSearch/Employment-Projections-Excel-Files (Michigan Regional Long-Term Employment Projections 2020-2030, West Michigan Propserity Region Occupational Projections); (3) Annual Growth Rate = [Employment (2030)/ Employment (2023)]^(1/(Years Until 2030))-1; (4) Annual Job Growth = (Employment (2030) –Employment (2023))/(Years Until 2030); (5) Annual Replacement Rate = Replacement/Employment (2023); (6) Average Annual Job Openings = Annual Job Growth + (Employment (2023) x Annual Replacement Rate)
Table 5 presents the average annual job openings for select healthcare occupations across Michigan. Many occupational categories are expected to expand across the state, including home health and personal care aides (12,132), nursing aides and assistants (6,754), registered nurses (RN, 6,574), medical assistants (3,528), licensed practical nurses (LPN, 1,226), pharmacy technicians (1,201), dental assistants (948), all other physicians (695), medical records specialists, medical dosimetrists, and health technologists (621). Additionally, Table 6 displays the expected yearly job openings for select healthcare occupations across the United States. Similarly, we expect home health and personal care aides (126,769), nursing aides (31,741), registered nurses (RN, 28,037), medical assistants (23,586), licensed practical or licensed vocational nurses (LPN or LVN, 22,167), all other physicians (17,122), physical therapists assistants (16,057), and occupational therapy assistants (14,694) to experience the most significant increase in job openings nationally.
Table 5: Need for Selected Professions in Michigan
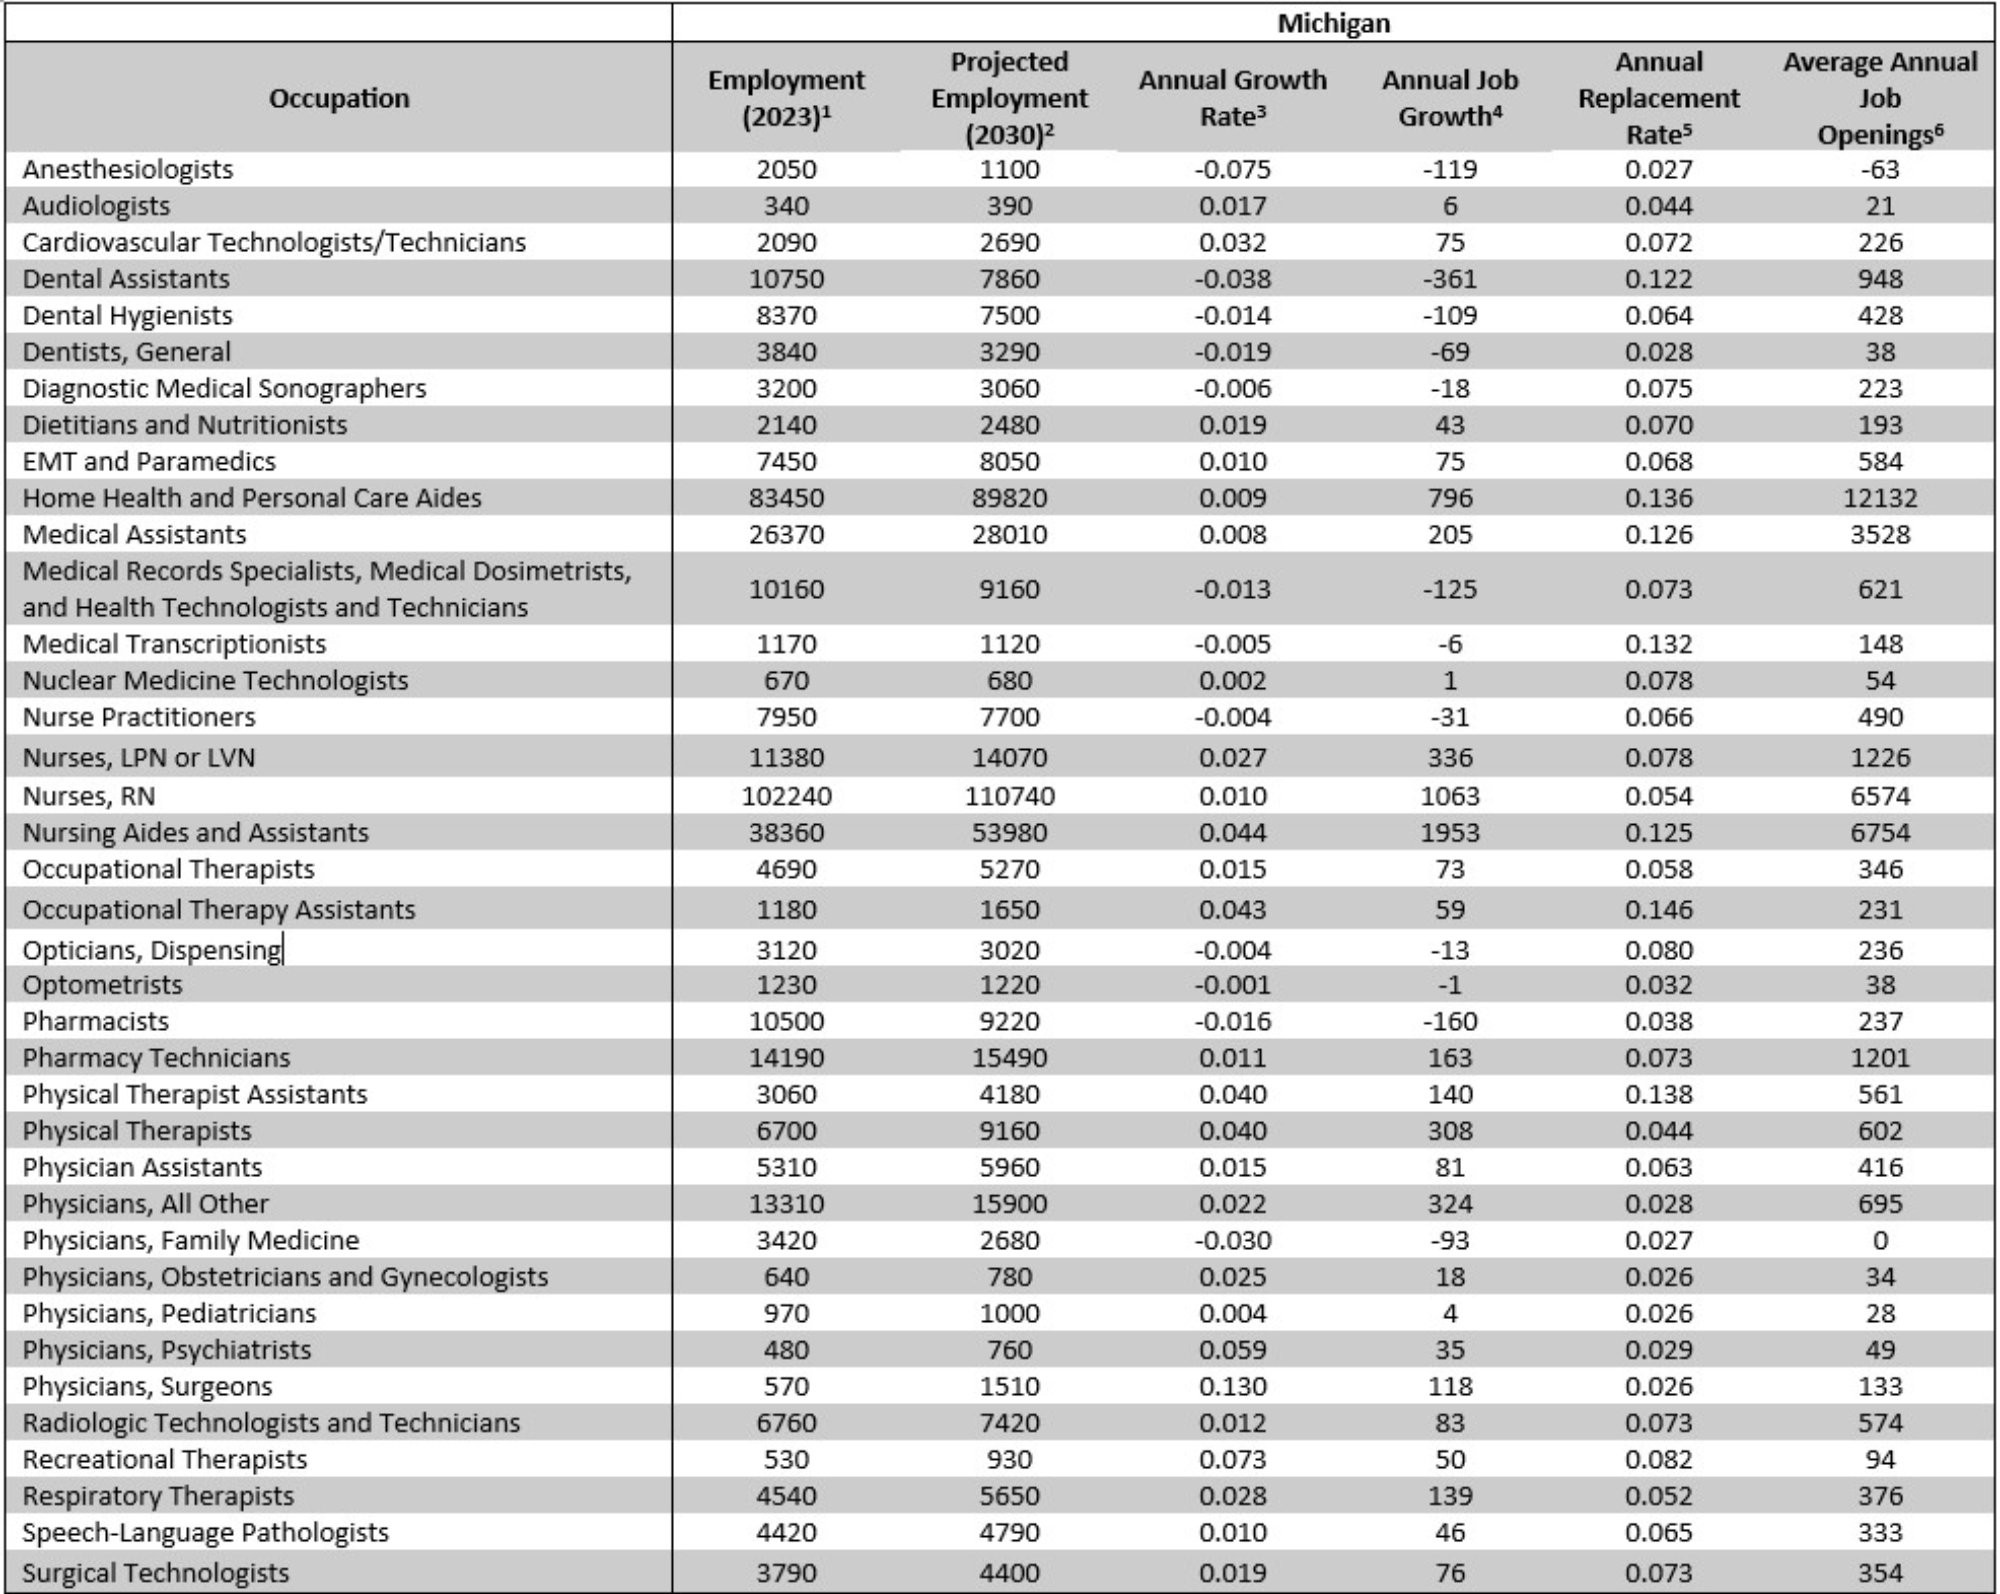
Description: Table 5 presents the estimates for average annual job openings for select healthcare occupations in Michigan. It shows that all healthcare professions, except anesthesiologists, expect positive job growth in the coming year.
Sources: (1) MI 2023: http://www.bls.gov/oes/2023/may/oes_mi.htm; (2) MI 2030 Projections: https://milmi.org/DataSearch/Employment-Projections-Excel-Files (Statewide Long-Term Employment Projections 2020-2030, Region Occupational Projections); (3) Annual Growth Rate = [Employment (2030)/ Employment (2023)]^(1/(Years Until 2030))-1; (4) Annual Job Growth = (Employment (2030) –Employment (2023))/(Years Until 2030); (5) Annual Replacement Rate = Replacement/Employment (2023); (6) Average Annual Job Openings = Annual Job Growth + (Employment (2023) x Annual Replacement Rate)
Table 6: Need for Selected Professions in the United States
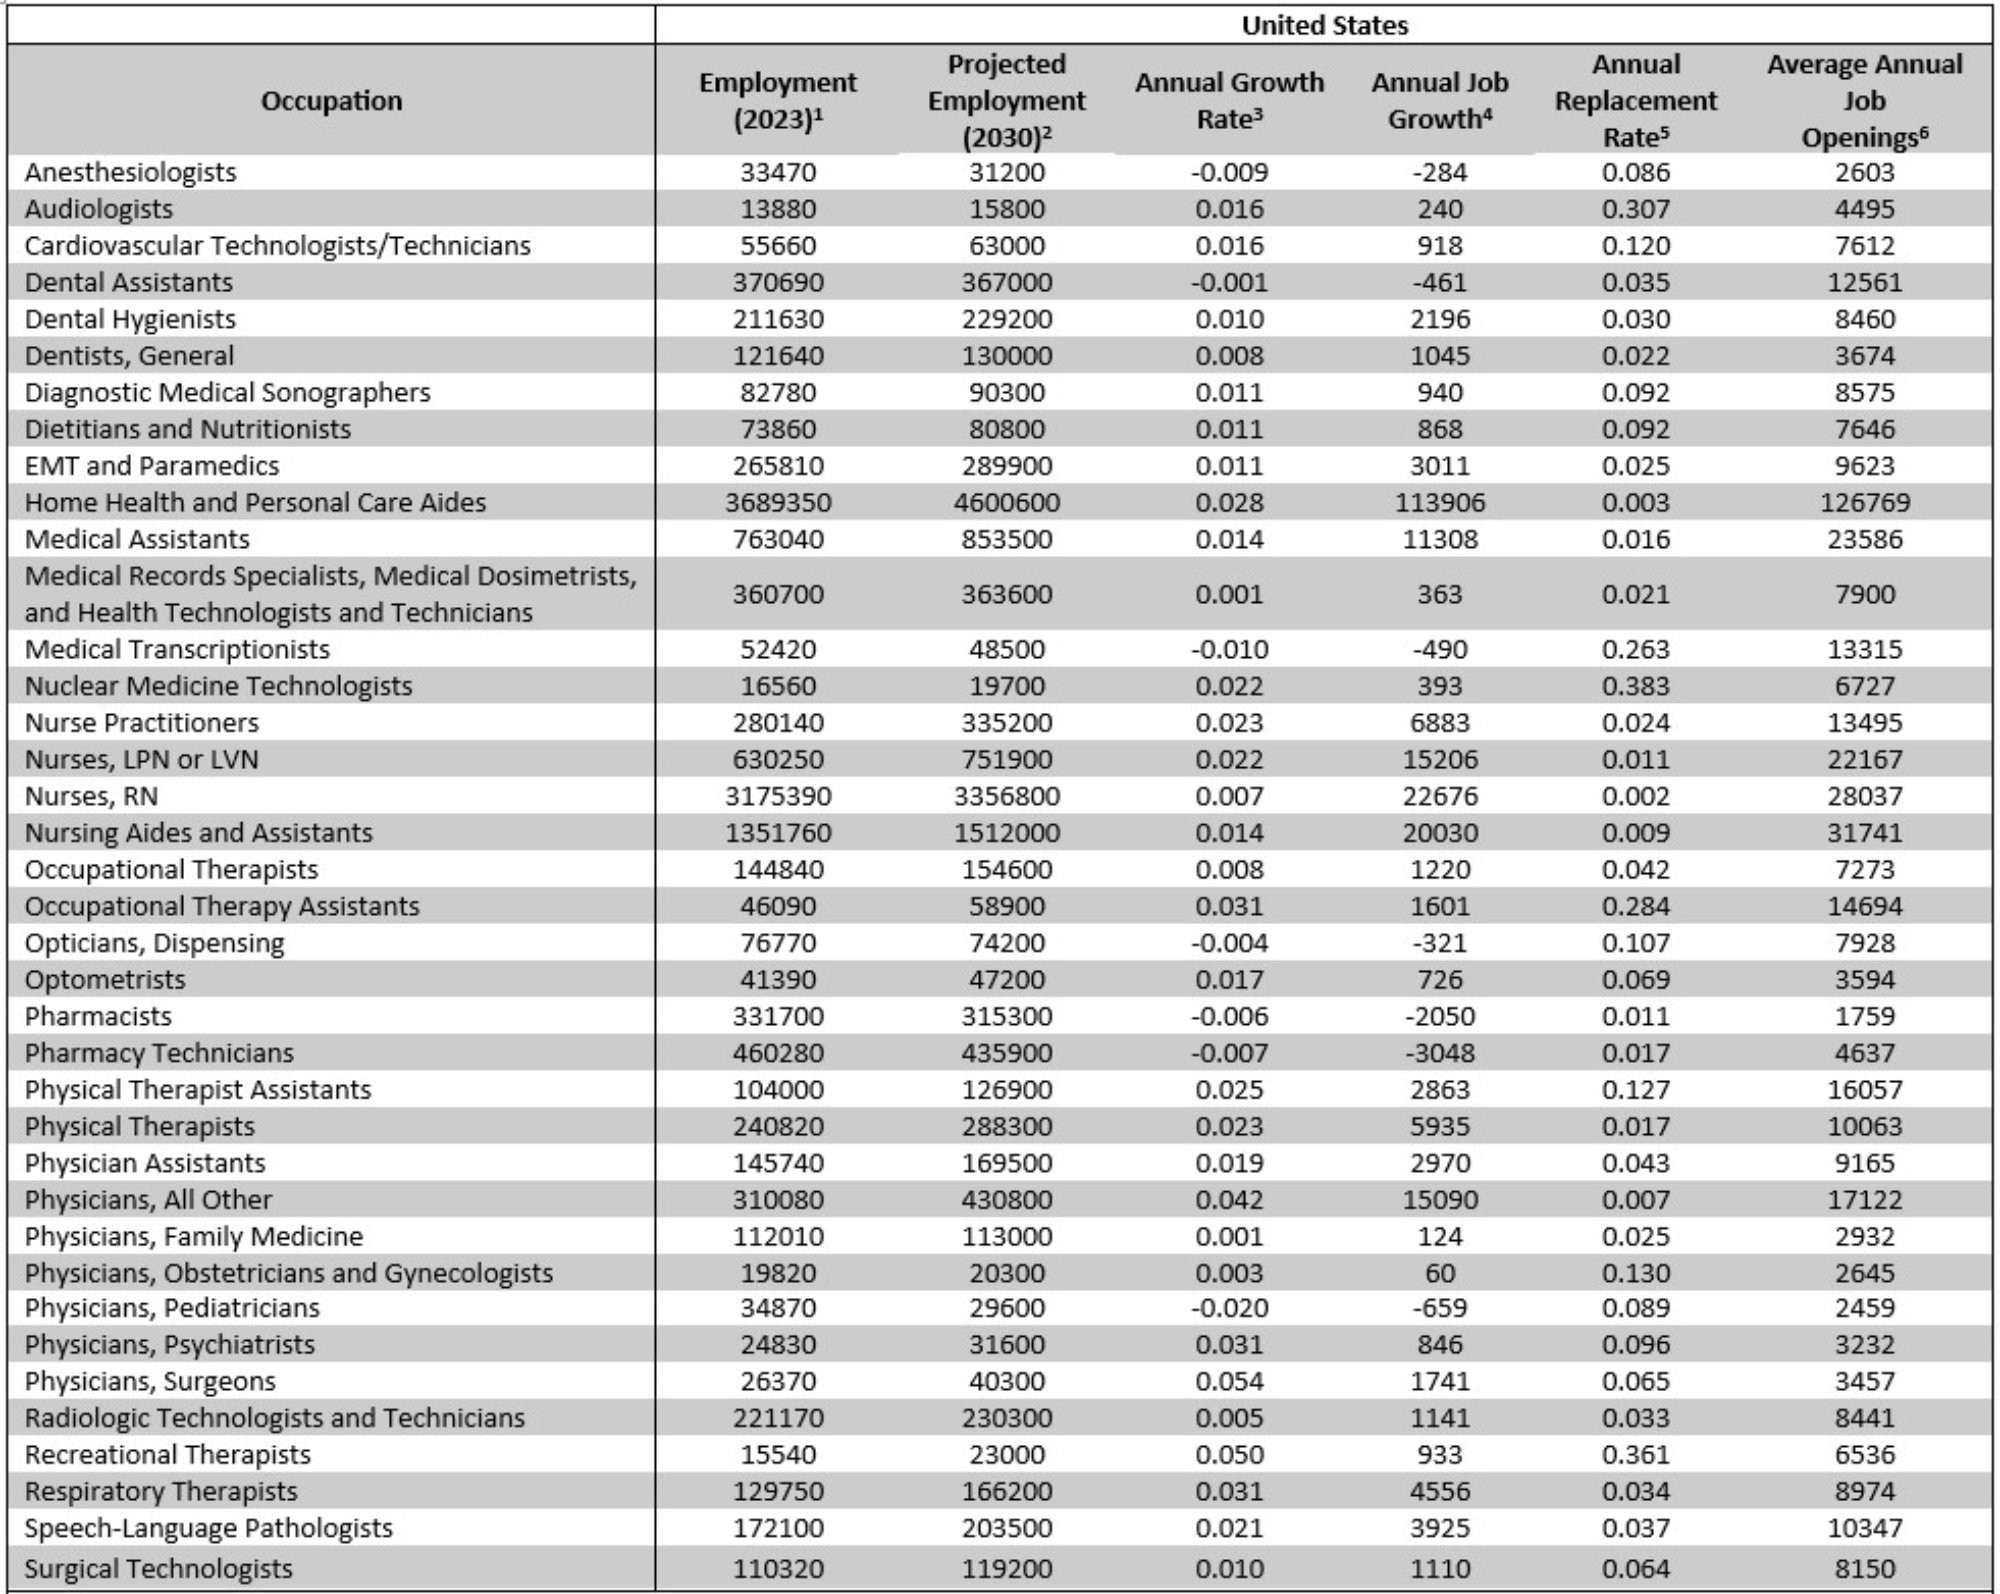
Description: Table 6 presents the estimates for average annual job openings for select healthcare occupations in the United States. It shows that all healthcare professions expect positive job growth in the coming year.
Sources: (1) U.S. 2023: http://www.bls.gov/oes/2023/may/oes_nat.htm; (2) U.S. 2030 Projections: Employment Projections Databases: U.S. Bureau of Labor Statistics (bls.gov) (Employment Projections 2020-2030, Acquired though BLS Correspondence – Available Upon Request); (3) Annual Growth Rate = [Employment (2030)/ Employment (2023)]^(1/(Years Until 2030))-1; (4) Annual Job Growth = (Employment (2030) –Employment (2023))/(Years Until 2030); (5) Annual Replacement Rate = Replacement/Employment (2023); (6) Average Annual Job Openings = Annual Job Growth + (Employment (2023) x Annual Replacement Rate)
Finally, Table 7 presents the inflation-adjusted average annual earnings for select health professions in Grand Rapids, Michigan, and the U.S. Once we derive the inflation-adjusted earnings metric for each occupation, Table 8 reports the short-term and long-term growth rates in real earnings from 2005 and 2023, respectively. Again, the wage data is retrieved from the Bureau of Labor Statistics (BLS). We highlight the occupations for which real earnings have increased or decreased by more than 7 percent during these two periods. Since 2005, Grand Rapids healthcare occupations with the largest decline in real earnings include family medicine physicians (-36 percent), speech-language pathologists (-31 percent), physicians, obstetricians, and gynecologists (-22 percent), medical transcriptionists (-22 percent), opticians (-21 percent), respiratory therapists (-20 percent), recreational therapists (-15 percent), and occupational therapists (-14 percent). Meanwhile, occupational categories with the largest increase in real earnings include medical records specialists, medical dosimetrists, health technologists (23 percent), physical therapist assistants (22 percent), occupational therapy assistants (19 percent), nursing aides and assistants (10 percent), audiologists (8 percent), and licensed practical nurses (LPN, 7 percent).
Table 7: Average Annual Earnings for Select Health Care Professions
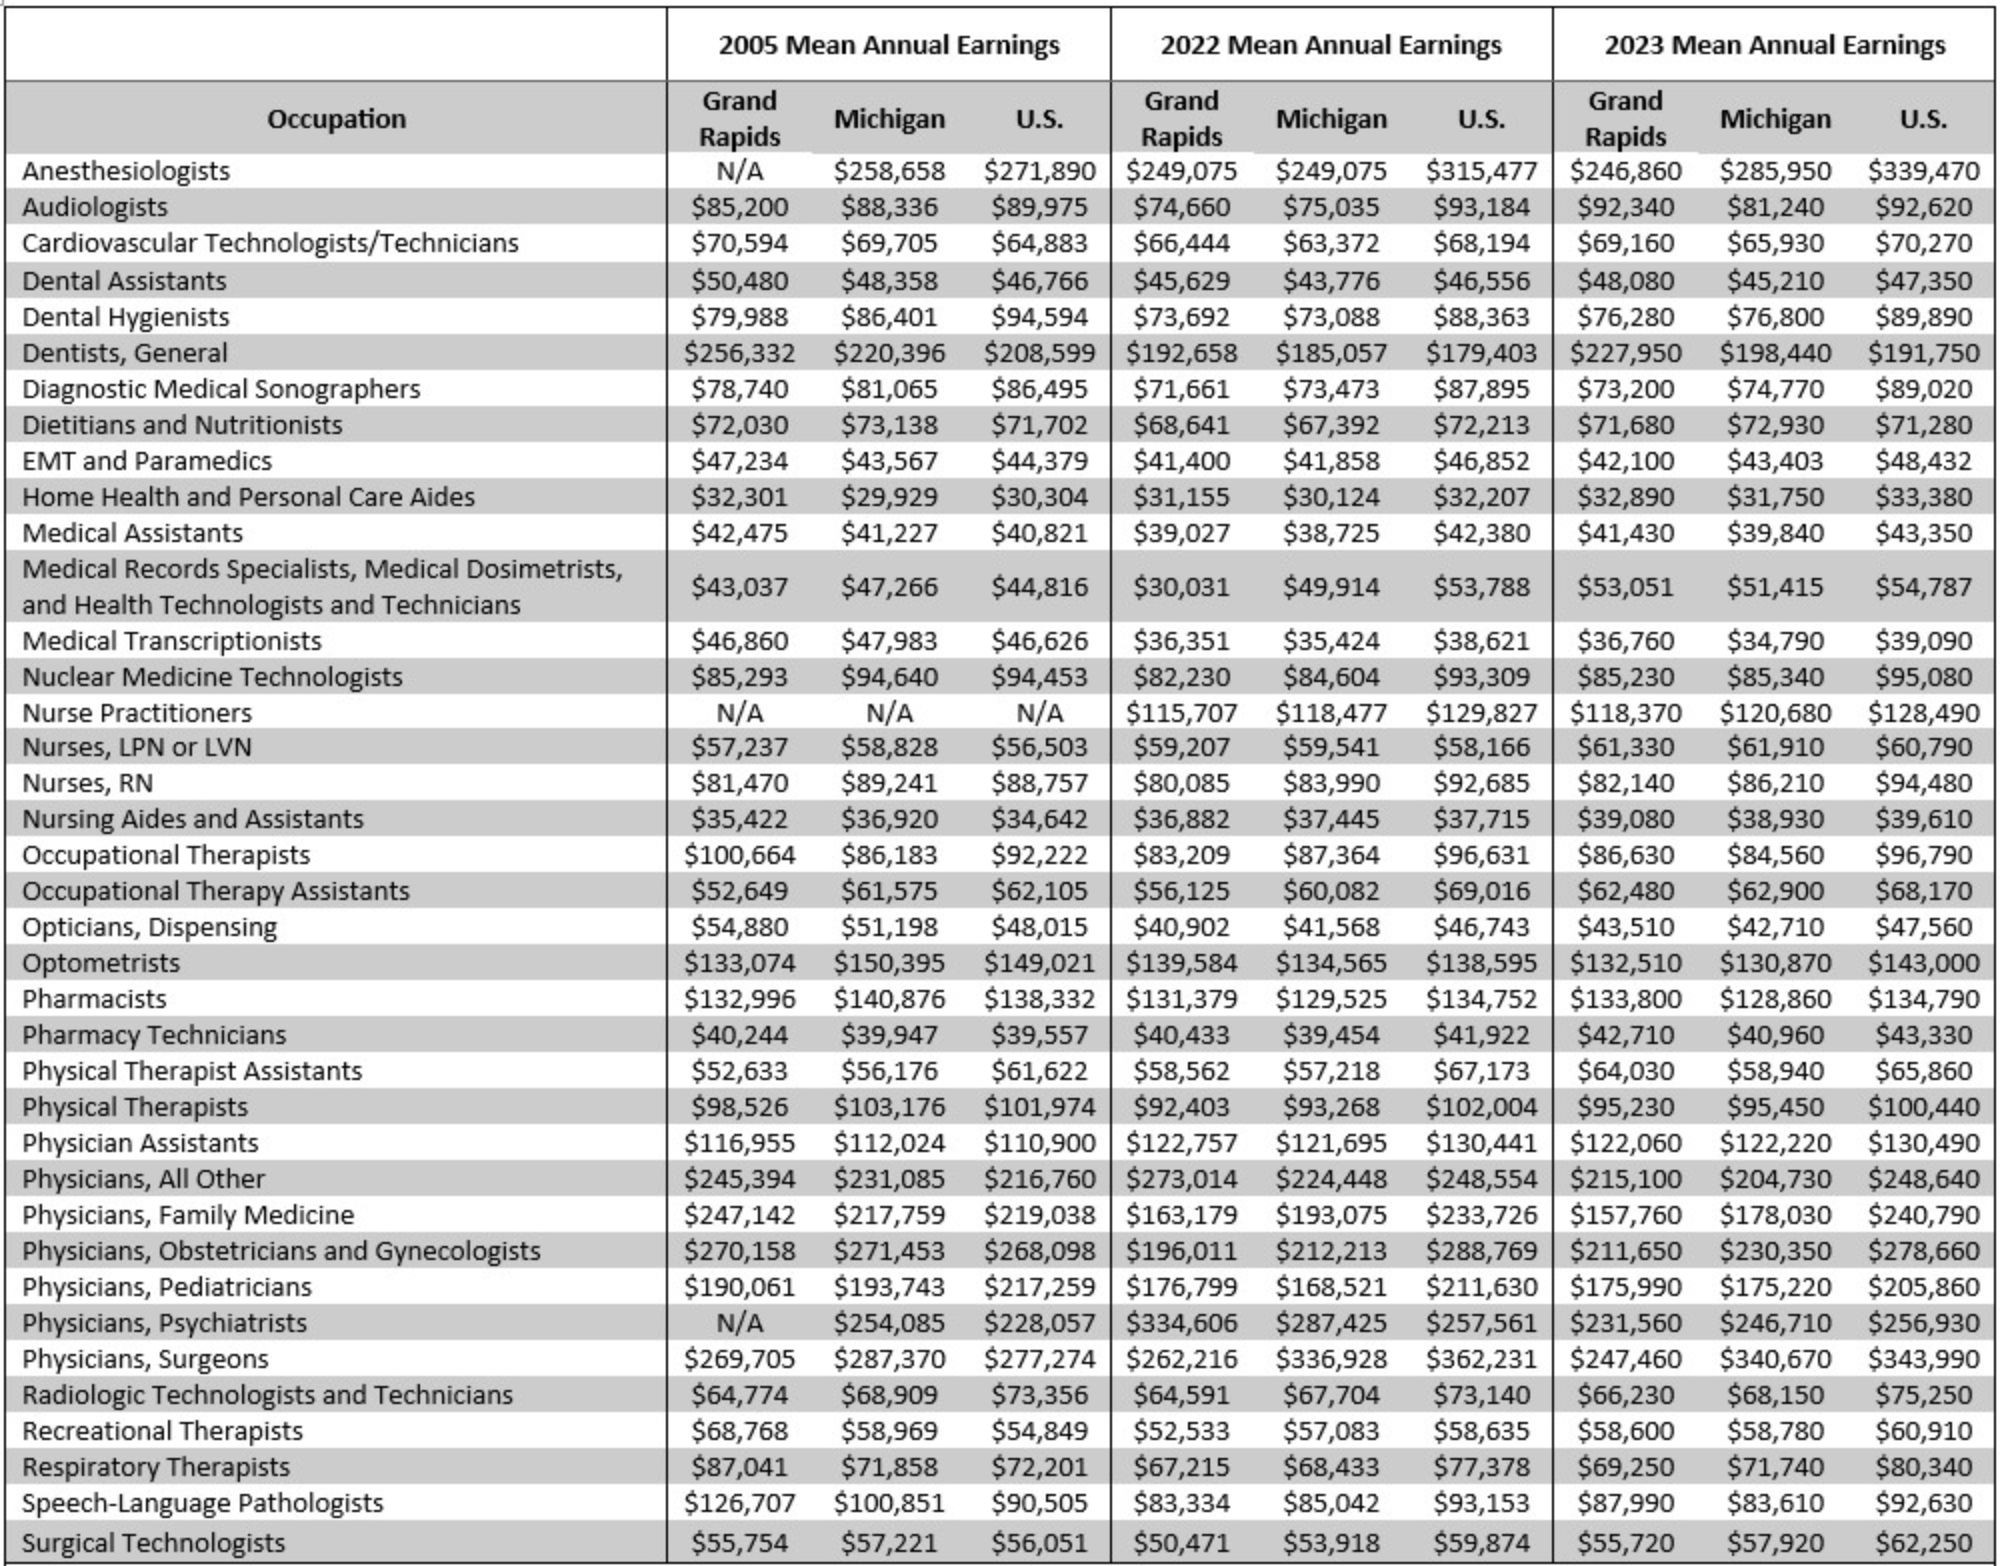
Description: Table 7 presents the inflation-adjusted average annual earnings for select healthcare occupations in Grand Rapids, Michigan, and the United States. It shows that inflation-adjusted wages have increased in Grand Rapids more than in Michigan and the United States since 2005 and 2022, respectively.
Sources: GR 2005: http://www.bls.gov/oes/2005/may/oes_24340.htm; GR 2022: http://www.bls.gov/oes/2022/may/oes_24340.htm; GR 2023: http://www.bls.gov/oes/2023/may/oes_24340.htm; MI 2005: http://www.bls.gov/oes/2005/may/oes_mi.htm; MI 2022: http://www.bls.gov/oes/2022/may/oes_mi.htm; MI 2023: http://www.bls.gov/oes/2023/may/oes_mi.htm; U.S. 2005: http://www.bls.gov/oes/2005/may/oes_nat.htm; U.S. 2022: http://www.bls.gov/oes/2022/may/oes_nat.htm; U.S. 2023: http://www.bls.gov/oes/2023/may/oes_nat.htm
Table 8: Percent Change in Average Annual Earnings for Select Health Care Professions
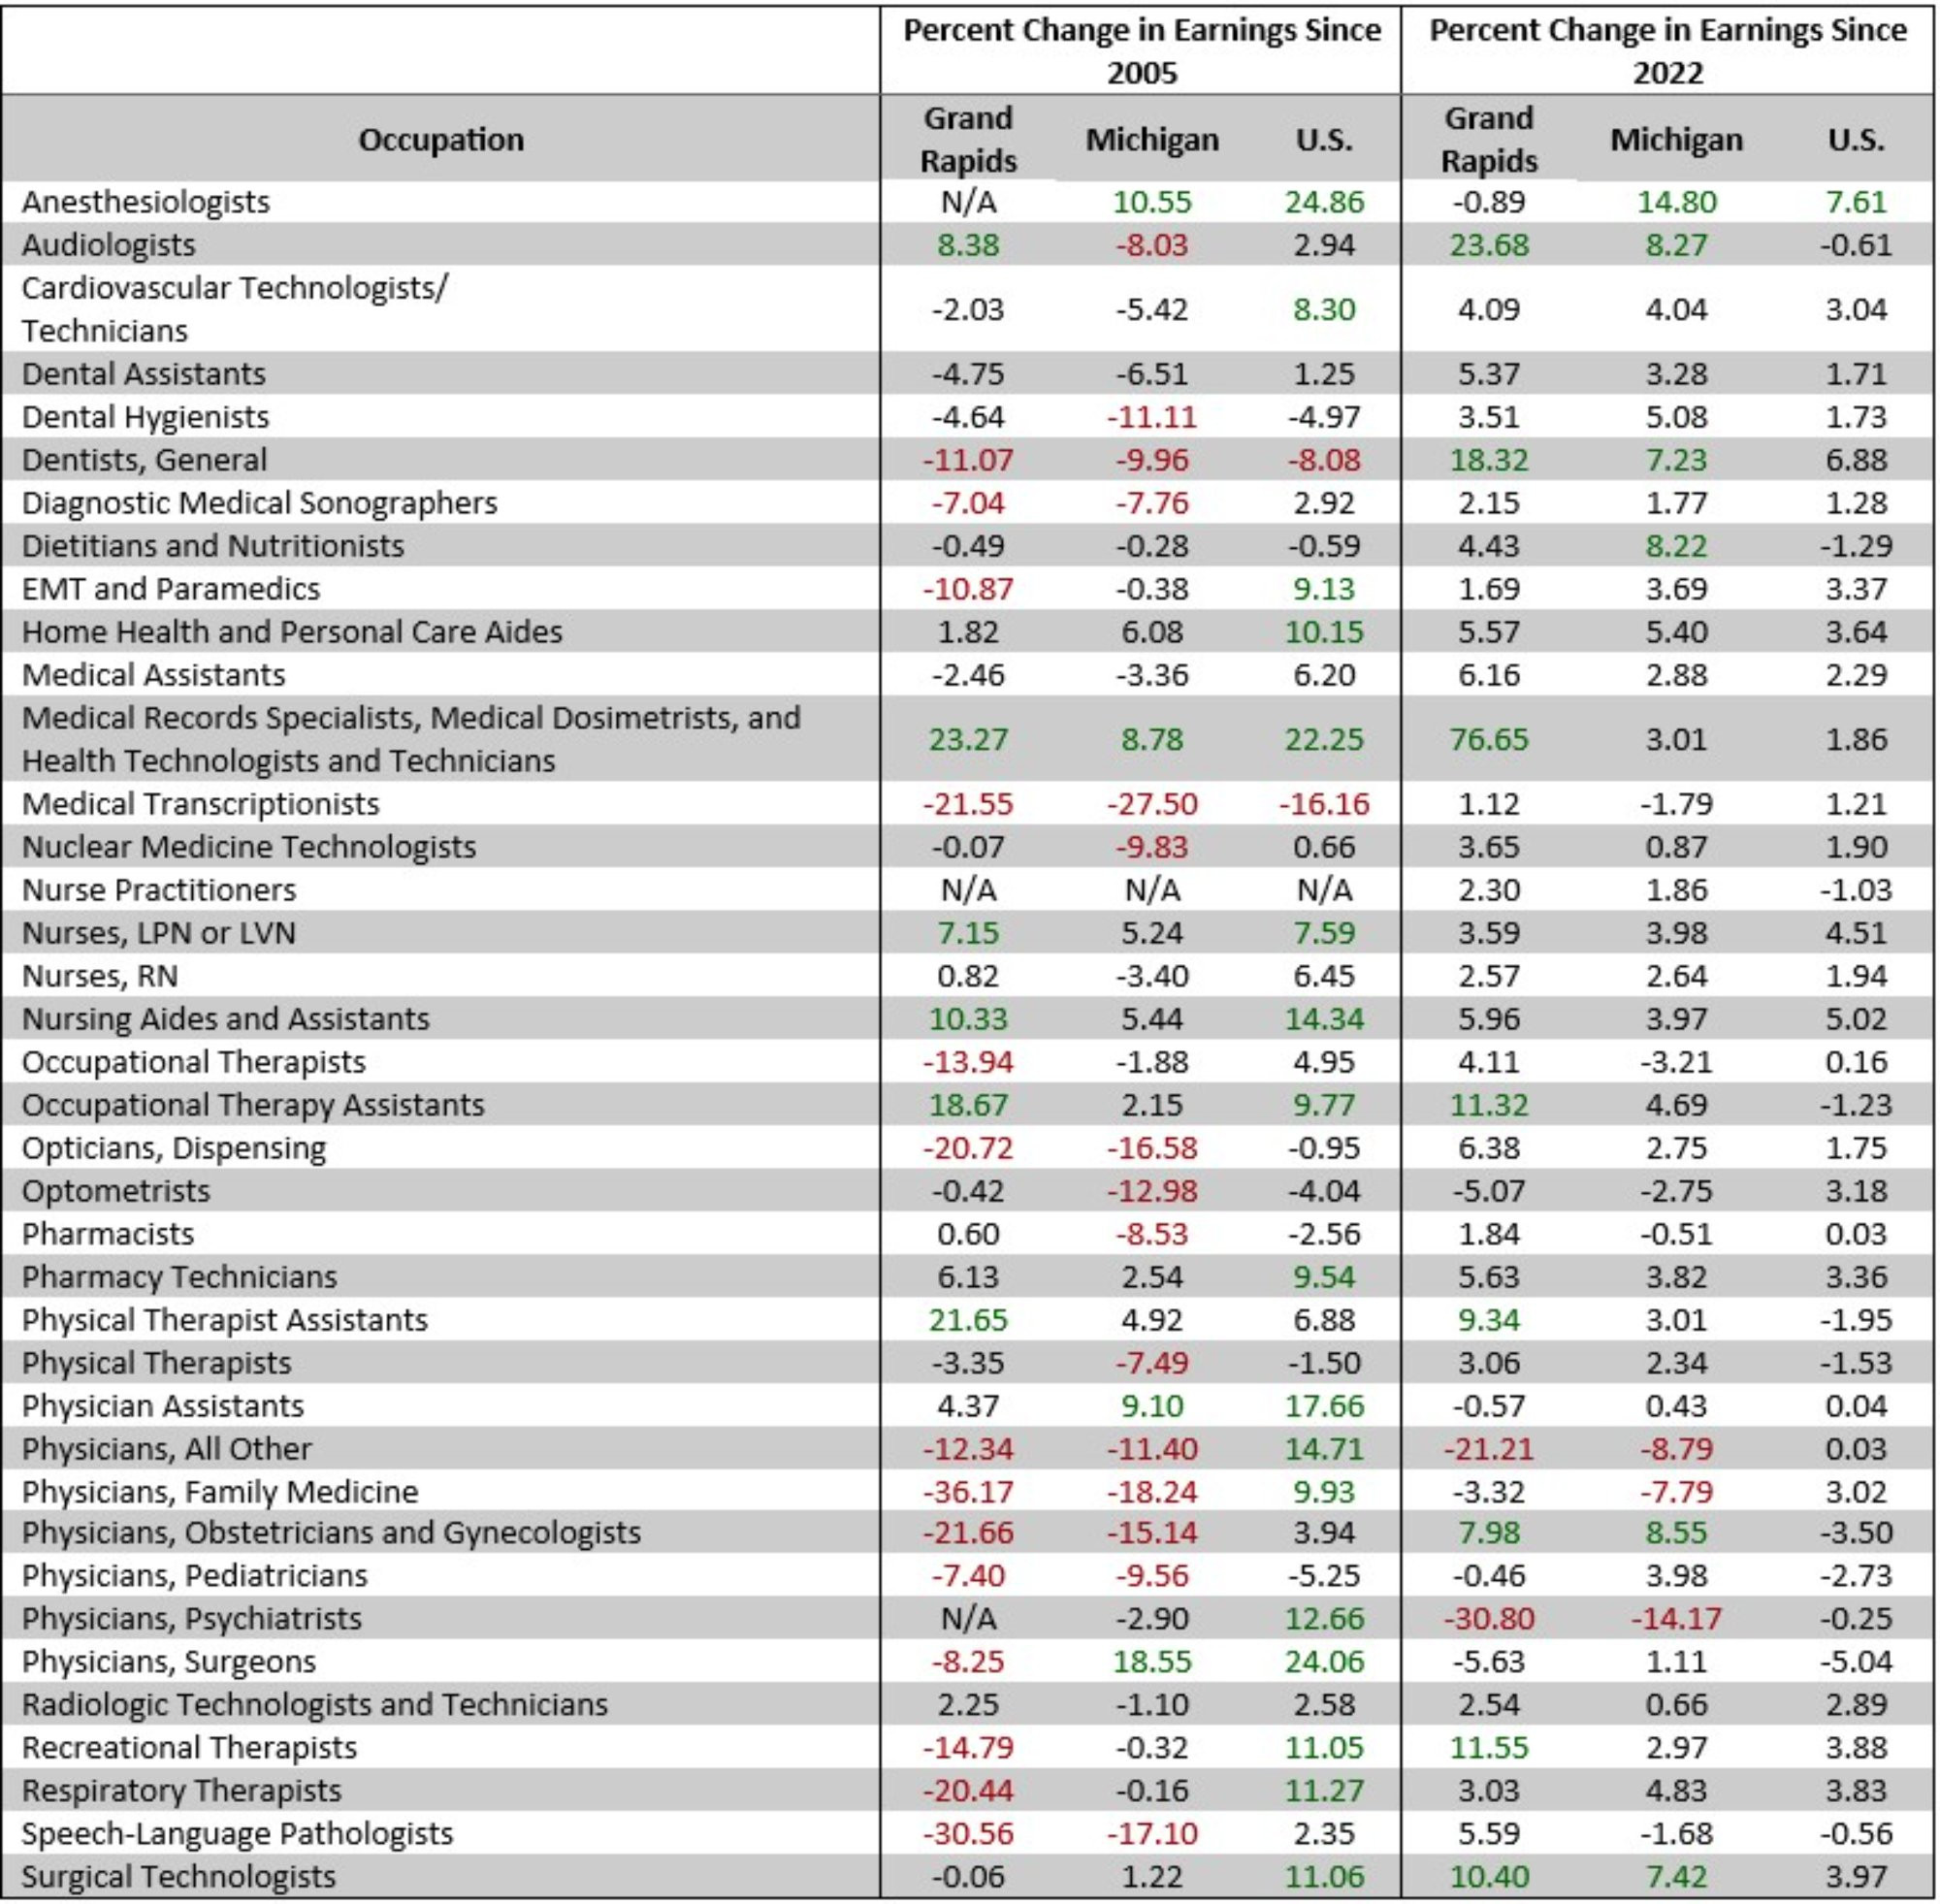
Description: Table 8 presents the percent change in inflation-adjusted earnings for select healthcare occupations in Grand Rapids, Michigan, and the United States. It shows that, on average, inflation-adjusted wages have increased in Grand Rapids more than in Michigan and the United States since 2005 and 2022, respectively.
Sources: GR 2005: http://www.bls.gov/oes/2005/may/oes_24340.htm; GR 2022: http://www.bls.gov/oes/2022/may/oes_24340.htm; GR 2023: http://www.bls.gov/oes/2023/may/oes_24340.htm; MI 2005: http://www.bls.gov/oes/2005/may/oes_mi.htm; MI 2022: http://www.bls.gov/oes/2022/may/oes_mi.htm; MI 2023: http://www.bls.gov/oes/2023/may/oes_mi.htm; U.S. 2005: http://www.bls.gov/oes/2005/may/oes_nat.htm; U.S. 2022: http://www.bls.gov/oes/2022/may/oes_nat.htm; U.S. 2023: http://www.bls.gov/oes/2023/may/oes_nat.htm
Several differences were highlighted when we compared the earnings changes in Grand Rapids to those in Michigan and the entire U.S. For example, the real earnings of Michigan optometrists (-13 percent) and dental hygienists (-11 percent) exhibited an exaggerated decline when compared to the local and national earnings estimates since 2005. Additionally, the real earnings of physician assistants across the state (9 percent) and nation (18 percent) have surpassed the local (4 percent) increase. A notable divergence occurs when we analyze the long-term changes in the real earnings of local surgeons. For instance, the real earnings of Michigan and U.S. based surgeons have burgeoned by 19 percent and 24 percent since 2005. However, during the same period, real surgeon wages in Grand Rapids fell by 8 percent.
Turning to short-run changes in real wages between 2022 and 2023, a few local occupations have observed a greater than 7 percent decline in real earnings, including psychiatrists (-31 percent) and all other physicians (-21 percent). However, many local occupations have observed real wage increases exceeding 7 percent, including medical records specialists, medical dosimetrists, health technologists (77 percent), audiologists (24 percent), dentists (18 percent), recreational therapists (12 percent), occupational therapy assistants (11 percent), surgical technologists (10 percent), physical therapy assistants (9 percent), and physicians, obstetricians, and gynecologists (8 percent). Additionally, these local occupations have outpaced the short-run real earnings estimates observed statewide and nationwide. While dentists (-11 percent) and recreational therapists (-15 percent) in Grand Rapids have observed sizeable real wage losses over the long run, a notable rebound appears underway with a short-run increase of 18 percent and 12 percent, respectively. Lastly, the local increase in real earnings for medical records specialists, medical dosimetrists, and health technologists (77 percent) far exceeds the estimates observed at the state (3 percent) and national (2 percent) levels.
We emphasize that any estimates presented in this section are subject to change based on new economic developments or changes in the regulatory environment that govern healthcare providers and their operations. However, we note that the reshuffling from low to high-return degrees should increase the pool of qualified new entrants and help alleviate some labor market concerns. Additionally, policy and community efforts will be vital to retain the current skilled healthcare workforce and encourage talented individuals to pursue degrees leading to employment within the healthcare sector.