Demographic Changes
By Cody Kirby, Ph.D., Visiting Faculty, Department of Economics, Seidman College of Business, Grand Valley State University
Demographic changes have significant effects on the utilization of health care services. We continue to monitor two key trends: continued population growth on the west side of the state and an increase in the population’s average age. Because older individuals tend to have more healthcare needs than younger persons, an aging population can increase healthcare utilization and, as a result, increase healthcare expenditures. Additionally, as previously noted, geographic shifts in the population distribution from east to west can affect the demand for healthcare and the resources needed to treat in each region.
Population Growth
Figure 1 displays population growth rates for KOMA (Kent, Ottawa, Muskegon, and Allegan counties), Detroit (Oakland, Macomb, and Wayne counties), the state of Michigan, and the entire U.S. Throughout the 1990s, KOMA’s population growth rate was larger than the growth rate observed in the Detroit region, the state of Michigan, and the U.S. as a whole. However, during the Great Recession, growth rates for both KOMA and Detroit fell drastically. Though KOMA maintained positive population growth throughout the 2000s, except for the latter stages of the Great Recession, the Detroit region experienced population loss beginning in the early 2000s that lasted for roughly a decade. Reversing course, the Detroit region achieved positive population growth throughout the 2010s, with its most significant spike in 2020, only to turn negative over the last few years. During the same period, KOMA continued to maintain positive population growth.
Figure 1: Annual Population Growth Rate, 1991-2023
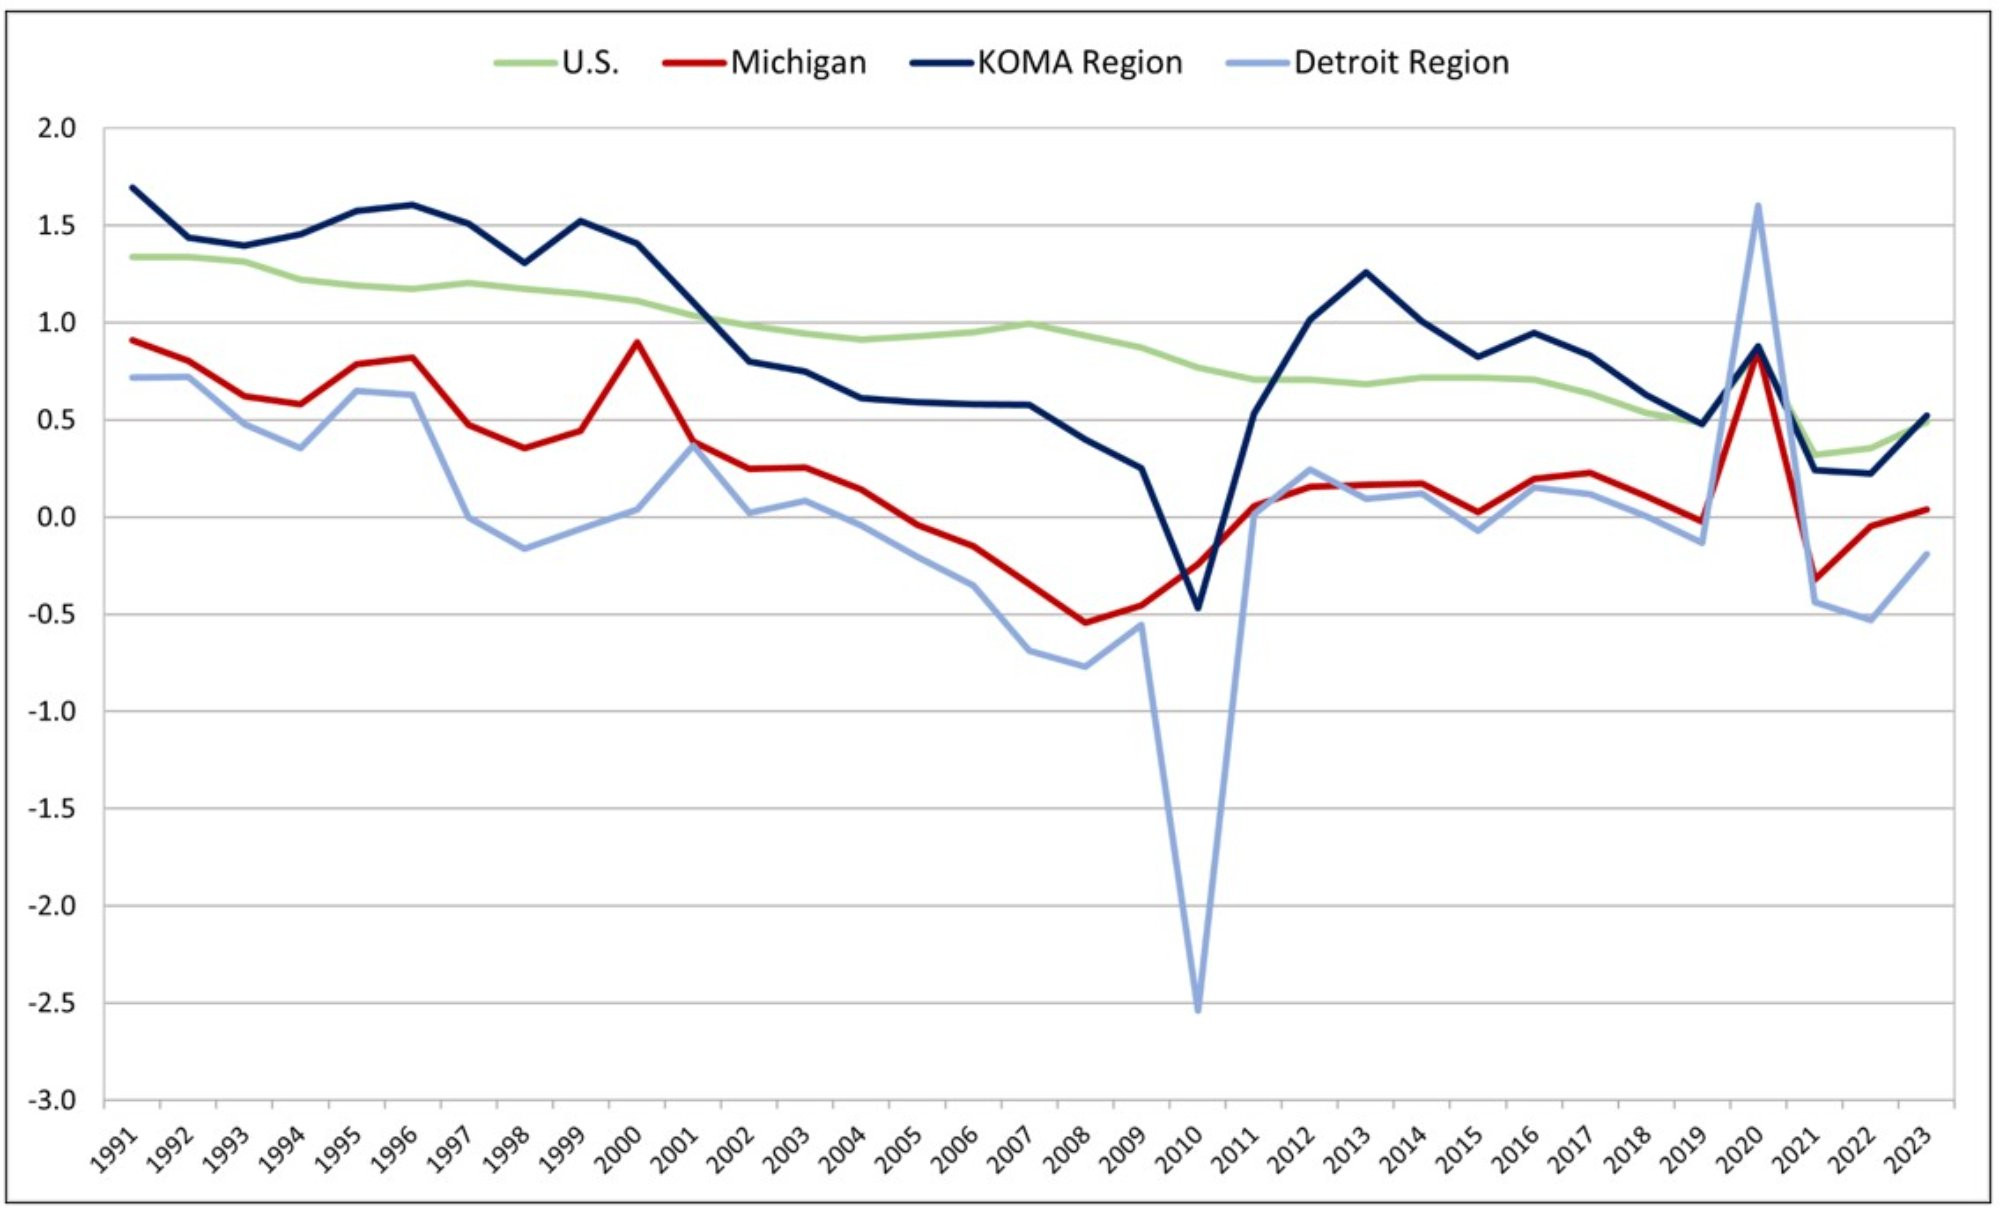
Description: Figure 1 displays the annual population growth rates for KOMA (Kent, Ottawa, Muskegon, and Allegan counties), Detroit (Oakland, Macomb, and Wayne counties), Michigan, and the U.S. It shows persistent population growth in West Michigan relative to continued weak or negative growth in East Michigan highlighting a migration from East to West Michigan.
Source: U.S. Census, Population and Housing Unit Estimates.
KOMA’s population growth rate burgeoned post-2010 and, by 2012, outpaced the growth rates observed in Detroit, the state, and the nation. Over the past decade, the positive population growth in West Michigan has continued, but at a slower pace, with growth rates falling from 1.3 percent in 2013 to 0.5 percent in 2023. While the population growth rate in West Michigan appears to be slowing in the latter years, KOMA’s population growth between 2012 through 2020 continued to surpass that of Detroit, illustrating a continued shift in population density from East Michigan to West Michigan. Continuing this trend will result in higher healthcare demand and the need for additional resources to provide patient care. For example, while the share of total state Medicare expenditures fell in KOMA and Detroit between 2010 and 2014, the relative decline was more than 20 times larger for East Michigan (Centers for Medicare and Medicaid Services, 2022). Post the Detroit population spike of 2020, the divergence between the state’s east and west has continued, with population growth rates turning negative in the Detroit and positive in KOMA.
In summary, we note declining population growth rates across KOMA, Detroit, Michigan, and the U.S. On average, regardless of geography, the population growth rate has declined by roughly 1 present since 1990. Lastly, we continue to find evidence of a population redistribution from East to West Michigan.
Age Distribution
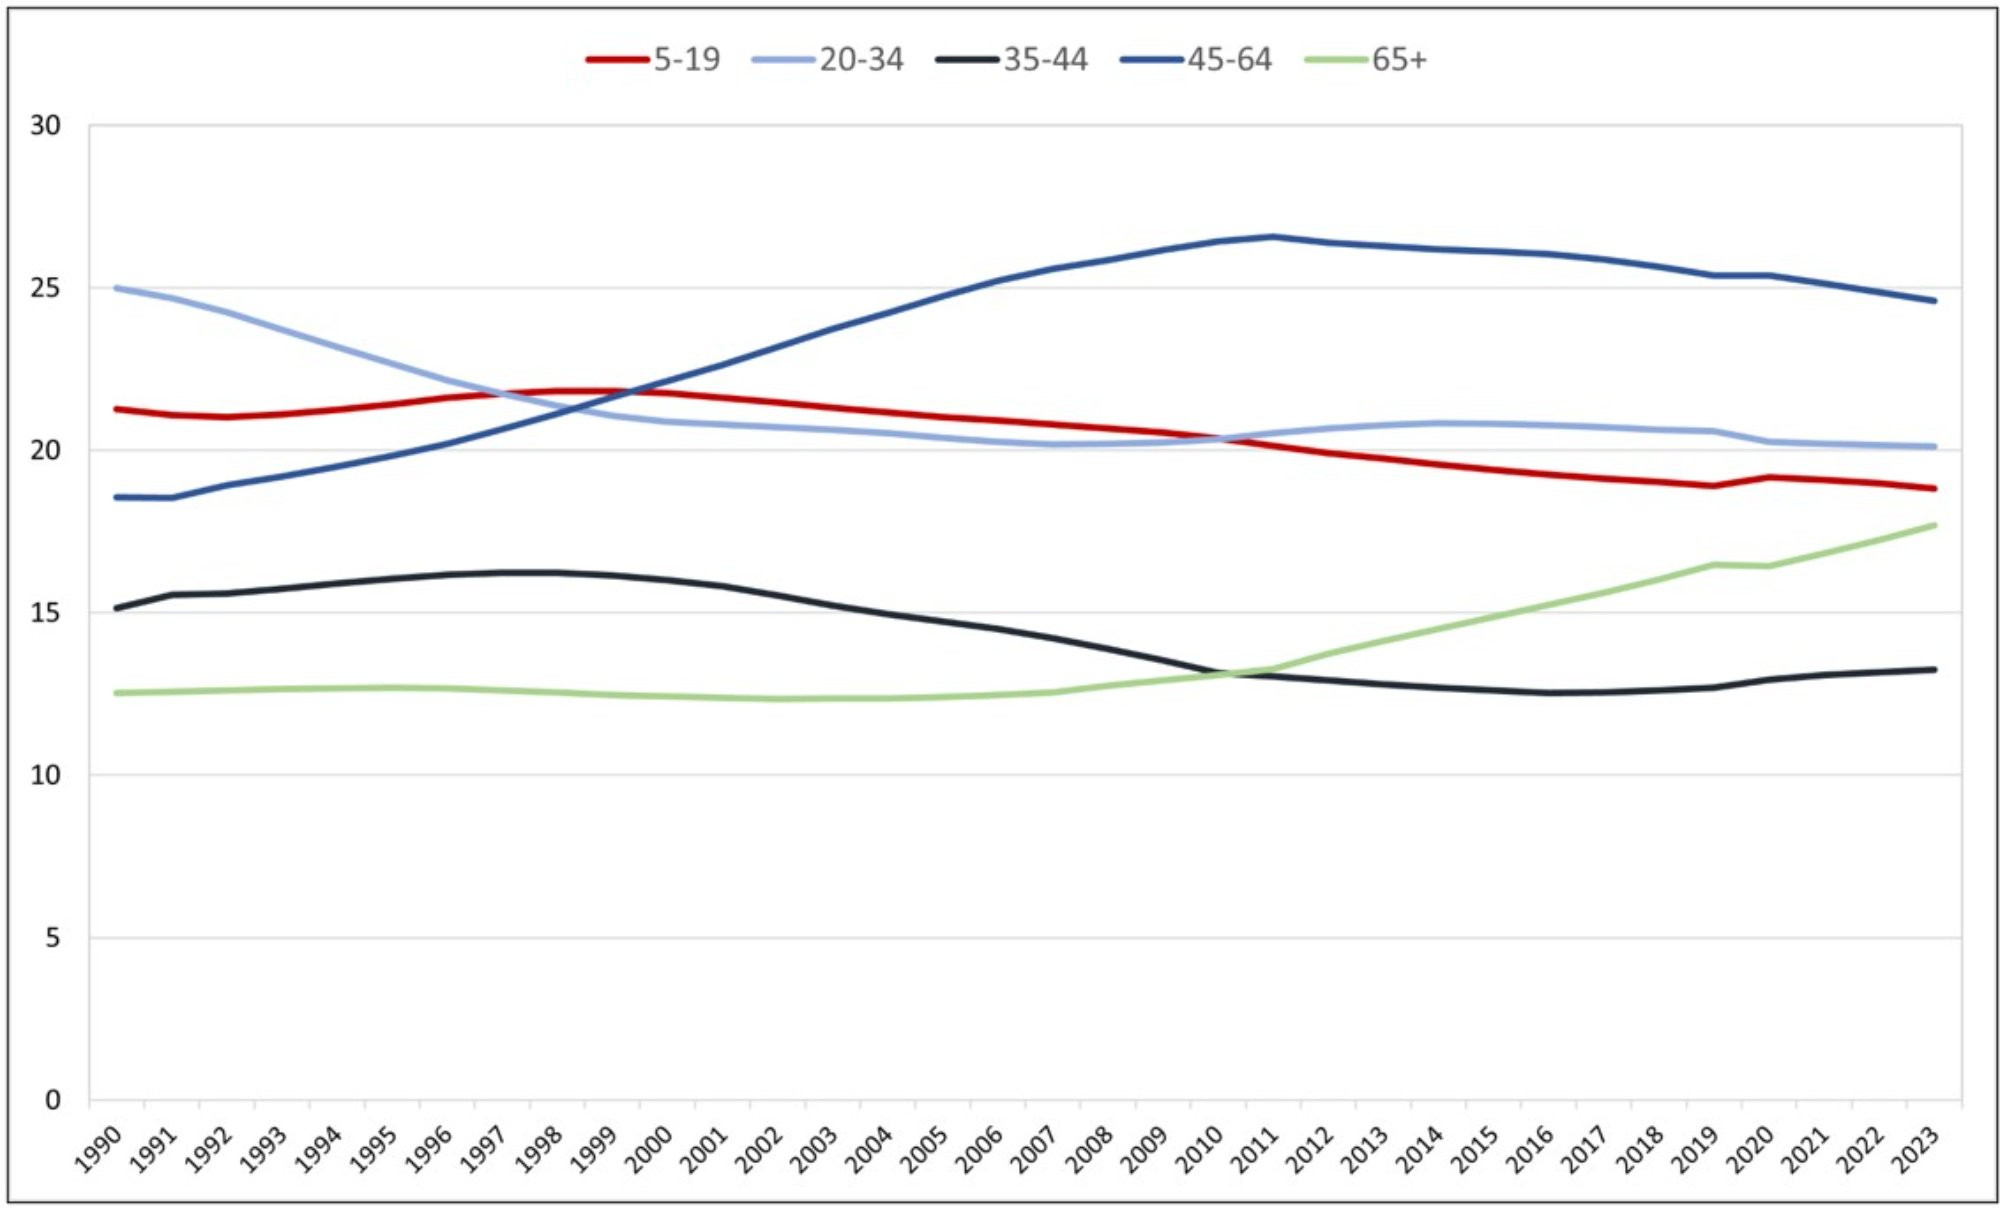
A significant development in U.S. demography continues to be the aging of baby boomers (persons born between 1946 and 1964). Figures 2 through 5 depict population distributions by age for KOMA, Detroit, the state of Michigan, and the U.S. as a whole. The clear trend in all four figures is the steady aging of the population. Persons between the ages of 45 and 64 continue to outnumber all other age groups despite being only the third-largest age group in 1990. Between 1990 and 2023, the population between the ages of 45 and 64 burgeoned by an average of 7 percent in KOMA, Detroit, Michigan, and the U.S. As noted previously, since 2010, the percentage of the population over 65 has experienced the largest growth of any age category (about 5 percentage points between 2010 and 2023) in all geographical stratum. As a result, the populations between the ages of 5 and 19, 20 and 34, and 35 and 44 all account for a smaller percentage of the total population today than in 1990. These trends are significant for several reasons.
Figure 2: Population Distribution as a Percent of KOMA, 1990-2023
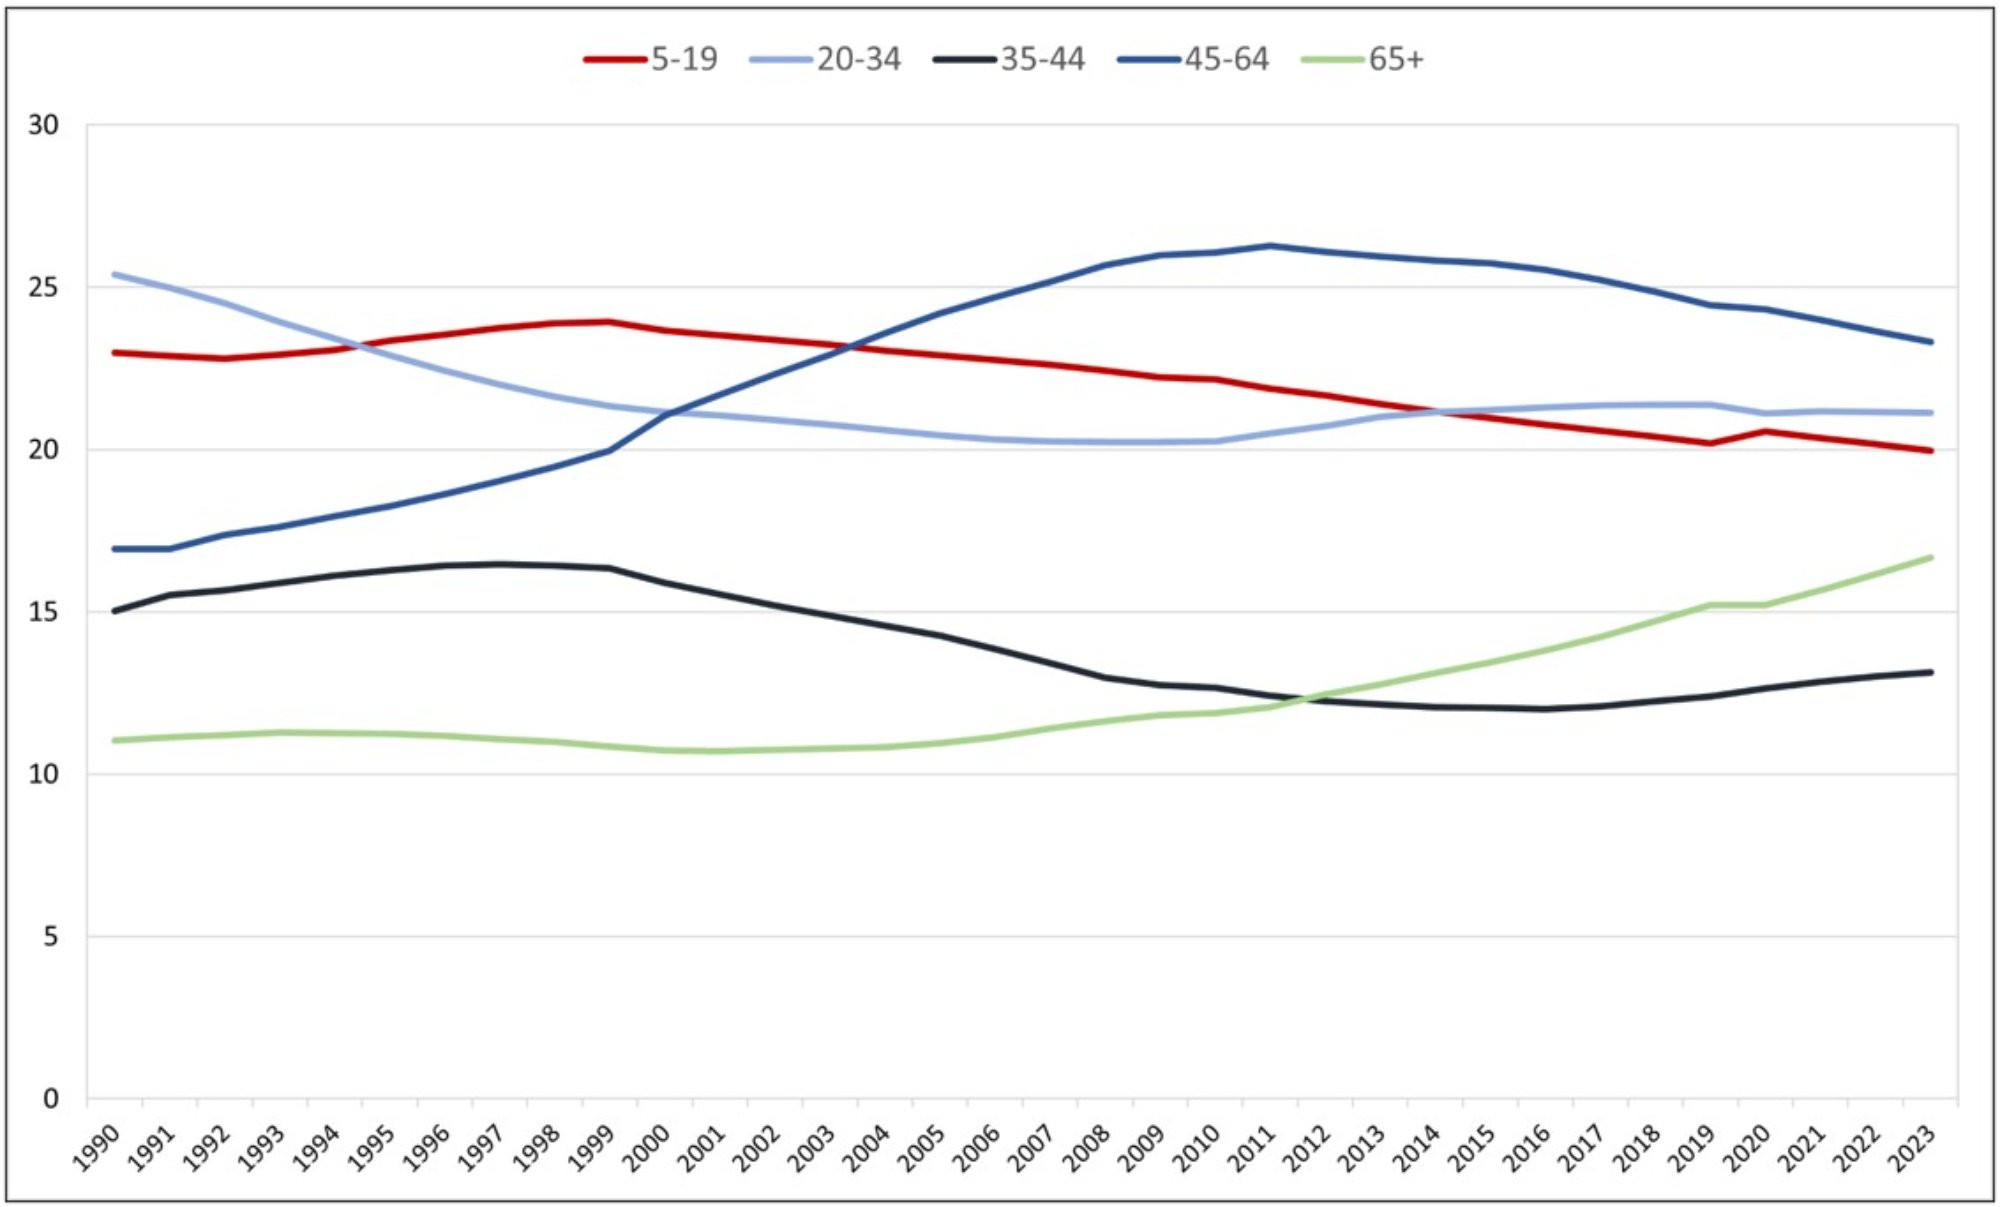
Description: Figure 2 presents the population distribution of KOMA (Kent, Ottawa, Muskegon, and Allegan counties). It highlights a steady decrease in the proportion of young people and an increase in the proportion of older persons within the KOMA region.
Source: U.S. Census, Population and Housing Unit Estimates.
Figure 3: Population Distribution as a Percent of Detroit, 1990-2023
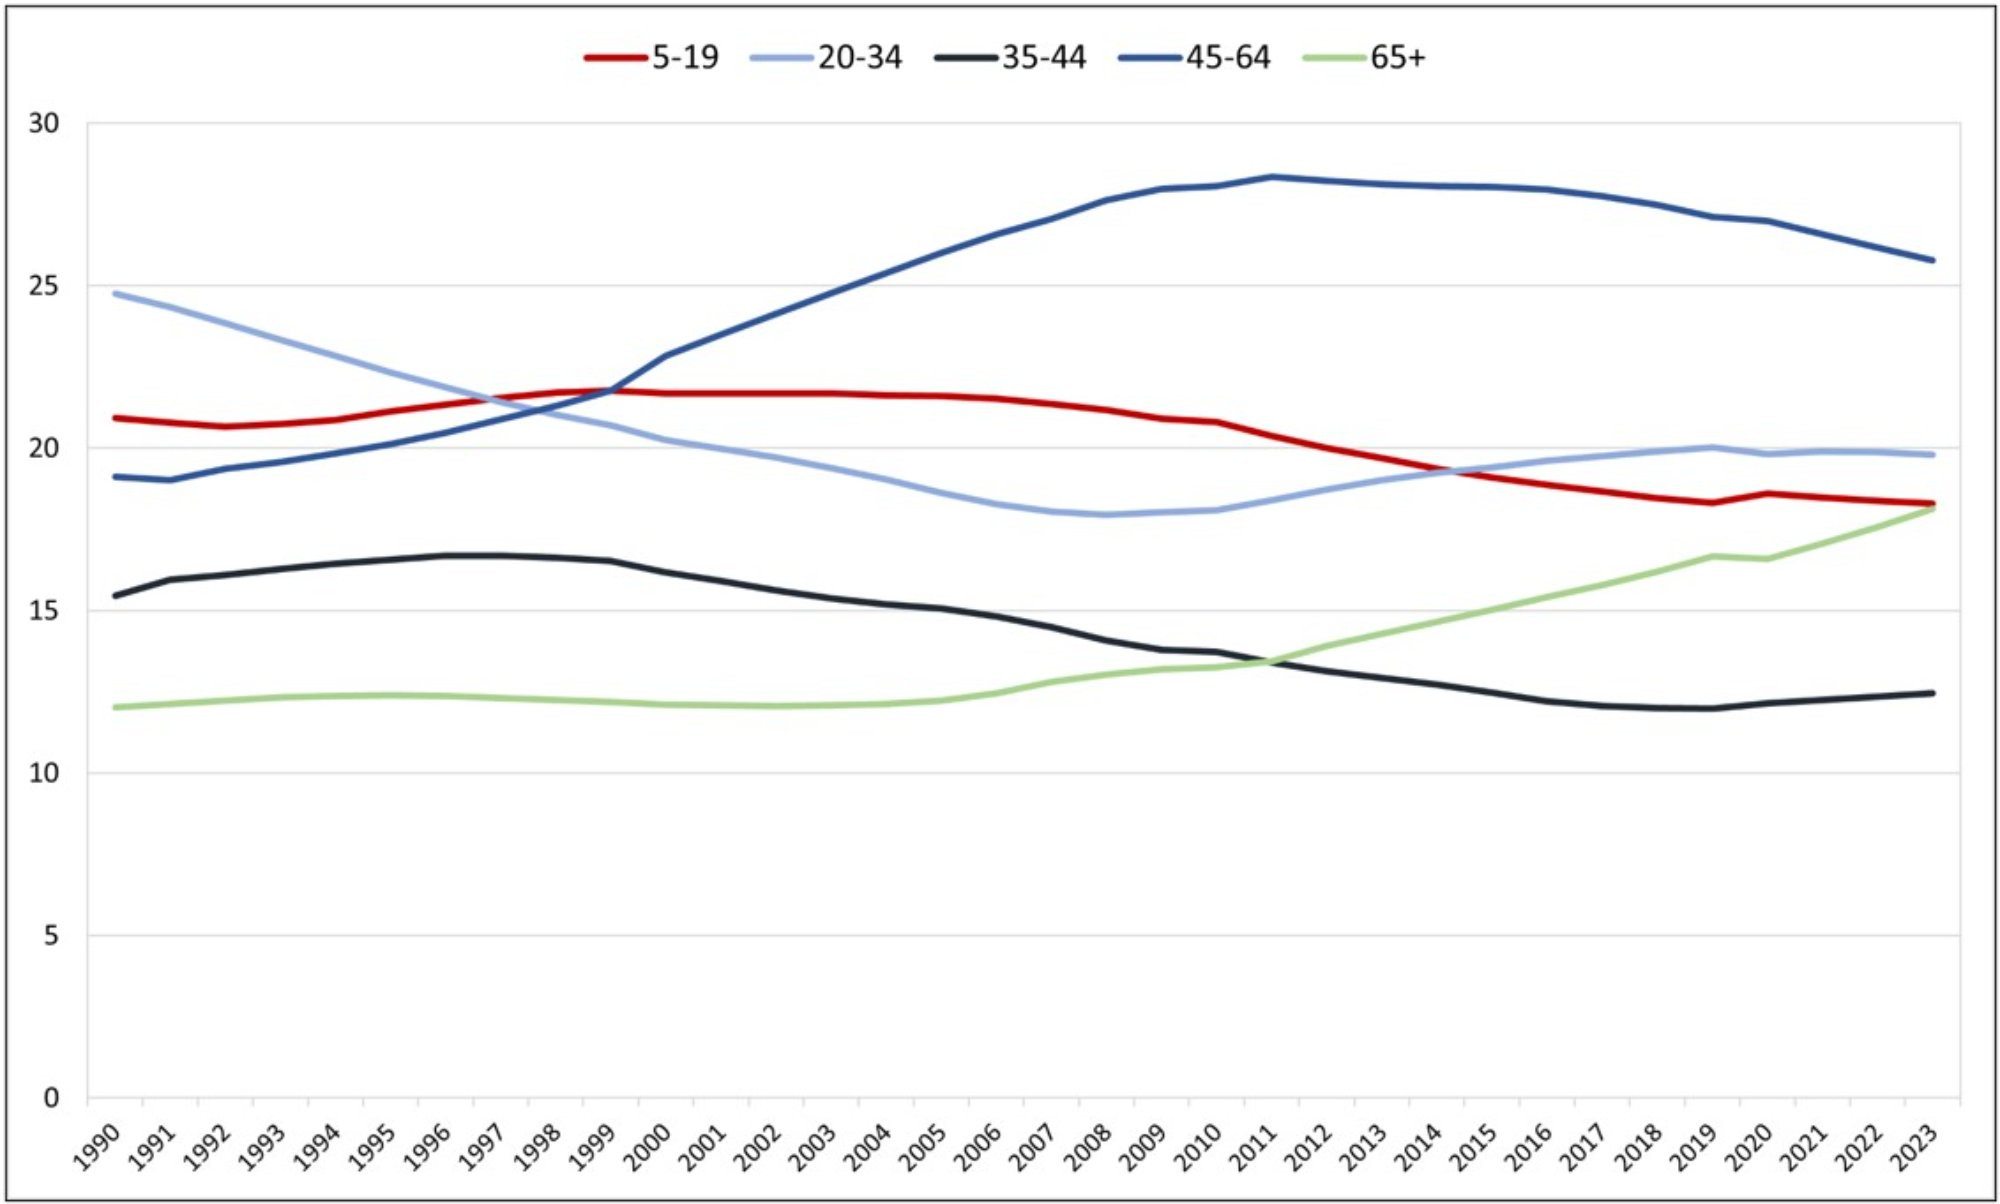
Description: Figure 3 presents the population distribution of Detroit (Oakland, Macomb, and Wayne counties). It highlights a steady decrease in the proportion of young people and an increase in the proportion of older persons within the Detroit region.
Source: U.S. Census, Population and Housing Unit Estimates.
Figure 4: Population Distribution as a Percent of Michigan, 1990-2023
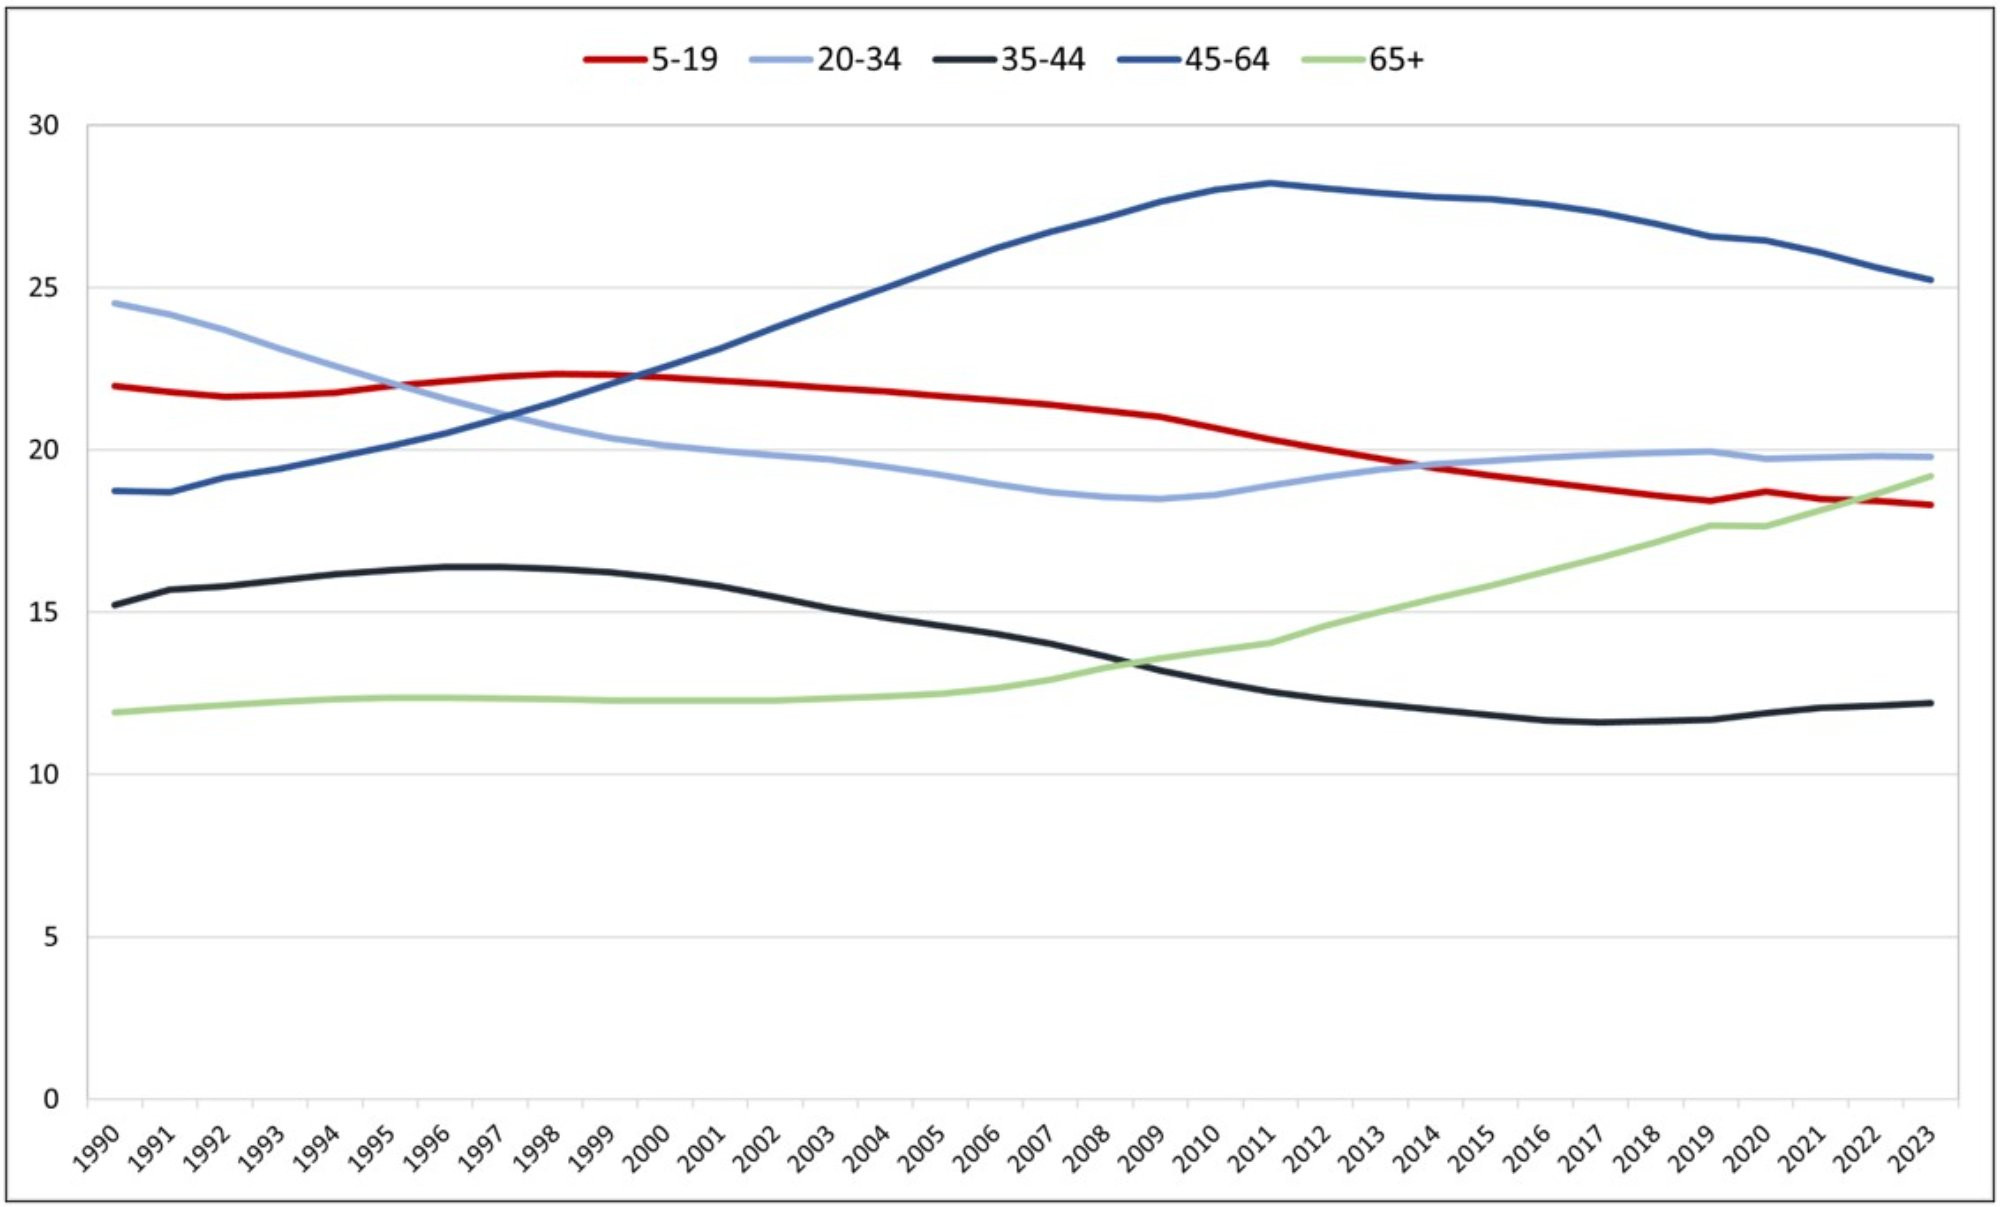
Description: Figure 4 presents the population distribution of Michigan. It highlights a steady decrease in the proportion of young people and an increase in the proportion of older persons within Michigan.
Source: U.S. Census, Population and Housing Unit Estimates.
Figure 5: Population Distribution as a Percent of the United States, 1990-2023
Description: Figure 5 presents the population distribution of the United States. It highlights a steady decrease in the proportion of young people and an increase in the proportion of older persons within the U.S.
Source: U.S. Census, Population and Housing Unit Estimates.
First, healthcare expenditures are closely related to age, with more than 50 percent of lifetime spending on medical care occurring after age 65 (Alemayehu & Warner, 2004). Due to the demographic shifts (see Figures 2 through 5), the Centers for Medicare and Medicaid Services (2017) project total Medicare spending to nearly double between 2015 and 2026. In Michigan, the Detroit region has a higher proportion of its population in the 45 to 64 and 65 and over age categories, which may result in higher medical expenditures. The share of the population over 65 in Detroit grew from roughly 12 percent in 1990 to 18 percent in 2023. By contrast, KOMA has a population distribution that is slightly younger than that of the U.S. However, increasing medical expenditures associated with an aging population will likely occur across the entire state.
Second, Figures 2 through 5 show the proportion of those over the age of 65 in comparison to the population between the prime working ages of 35 and 44. Since the Medicare program is primarily funded through taxes on employment, participants in the labor market effectively subsidize health insurance for the over-65 age demographic. The number of workers per Medicare beneficiary has fallen steadily over the last two decades. In 2000, roughly four workers supported each Medicare beneficiary; that ratio is expected to fall to 2.5 by 2030 and 2.1 by 2095 (Board of Trustees of the Federal Hospital Insurance and Federal Supplementary Medical Insurance Trust Funds, 2024). As a result, the Medicare Part A trust fund is projected insolvent beyond 2036 and, by the end of the century, health insurance costs are forecasted to rise by 30 percent due to the aging population alone.
Finally, the aging of the population has important implications for employer-sponsored health insurance premiums. As the share of the workforce over the age of 45 grows, the cost of private health insurance obtained through employment will likely continue to increase. Between 1999 and 2023, average annual employer-sponsored health insurance premiums for family coverage have increased by 313% percent, which is more than 18 times the increase in real wages (17 percent) and double the rate of inflation (124 percent) that was observed over the same period (Kaiser Family Foundation, 2023).
References
Alemayehu, B., & Warner K. E., (2004). The lifetime distribution of health care costs. Health Services Research, 39(3), 627-642.
Board of Trustees of the Federal Hospital Insurance and Federal Supplementary Medical Insurance Trust Funds. (2024). 2024 Annual Report. Retrieved from https://www.cms.gov/oact/tr/2024
Centers for Medicare and Medicaid Services. (2022). Medicare Geographic Variation Public Use Files. Retrieved from https://data.cms.gov/summary-statistics-on-use-and-payments/medicare-geographic-comparisons/medicare-geographic-variation-by-national-state-county/data
Kaiser Family Foundation. (2023). 2023 Employer Health Benefits Survey. Retrieved from https://www.kff.org/report-section/ehbs-2023-section-1-cost-of-health-insurance/