Benchmarking Communities
By Daniel Montanera, Ph.D., Assistant Professor, Department of Economics, Seidman College of Business, Grand Valley State University
In this section, we compare the Grand Rapids combined statistical area to a selected group of metropolitan areas to examine differences in the supply of hospital services, hospital expenses, and Medicare expenditures.1 We compare changes in hospital utilization and expenditures for the Grand Rapids region to changes for a benchmark region calculated as the population weighted outcome average for Louisville, KY; Buffalo, NY; Rochester, NY; and Milwaukee, WI. These regions were selected as benchmark communities based on similarities to Grand Rapids in a variety of regional metrics including population density, earnings estimates, unemployment rates, and population age and race distributions. We also include data for the Detroit region and for the entire United States.
The Supply and Utilization of Hospital Services
Figures 1-6 are constructed using data from the 2024 edition of the American Hospital Association (AHA) Hospital Statistics, which covers survey responses regarding variables of interest in 2022 (American Hospital Association, 2024). These figures focus on both hospital capacity and utilization across Grand Rapids and the benchmark comparison regions. Utilization measures such as admissions, outpatient hospital visits, and emergency department visits are measured as per capita rates using the number of residents in each region as the denominator. As noted previously, a downside to the use of these per capita utilization rates is that they do not account for the inflow of patients from outside the region or the outflow of patients to other regions. As such, if individuals are traveling to a region to receive care despite living outside of that region, those individuals will contribute to the numerator in the utilization calculation, but not to the denominator. In cases where patient inflow is particularly high, utilization measures will be overstated.
Figure 1 includes data on the number of hospital beds per 1,000 residents in each region from 2005 to 2022. This measure serves as a proxy for hospital capacity. For all communities in the graph, hospital capacity has remained fairly steady. This has solidified the relative positions of the communities observed in previous versions of this report. As it historically has, hospital capacity in Grand Rapids remains low relative the U.S. average, and well below the capacities of Detroit and the benchmark communities. Given that hospital care is expensive relative to other health services, this represents a comparative advantage for the region by way of the lower cost of care passed along to employers. While unchanging hospital capacity would suggest relatively constant levels of access and quality of care for a given population, this capacity may become strained as the population ages or becomes sicker.
Figure 1: Hospital Beds per 1,000 Population
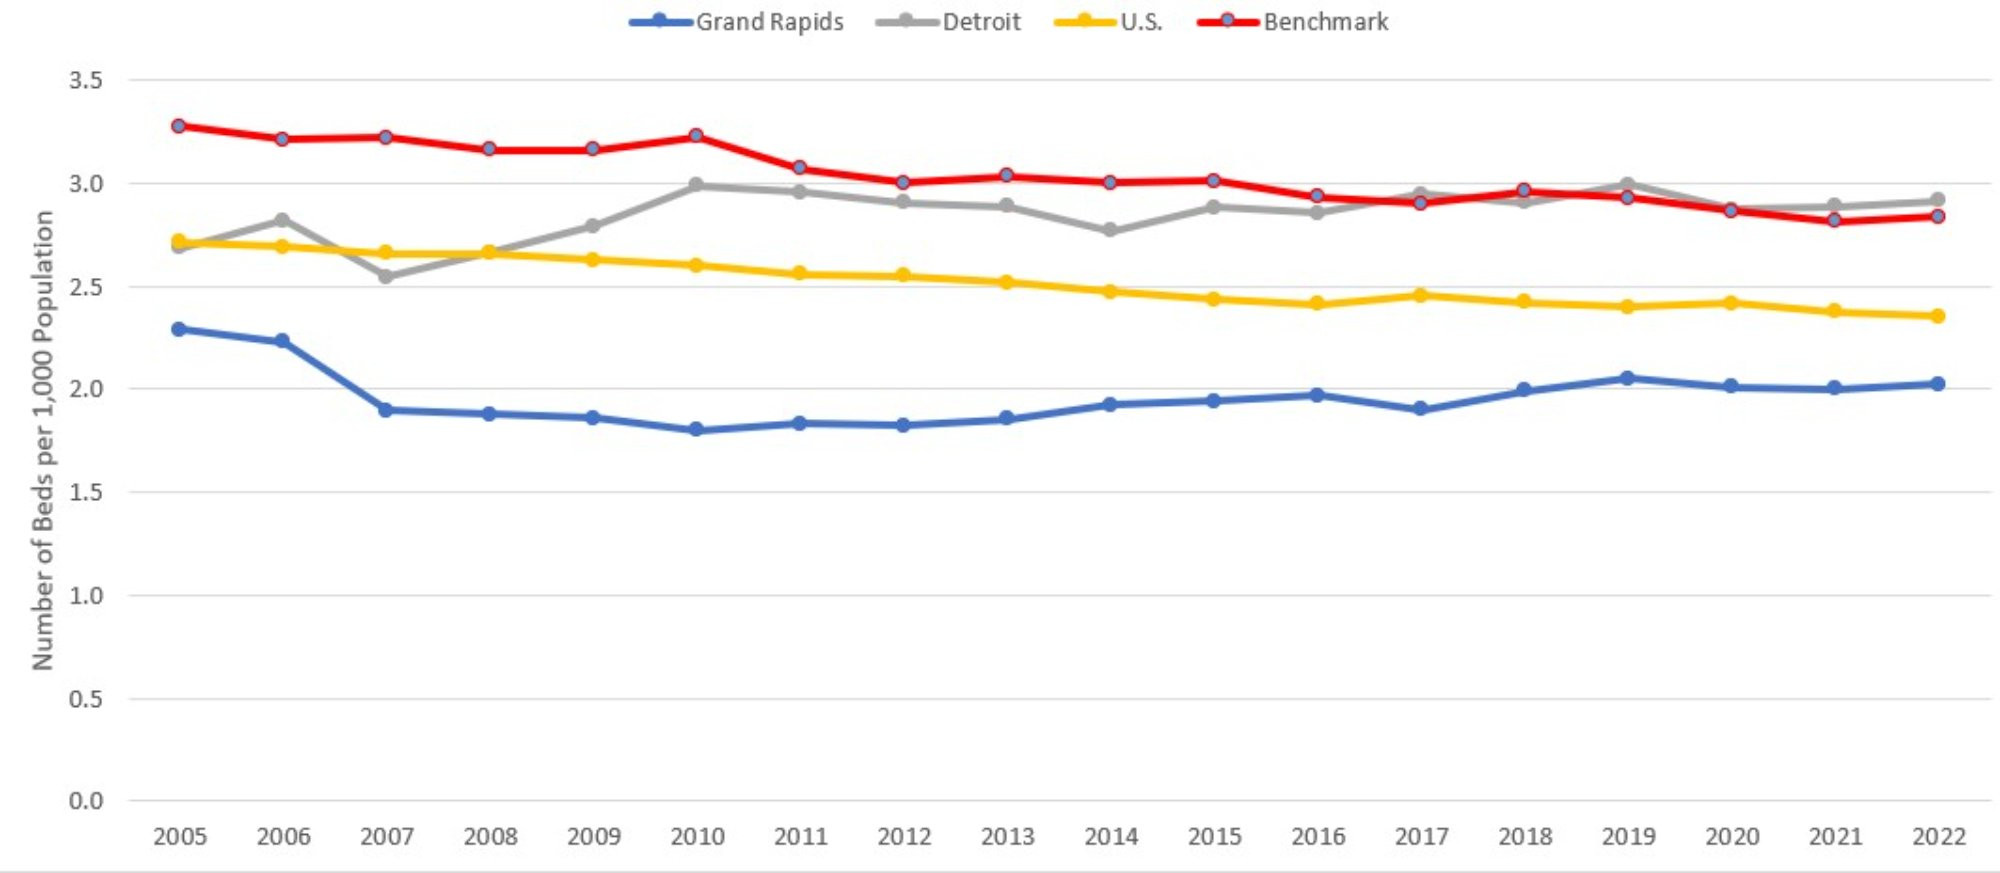
Description: The Hospital Beds per 1000 Population graph shows the total number of hospital beds divided by total population, with one series each for Grand Rapids, Detroit, the entire US, and the benchmark communities (a mix of Buffalo NY, Rochester NY, Louisville KY, and Milwaukee WI) from 2005 to 2022. Beds per capita in the other three comparison communities have been declining gradually and slowly converging on that of Grand Rapids, which is consistently the lowest.
Source: American Hospital Association (2024).
Figure 2 displays the number of hospital admissions per 1,000 residents. While Figure 1 focused on inpatient capacity, Figure 2 provides data on inpatient utilization. While per-capita admissions remained steady for the three comparison communities, Grand Rapids experienced a notable 10 percent decline relative to the previous year. Grand Rapids has reached its lowest level of hospital utilization ever recorded in this series of reports, with 80.65 hospital admissions per 1000 population being 14.8 percent below the national average. The comparison communities remain 9 to 15 percent below the levels from the beginning of the pandemic. This is a departure from the long-run trend of Grand Rapids losing its comparative advantage in hospitalization rates, as the city had fallen within 10 percent of the national average. The stabilization in rates across the country is good news for hospitals following the COVID-related drop in overall admission rates from 2020 and the resulting negative impact on hospital budgets (Heist et al., 2021).
Figure 2: Hospital Admissions per 1,000 Population
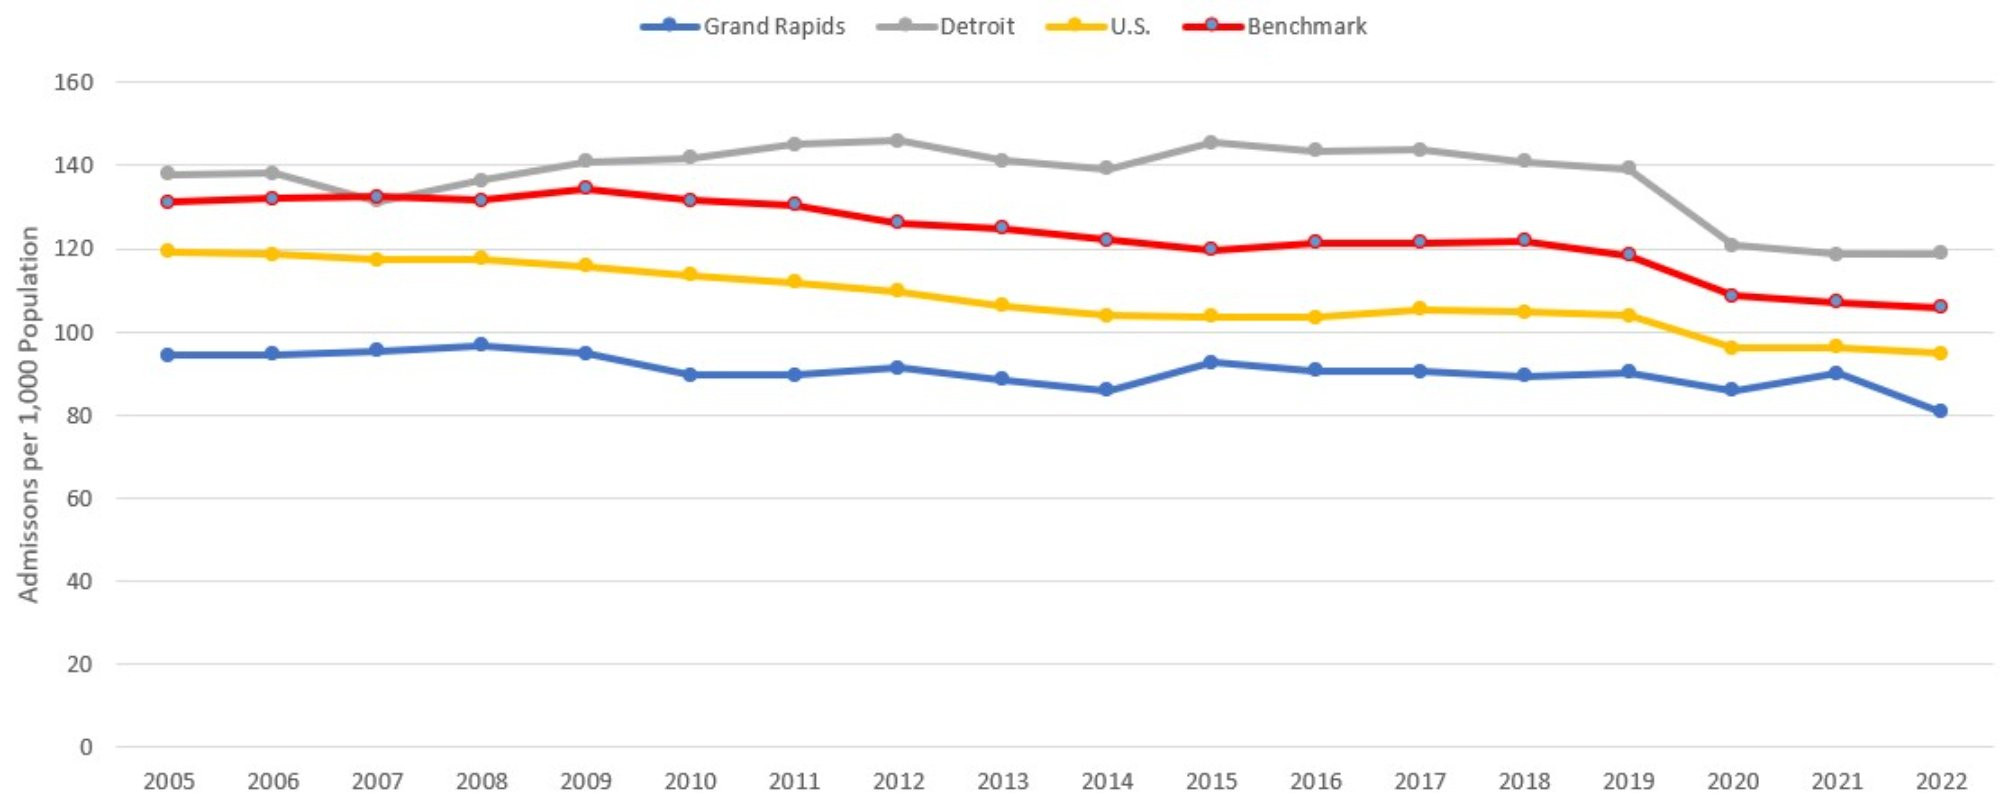
Description: The Hospital Admissions per 1000 Population graph shows the total number of hospital admissions divided by total population, with one series each for Grand Rapids, Detroit, the entire US, and the benchmark communities (a mix of Buffalo NY, Rochester NY, Louisville KY, and Milwaukee WI) from 2005 to 2022. Grand Rapids is consistently the lowest of the four, reaching its lowest level in 2022.
Source: American Hospital Association (2024).
Figure 3 plots per capita outpatient visits from 2005 to 2022. Most of the comparison communities are back on their pre-COVID trends following declines in 2020. Grand Rapids is more or less back on trend as well, though from the other direction. While the comparison communities saw declines during the first full year of COVID, Grand Rapids saw rising per capita outpatient visits over 2020 and 2021. Grand Rapids is the only community to experience a decline in outpatient utilization from 2021 to 2022, and it was a substantial decline of 13 percent. As a result, the gap in outpatient utilization between Grand Rapids and every other comparison community has narrowed. The percentage gap between Grand Rapids and Detroit, for example, has changed from 29 percent to 10 percent. Similarly, Grand Rapids’ outpatient visits per capita are now only 23 percent higher (down from 42 percent) than that of the benchmark communities. The gap in outpatient visits per capital between Grand Rapids and the rest of the country has narrowed significantly, with Grand Rapids’ visits per capita being 79 percent greater than the national average in 2022, down from 108 percent in 2021.
Figure 3: Outpatient Visits to Hospitals per 1,000 Population
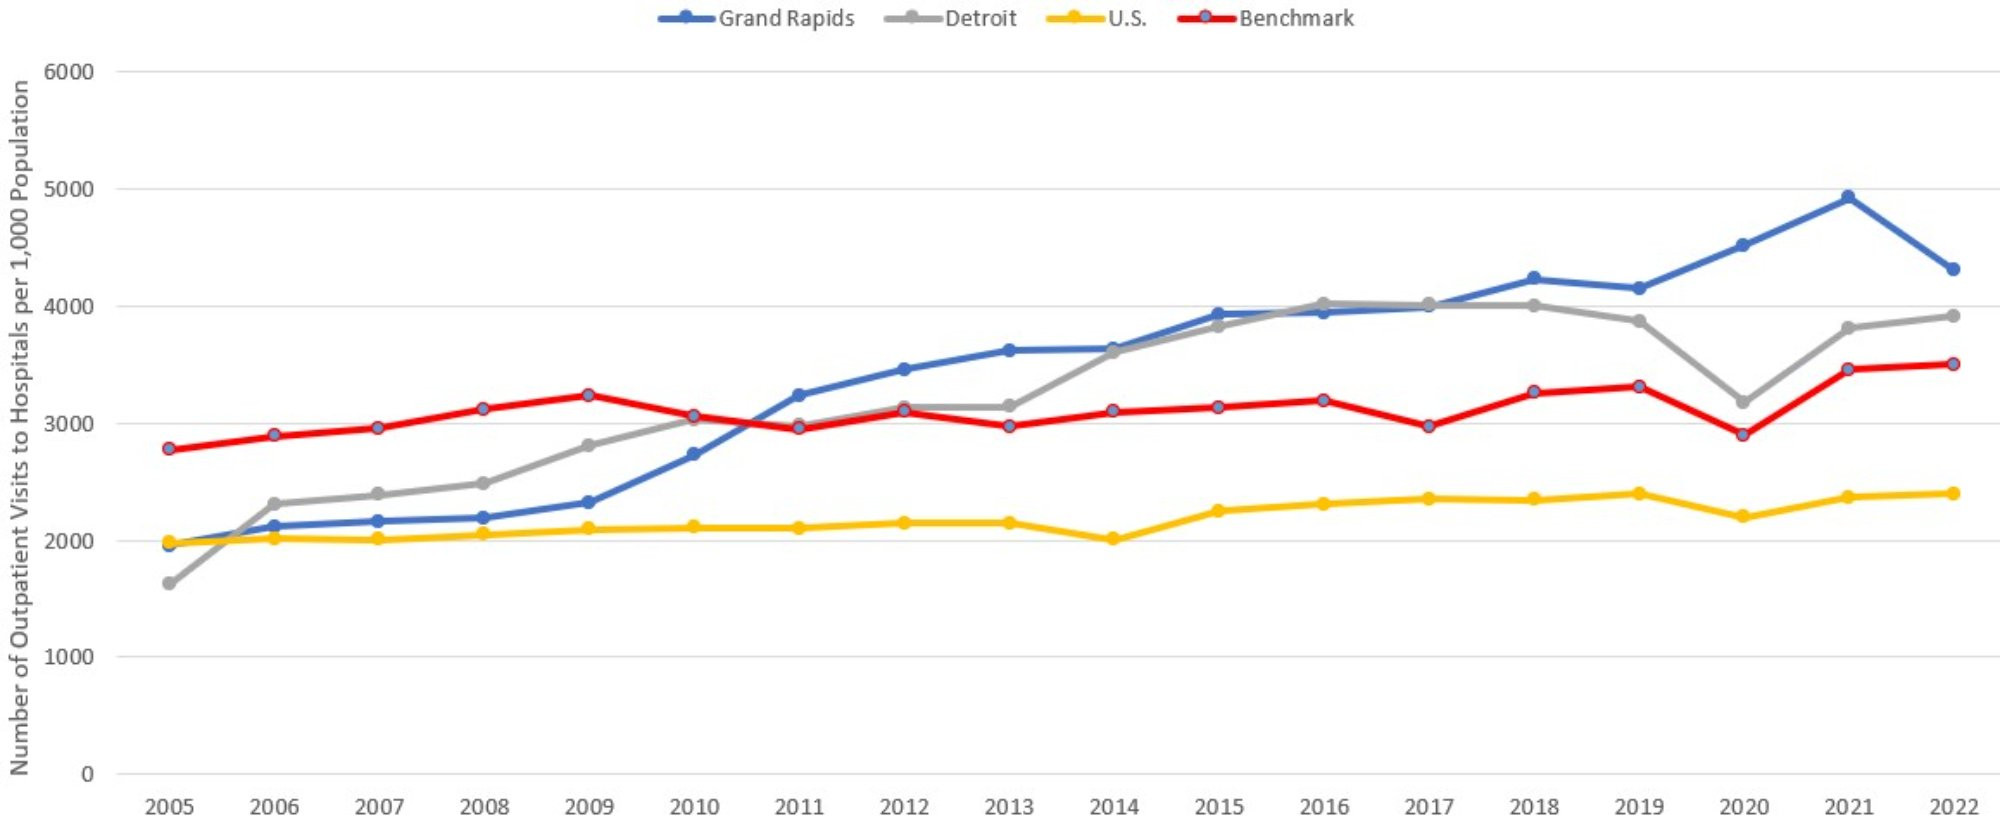
Description: The Outpatient Visits to Hospital per 1000 Population graph shows the total number of outpatient visits to hospital facilities divided by total population, with one series each for Grand Rapids, Detroit, the entire US, and the benchmark communities (a mix of Buffalo NY, Rochester NY, Louisville KY, and Milwaukee WI) from 2005 to 2022. Per capita visits in Grand Rapids are the highest of the four, having steadily risen more rapidly over time.
Source: American Hospital Association (2024).
Figure 4 examines an additional component of hospital utilization by plotting per capita emergency department (ED) visits for Grand Rapids and each of the comparison regions. This utilization measure has experienced substantial absolute and relative fluctuations over the past three years. Spiking ED use for Grand Rapids in 2021 had narrowed the utilization gap with Detroit to only 5 percent in 2021, which was far off the historical gap of 24 percent. Last year’s report cited the reasons for this spike as the early onset of wintertime viral illnesses (Buursma, 2021; McVicar, 2021), delta-variant COVID surges (Buursma, 2021) particularly among the unvaccinated (Lovern, 2021), and a rise of mental health-related visits to emergency departments in Michigan during and in the wake of the COVID pandemic (Erb and Barrett, 2021). Though it is still early for drawing conclusions, the 13 percent decline in ED utilization in Grand Rapids from 2021 to 2022 would suggest that the earlier spike is not part of a long-term trend or convergence with the utilization levels found in Detroit, which has always been the highest among the comparison communities.
1 Because the Grand Rapids metropolitan statistical area (MSA) definition has recently changed, we use the more consistent definition of the core-based statistical area. The Detroit region is defined using the smaller metropolitan division categorization. All other regions are defined using the MSA.
Figure 4: Emergency Department Visits per 1,000 Population
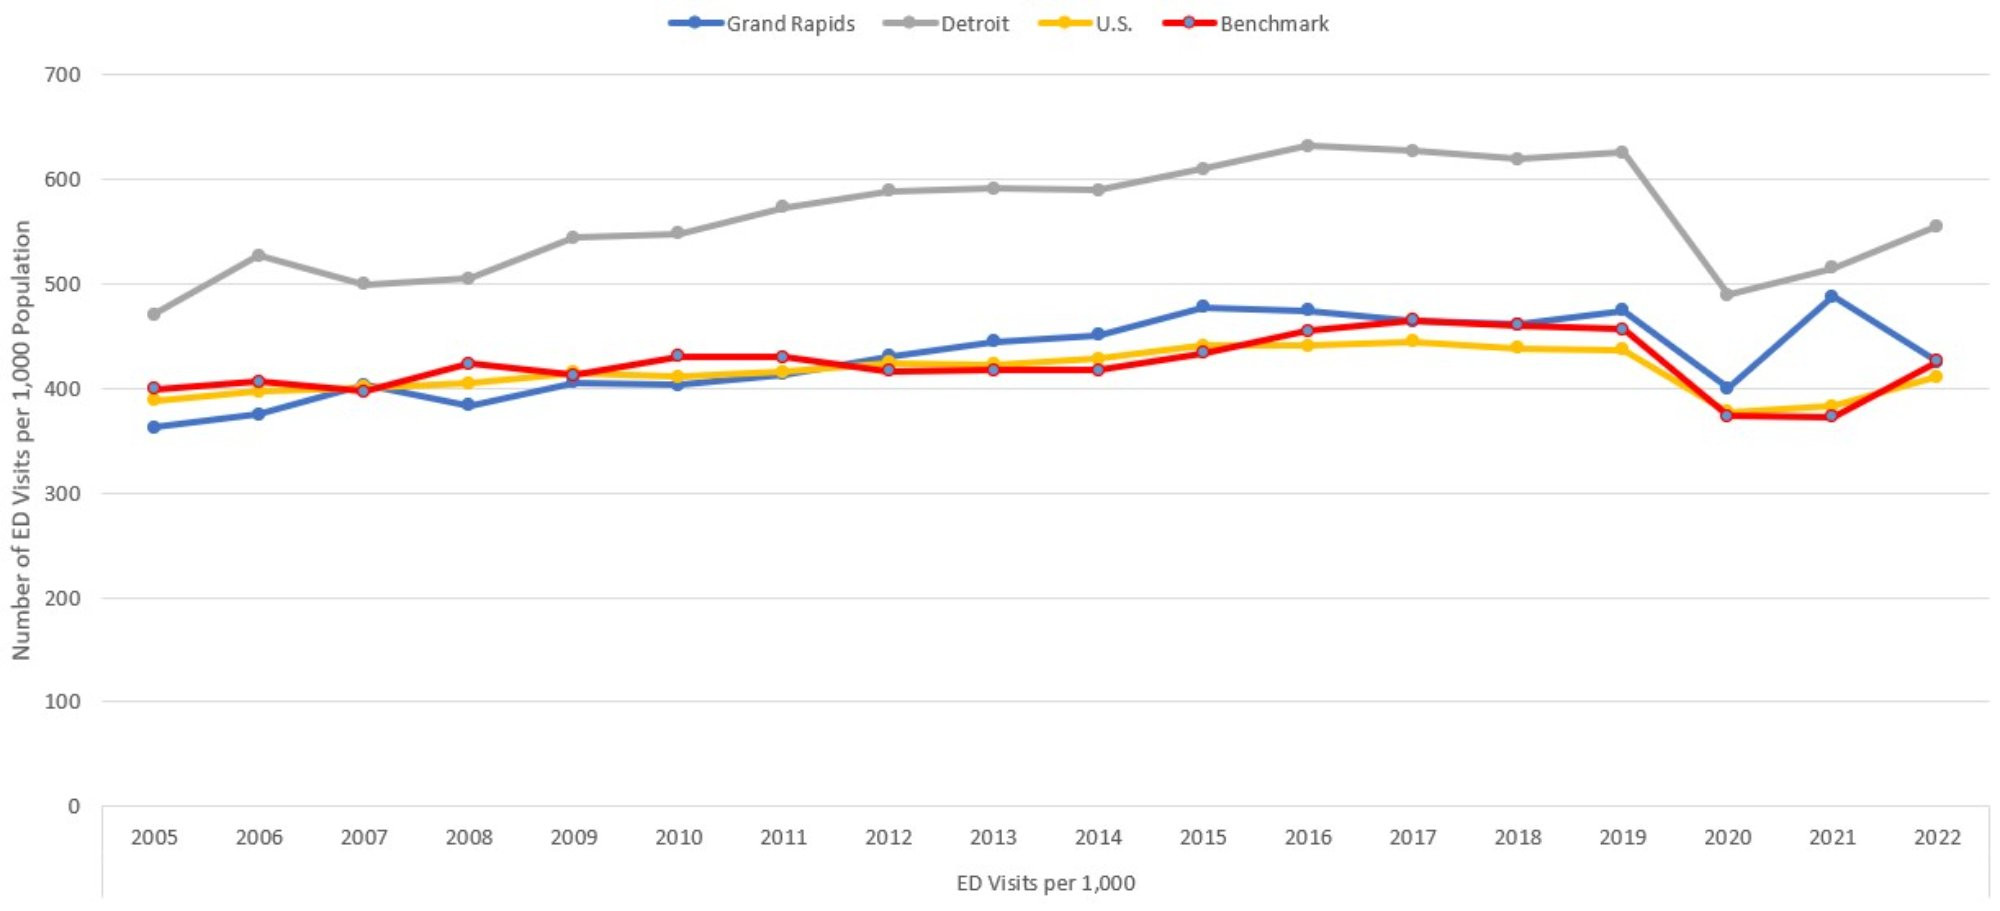
Description: The Emergency Department Visits per 1000 Population graph shows the total number of emergency department visits divided by total population, with one series each for Grand Rapids, Detroit, the entire US, and the benchmark communities (a mix of Buffalo NY, Rochester NY, Louisville KY, and Milwaukee WI) from 2005 to 2022. The series all show the same pattern, with Detroit being significantly above the others.
Source: American Hospital Association (2024).
Just as Figure 2 showed changes in hospitalization rates across all four hospital comparison communities, Figure 5 reveals changes in the average lengths of stay, conditional on admission. All communities experienced increased average lengths of stay between 2021 and 2022, with Grand Rapids experienced the largest increase at over half a day. This is lower than the benchmark communities (0.37 days) and the national average (0.12 days). Detroit experienced the smallest increase at only 0.07 days, and as a result, average length of stay in Grand Rapids and Detroit was roughly the same in 2022. This is not without precedent in the history of these reports, though Grand Rapids’ average length of stay has typically been lower than Detroit’s. The consistent upward trend for all communities in average length of stay following the pandemic, compared with the relatively constant lengths of stay leading into the pandemic, may be further examples of the longer-run impact of delayed care from 2020. Around 41 percent of adults reported delaying care in 2020 (Czeisler et al, 2020), which could have led to increased morbidity and mortality upon later presentation at hospital in 2022. This impact in Michigan has not been drastically different from the rest of the country, though the timing of the effect has been different on the east and west sides of the state.
Figure 5: Average Hospital Length of Stay
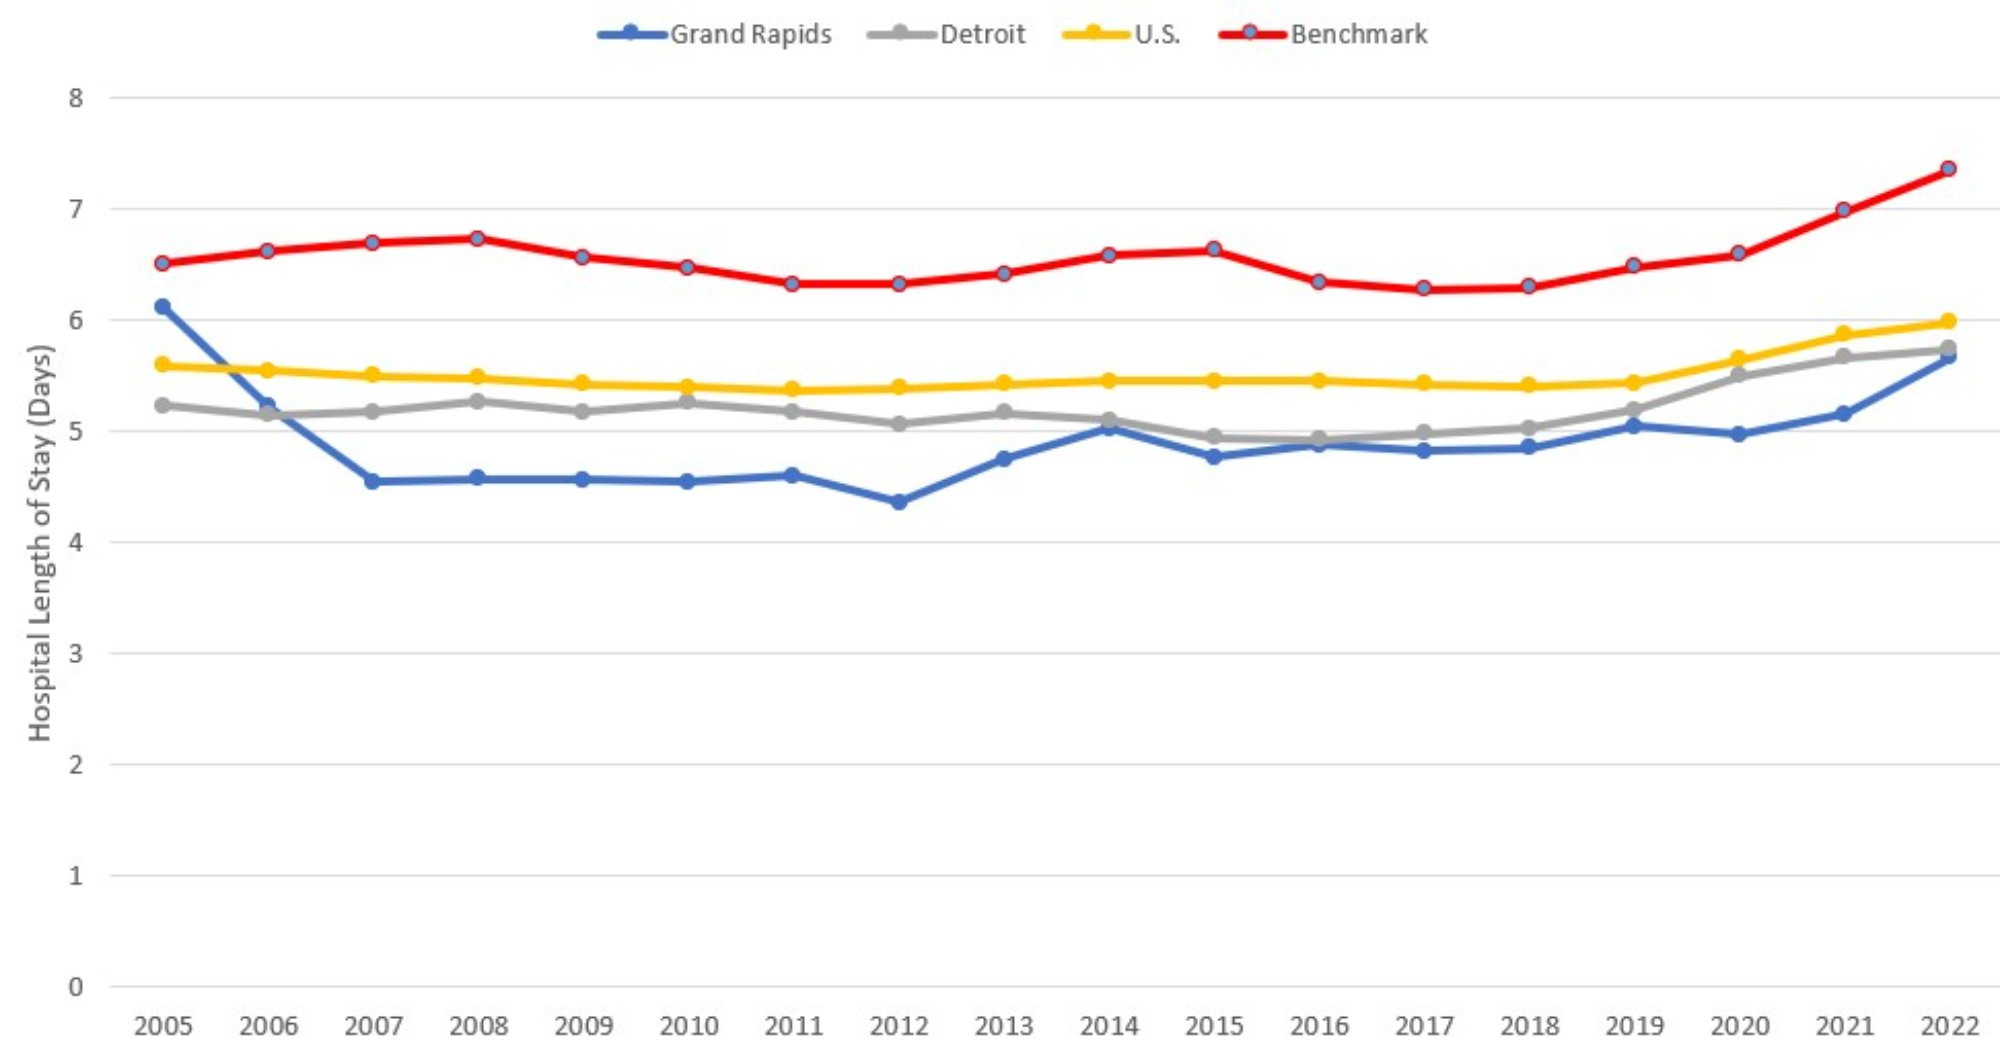
Description: The Average Length of Stay graph shows the total number of inpatient days divided by total admissions, with one series each for Grand Rapids, Detroit, the entire US, and the benchmark communities (a mix of Buffalo NY, Rochester NY, Louisville KY, and Milwaukee WI) from 2005 to 2022. The benchmark communities show consistently higher average lengths of stay, while the other three are relatively close together.
Source: American Hospital Association (2024).
Finally, Figure 6 highlights the number of hospital-based personnel per 1,000 residents in each region. These personnel counts are based on the total number of full-time equivalent (FTE) hospital employees, excluding medical and dental residents, interns, and other trainees. Detroit suffered the greatest year-over-year decline (6 percent) in personnel per capita between 2021 and 2022. Grand Rapids, on the other hand, experienced growth of 5 percent. As a result, for the first time in these reports, Grand Rapids has more hospital-based personnel per capita than Detroit. Just as in 2021, Detroit’s declines are not the result of declining real compensation, which grew 2022 and are now substantially higher than in any of the other comparison communities (see Figure 7). Grand Rapids has managed to grow its hospital-based personnel workforce despite real compensation declining by 6 percent in 2022. While burnout among health care workers may still be playing a role in producing the results for Detroit and the benchmark communities in Figures 6 and 7, this does not appear to be as significant a problem in Grand Rapids or the country as a whole. These findings are relevant to the broad literature studying burnout among health care workers during the pandemic (Bradley and Chahar 2020, Sharifi et al. 2021, Jalili et al. 2021).
Figure 6: Hospital-based Personnel per 1,000 Population
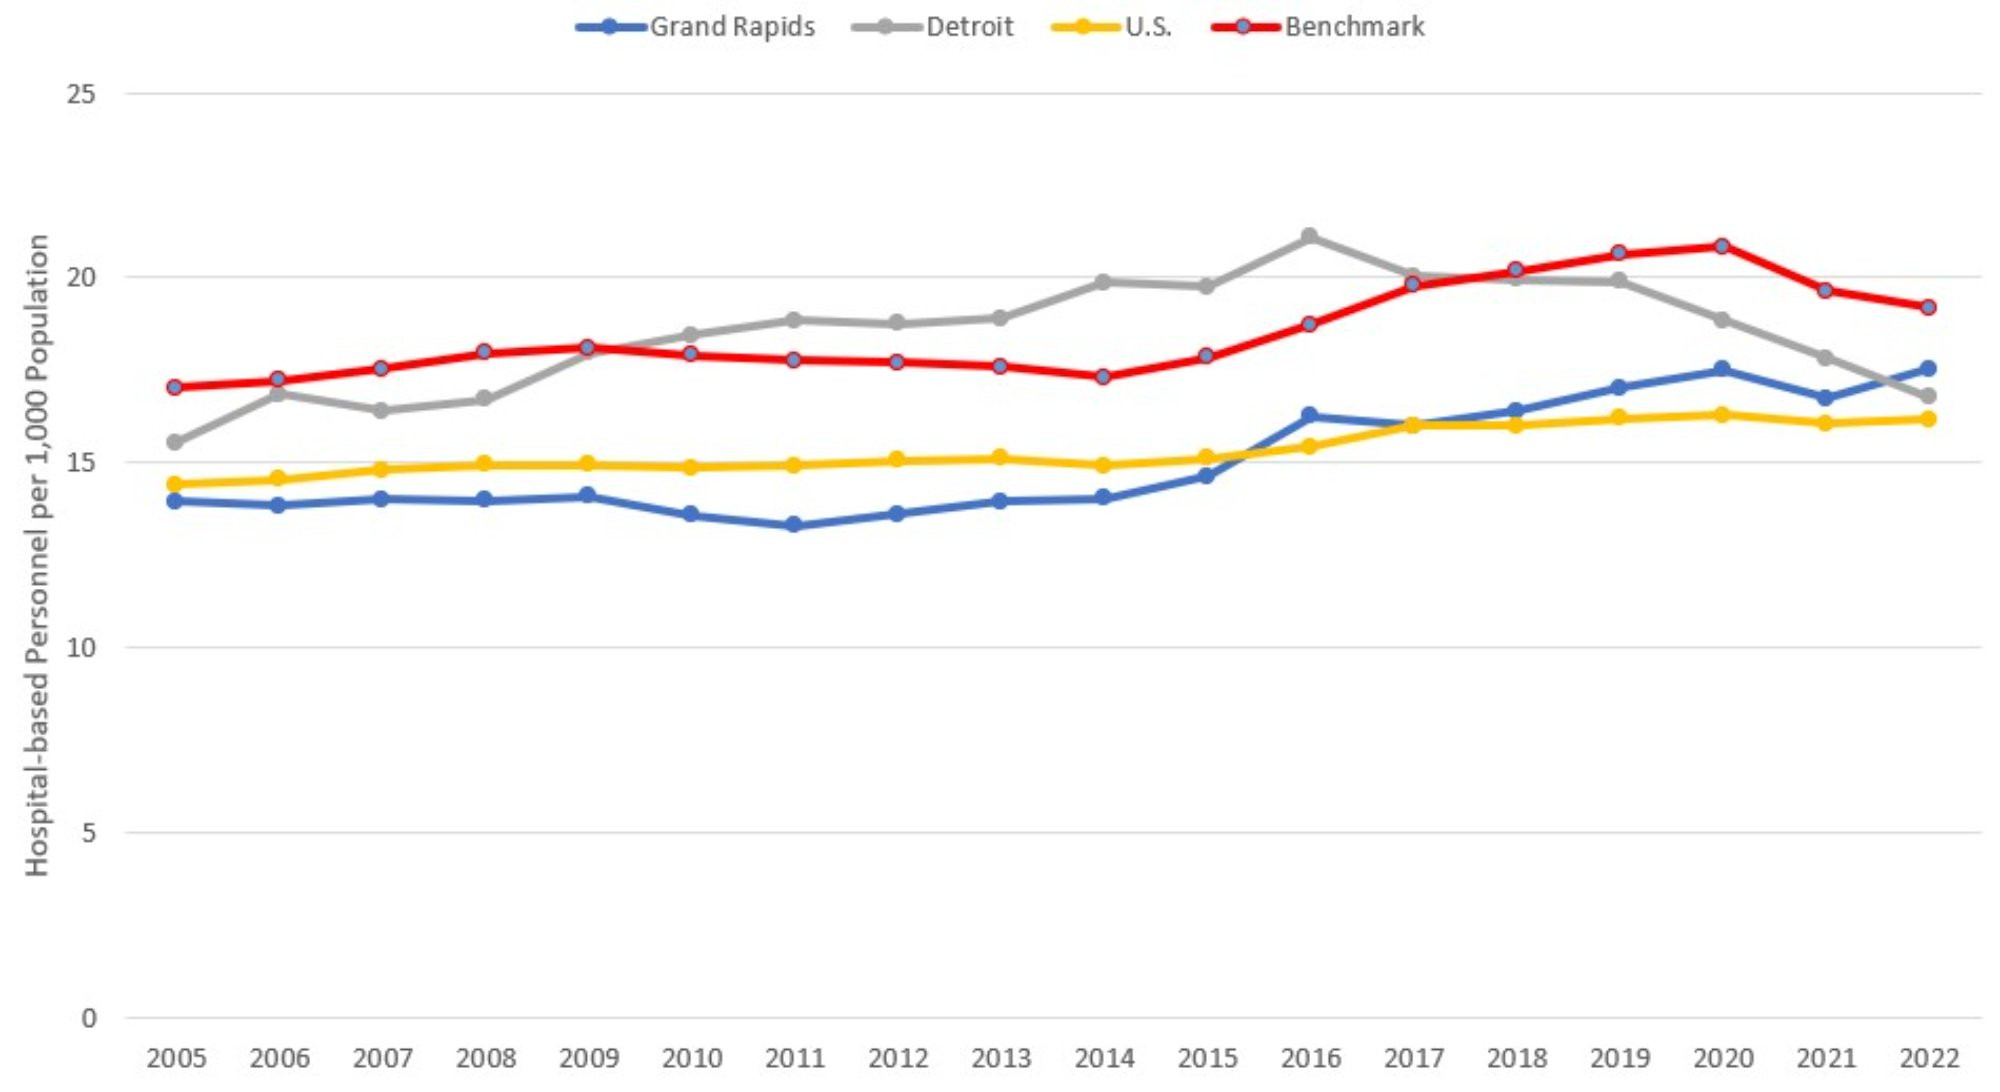
Description: The Hospital-based Personnel per 1000 Population graph shows the total number of hospital-based personnel divided by total population, with one series each for Grand Rapids, Detroit, the entire US, and the benchmark communities (a mix of Buffalo NY, Rochester NY, Louisville KY, and Milwaukee WI) from 2005 to 2022. All series rise gently at first, while there are some recent declines in Detroit and the benchmark communities.
Source: American Hospital Association (2024).
Hospital and Medical Expenditures
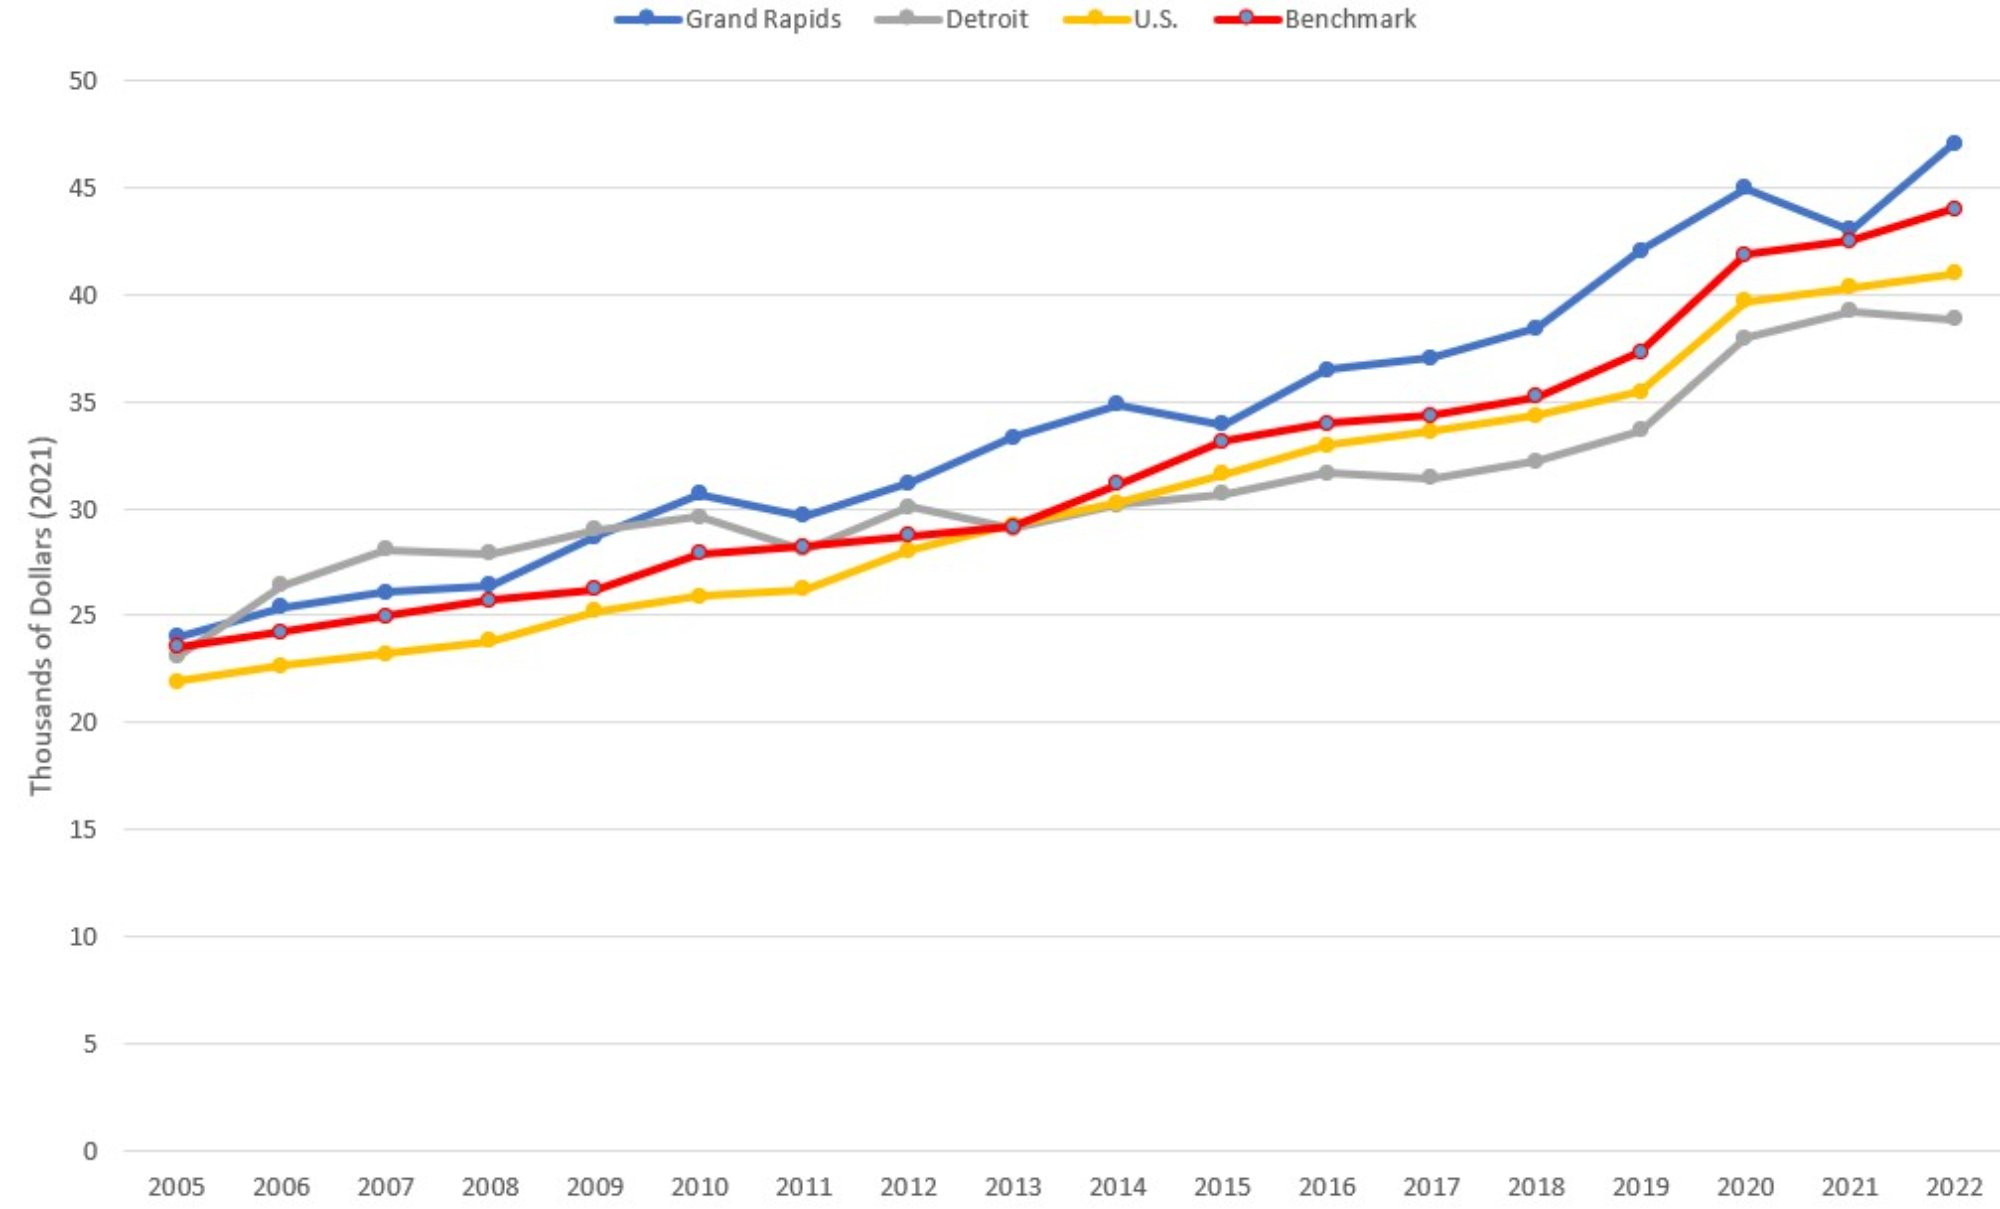
Figure 7 examines payroll and benefits expenses per hospital employee, which is inflation-adjusted to 2022 dollars using the consumer price index. This figure, along with Figure 8, was constructed using the AHA Annual Survey, managed by Wharton Research Data Services (2024). Compensation increased across all comparison communities, except for Grand Rapids. Average compensation in Grand Rapids remains the lowest of the comparison communities, now being 26 percent below that of Detroit and 15 percent below the national average. This reflects favorably on the ability of Grand Rapids hospitals to attract and retain personnel.
Figure 7: Average Payroll and Benefit Expenses per Hospital Employee
Description: The Average Payroll and Benefits per Hospital Employee graph shows the total hospital payroll and benefits expense divided by total hospital-based personnel, with one series each for Grand Rapids, Detroit, the entire US, and the benchmark communities (a mix of Buffalo NY, Rochester NY, Louisville KY, and Milwaukee WI) from 2005 to 2022. The series follow a gently increasing, more-or-less parallel pattern since 2017, with Grand Rapids lowest, then benchmark communities, then US average, and Detroit is the highest.
Source: American Hospital Association (2024).
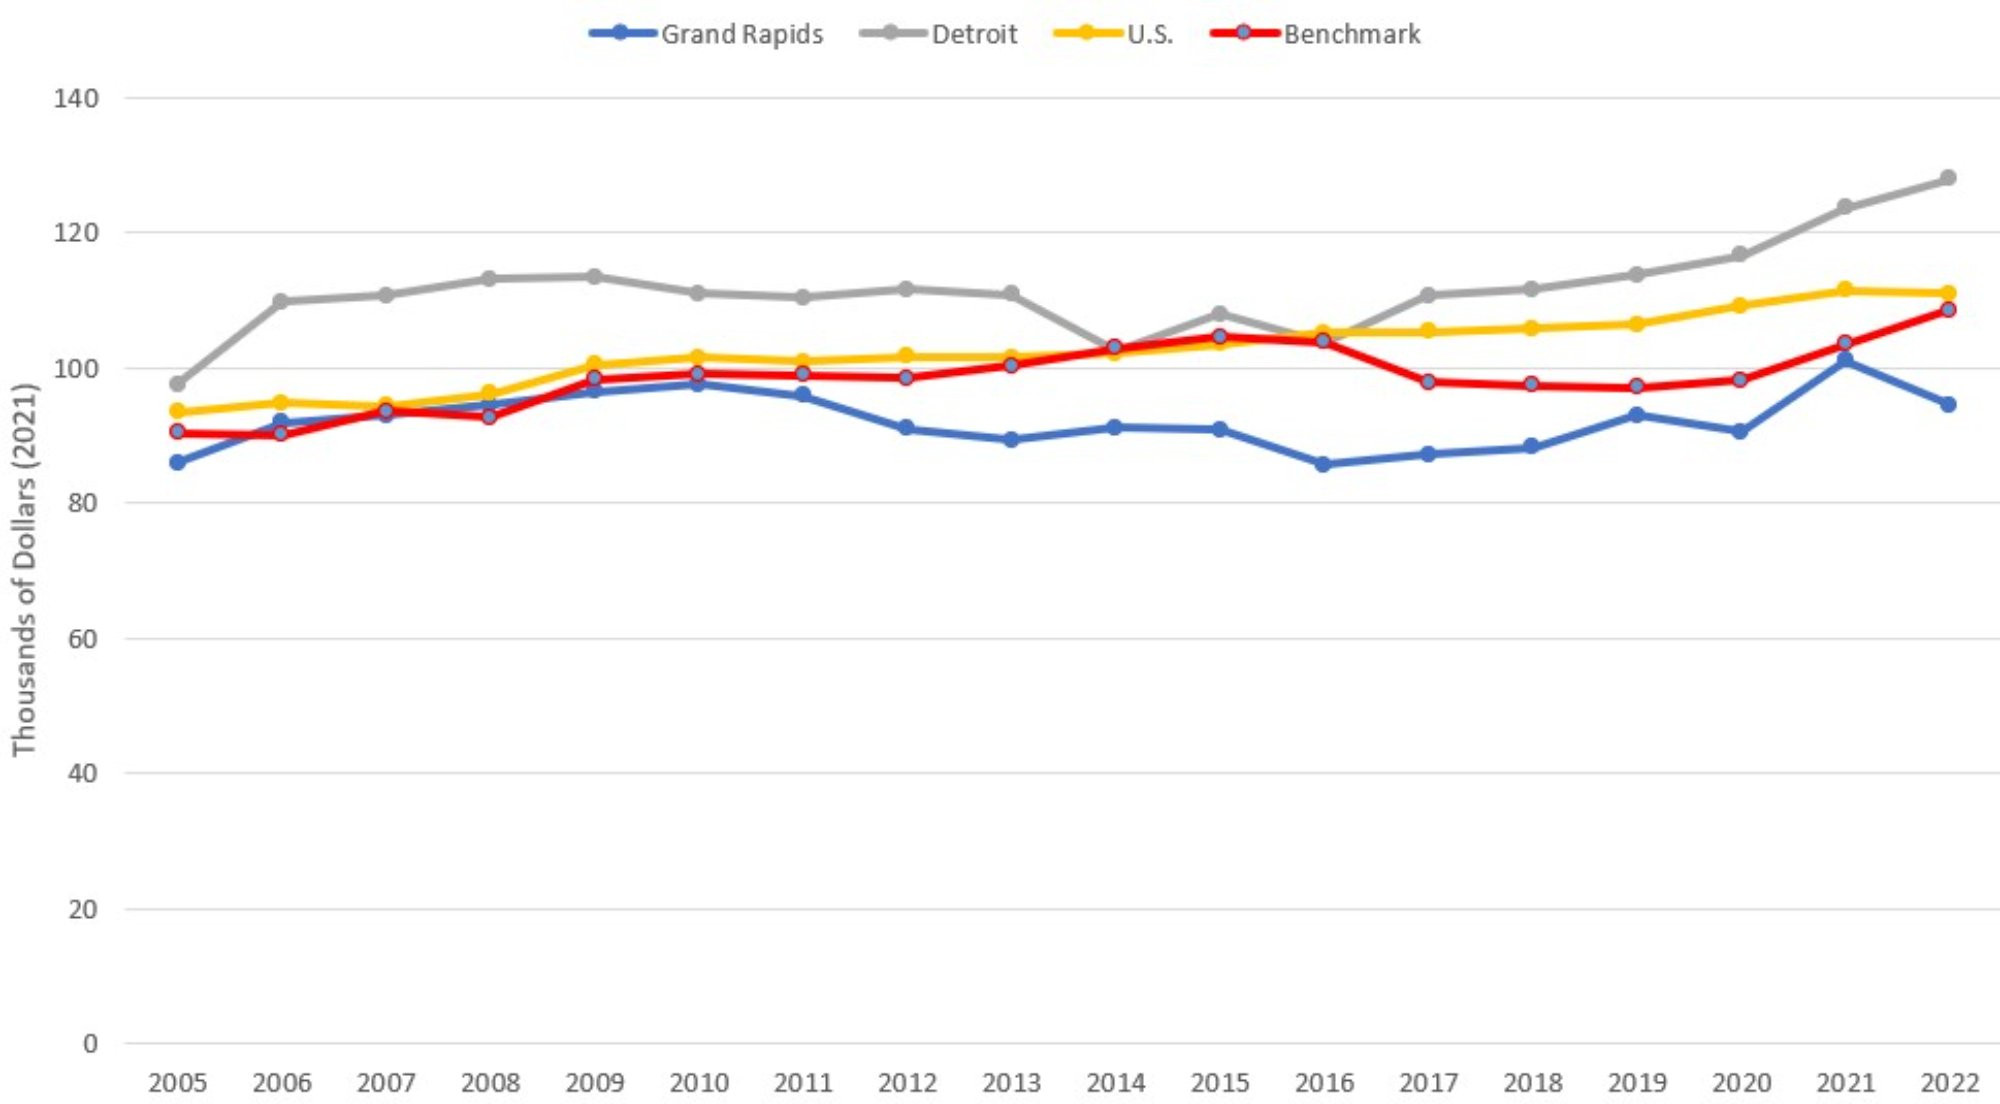
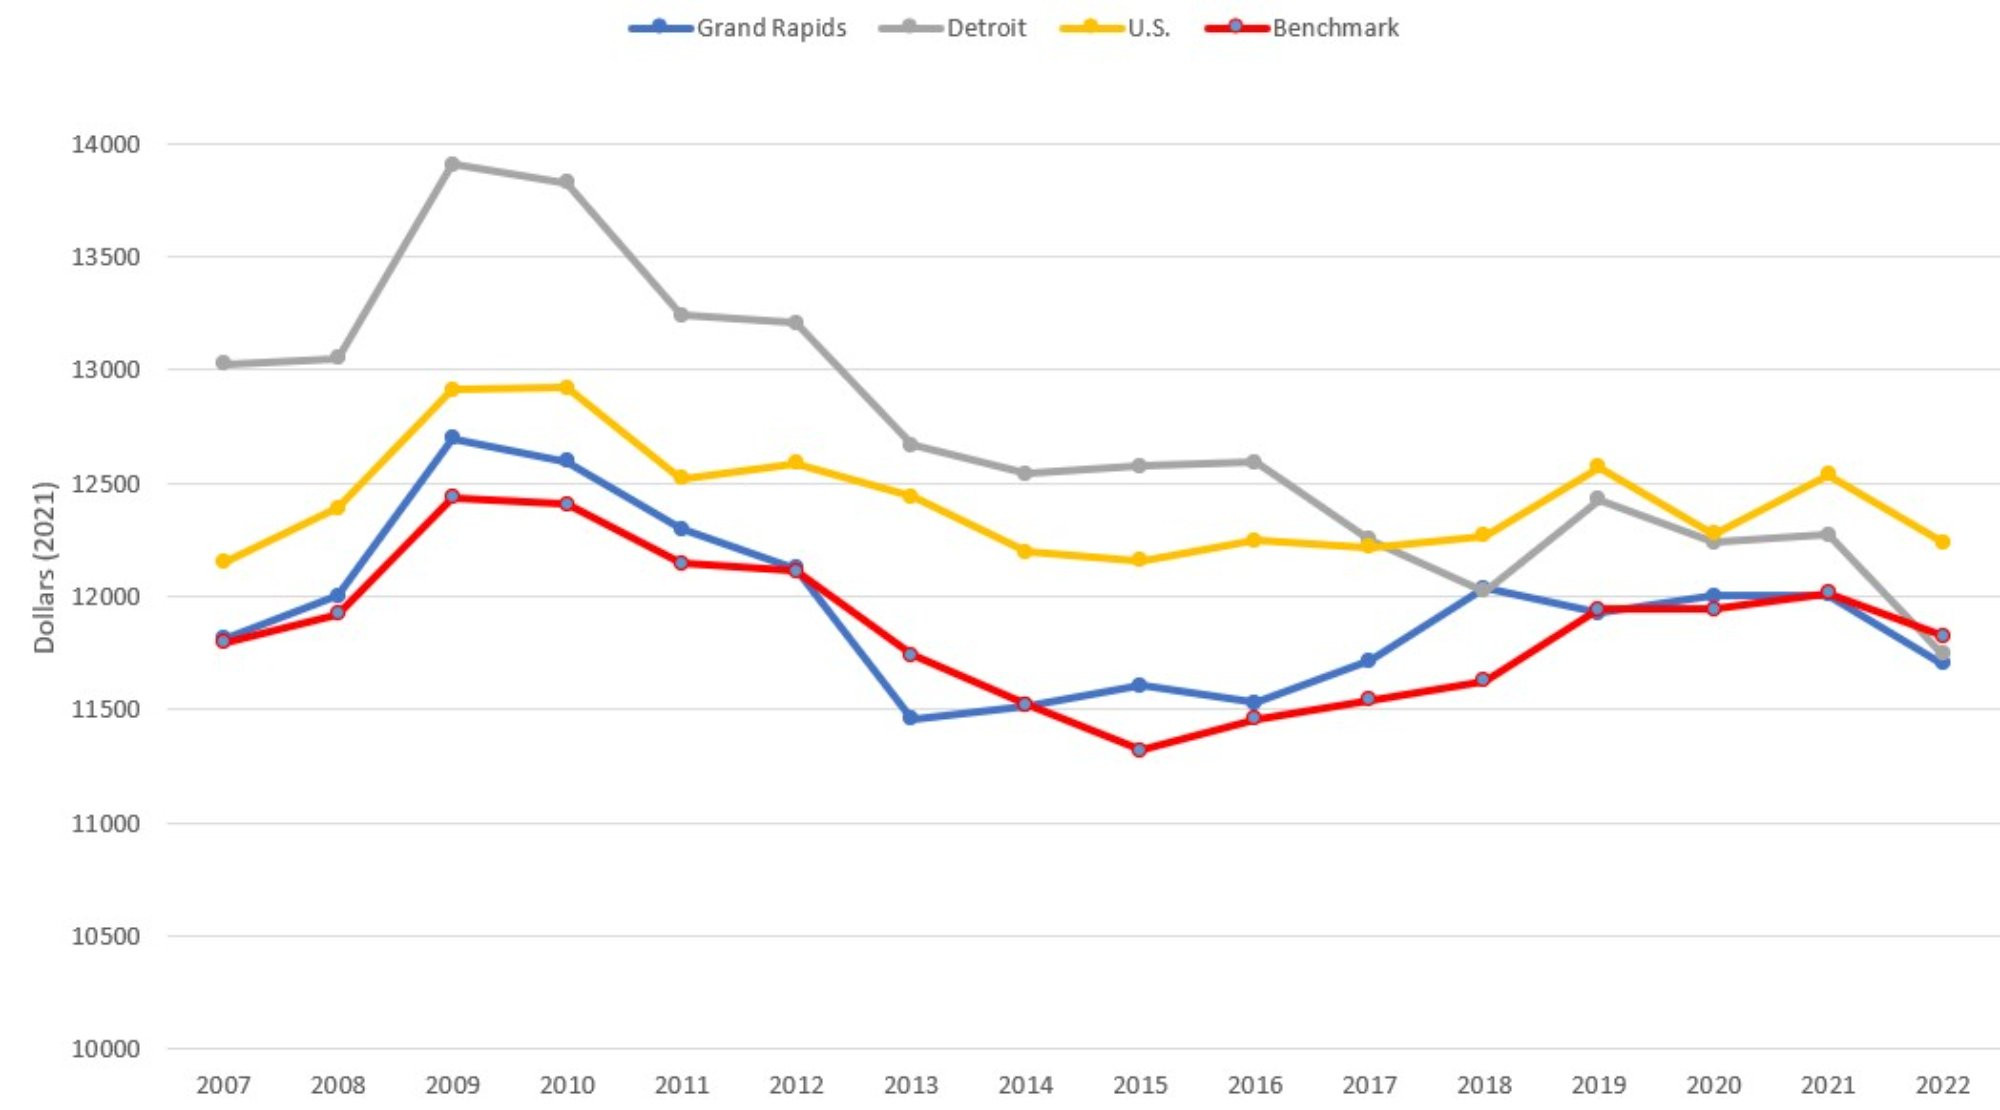
Figure 8 displays total inflation-adjusted hospital expenses per admission. It is important to recognize that Figure 8 measures the total expenses reported by the hospital, divided by the reported number of admissions. It does not reflect patient or insurer expenditures on hospital care. While real expenses per admission have risen consistently for every comparison group over the past 16 years, there was some divergence among the comparison communities in 2022 that left expenses per admission not far off their long-term trends. Grand Rapids experienced the greatest increase in hospital expenses at 9 percent while Detroit experienced a small decline of 1 percent, which was the only decline observed in 2022. The large increase in Grand Rapids is difficult to explain, given that admissions and compensation per employee had declined over the same period. The only other utilization measures consistent with this increase are the increased length of stay and increased hospital personnel per capita. This points to increased average illness severity and resources consumed during each admission. While it has not been unusual for Grand Rapids to have significantly higher expenses per admission than the other comparison communities, it would be concerning if the divergence continued in the future.
Figure 8: Total Hospital Expenses per Admission
Description: The Total Hospital Expenses per Admission graph shows total hospital expenses divided by the number of hospital admissions, with one series each for Grand Rapids, Detroit, the entire US, and the benchmark communities (a mix of Buffalo NY, Rochester NY, Louisville KY, and Milwaukee WI) from 2005 to 2022. The series follow an increasing, more-or-less parallel pattern since 2015, with Detroit lowest, then US average, then benchmark communities, and Grand Rapids is the highest.
Source: American Hospital Association (2024).
Figure 9 plots real per capita Medicare expenditures, combining both fee-for- service (FFS) and Medicare Advantage (MA) enrollees, from 2007 through 2022. These figures represent the average annual per capita government expenditure for a Medicare beneficiary in each of the comparison communities. Data on FFS Medicare enrollment and expenditures and MA enrollment were obtained through the Centers for Medicare and Medicaid Services (CMS) Geographic Variation Public Use File (Centers for Medicare and Medicaid Services, 2024). The FFS expenditures in have been adjusted for regional differences in prices, population age, gender, and race. Measures of MA expenditures were calculated using year-specific benchmark payment rates, which provide an approximate estimate of county-level MA spending. Due to the nature of the data used to construct Figure 9, geographic regions are defined as the primary county in the MSA (e.g. estimates for Grand Rapids are specific to Kent County). These figures include expenditures for physician and hospital care but exclude expenditures on prescription medications. Additionally, in cases where treatment was received in a county outside of where the patient resides, CMS assigns expenditures to the county in which the patient lived and not the county where the treatment was performed.
In all previous versions of this report, the FFS expenditures were also risk-adjusted according to Medicare’s Hierarchical Condition Categories (HHC) model. Unfortunately, in the 2022 data, the Public Use File no longer reports risk-adjusted spending and so the actual risk-adjusted Medicare FFS spending in each county was unavailable to us. We did, however, know the non-risk-adjusted spending and the average risk score for each of these counties. Therefore, to produce the 2022 estimates, we used the 2019 data to model risk adjusted spending as a function of unadjusted spending, the inverse of the average county risk score, and an interaction term to produce a predicted risk-adjusted spending value. The model had an R-squared of 0.875, and so did a fairly good job of predicting the 2019 risk-adjusted spending. These predicted values are included in this year’s report and the team will reevaluate this approach in the future.
Despite rising Medicare expenditures in Grand Rapids from 2016 to 2018, spending had leveled off and remained stable up to 2021. Real expenditures fell in 2022 by comparable amounts across all comparison communities. This is not due to falling nominal expenditures, however, which actually increased by a small amount between 2021 and 2022. Rather, the decline in real expenditures is entirely due to the high rate of inflation in 2022.
In conclusion, the year 2022 is on trend for many health care capacity, utilization, and spending variables. For Grand Rapids, the news is particularly good. Compared to 2021, the city experienced declines in per capita hospital admissions, outpatient visits, ED visits, and expenses per hospital employee. None of the other comparison communities exhibited this pattern. Together with the rising average length of stay and total hospital expenses per admission, this suggests that Grand Rapids has been successful in keeping the relatively less severe cases out of the hospital and devoting resources primarily to the most severe. Burnout among hospital employees appears to be less of a factor in Grand Rapids than in the other communities, given the city’s ability to grow the hospital-based workforce without raising real compensation.
Figure 9: Adjusted Medicare Expenditures per Medicare Enrollee
Description: The Adjusted Medicare Expenditures per Medicare Enrollee graph shows risk-adjusted Medicare expenditure divided by the number of Medicare Enrollees (Parts A, B, and C), with one series each for Grand Rapids, Detroit, the entire US, and the benchmark communities (a mix of Buffalo NY, Rochester NY, Louisville KY, and Milwaukee WI) from 2005 to 2022. The series have generally been declining since 2009, but have leveled off since 2018 and are all fairly close in magnitude.
Source: Medicare Advantage Ratebook (2022) and Medicare Geographic Variation Public Use File (2022).
References
American Hospital Association (AHA). (2024). AHA hospital statistics 2024 edition. Health Forum LLC, an affiliate of the American Hospital Association, Washington, D.C.
Birkmeyer, John D., Amber Barnato, Nancy Birkmeyer, Robert Bessler, and Jonathan Skinner. “The impact of the COVID-19 pandemic on hospital admissions in the United States: study examines trends in U.S. hospital admissions during the COVID-19 pandemic.” Health Affairs 39, no. 11 (2020): 2010-2017. Bradley, Meredith, and Praveen Chahar. “Burnout of health care providers duringCOVID-19.” Cleveland Clinic journal of medicine (2020).
Buursma, Madalyn. (2021, September) “Spectrum Health: Be Mindful when Going to the Emergency Room.”WoodTV.com. Retrieved October 4, 2023, from https:// www.woodtv.com/news/grand-rapids/spectrum-health-be-mindful-when-going-to-the-emergency-room.
Centers for Disease Control and Prevention. 2022. COVID-19 Data Tracker. Accessed on September 30, 2022. https://covid.cdc.gov/covid-data-tracker/#datatracker-home.
Centers for Medicare & Medicaid Services. (2024). Geographic Variation Public Use File. Retrieved September 26, 2024, https://data.cms.gov/summary-statistics-on-use-and-payments/medicare-geographic-comparisons/medicare-geographic-variation-by-national-state-county.
Czeisler MÉ, Marynak K, Clarke KE, et al. Delay or Avoidance of Medical Care Because of COVID-19-Related Concerns — United States, June 2020. Morbidity and Mortality Weekly Report 2020; 69:1250–1257. DOI: http://dx.doi.org/10.15585/mmwr.mm6936a4.
Erb, Robin and Carter Barrett. (2021, July) “Michigan emergency rooms confront ‘tidal wave of sadness’ among young patients.” WoodTV.com. Retrieved October 4, 2023, from https://www.freep.com/story/news/local/michigan/2021/07/02/emergency-rooms-mental-health-children-michigan/7833040002.
Hartnett, Kathleen P., Aaron Kite-Powell, Jourdan DeVies, Michael A. Coletta, Tegan K. Boehmer, Jennifer Adjemian, and Adi V. Gundlapalli. “Impact of the COVID-19 pandemic on emergency department visits – United States, January 1, 2019 – May 30, 2020.” Morbidity and Mortality Weekly Report 69, no. 23 (2020): 699.
Heist, Tyler, Karyn Schwartz, and Sam Butler. 2021. “Trends in Overall and Non-COVID-19 Hospital Admissions.” Kaiser Family Foundation. Issue Brief. Retrieved October 4, 2023, from https://www.kff.org/health-costs/issue-brief/trends-in-overall-and-non-covid-19-hospital-admissions.
Jalili, Mohammad, Mahtab Niroomand, Fahimeh Hadavand, Kataun Zeinali, and Akbar Fotouhi. “Burnout among health care professionals during COVID-19 pandemic: a cross- sectional study.” International archives of occupational and environmental health 94, no. 6 (2021): 1345-1352.
Lovern, Keely. (2021, September) “‘There’s just so many people’: Emergency rooms, hospital beds in West Michigan are overflowing.” WZZM. Retrieved October 4, 2023, from https://www.wzzm13.com/article/news/local/theres-just-so-many-people-emergency-rooms-hospital-beds-in-west- michigan-are-overflowing/69-5435ab38-1fae-403b-9eba- 53705ea4bf09.
McVicar, Brian. (2021, September) “Emergency room visits climb, create longer wait times at Spectrum Health.” MLive. Retrieved October 4, 2023, from https://www.mlive.com/news/grand-rapids/2021/09/emergency-room-visits-climb-create-longer-wait-times-at-spectrum-health.html.
Mehrotra, Ateev, Michael E. Chernew, David Linetsky, Hilary Hatch, David M. Cutler, Eric C. Schneider. “The Impact of COVID-19 on Outpatient Visits in 2020: Visits Remained Stable, Despite a Late Surge in Cases” (Commonwealth Fund, Feb. 2021). https://doi.org/10.26099/bvhf-e411.
Sharifi, Mehrdad, Ali Akbar Asadi-Pooya, and Razieh Sadat Mousavi-Roknabadi. “Burnout among health care providers of COVID-19; a systematic review of epidemiology and recommendations.” Archives of Academic Emergency Medicine 9, no. 1 (2021).
Wharton Research Data Services. (2024) American Hospital Association Annual Survey History (1994 – Latest Year). Retrieved September 24, 2024. https://wrds-www.wharton.upenn.edu/pages/get-data/american-hospital-association/history/aha-annual-survey-history-1994-latest-year.